

Paper Menu >>
Journal Menu >>
 Engineering, 2013, 5, 123-125 http://dx.doi.org/10.4236/eng.2013.510B025 Published Online October 2013 (http://www.scirp.org/journal/eng) Copyright © 2013 SciRes. ENG Mechanism of Cuff-Less Blood Pressure Measurement Using MMSB Yibin Li, Yangyu Gao, Ning Deng Institute of Microelectronics, Tsinghua University, Beijing, 100084, China Email: yb[email protected], [email protected] Received December 2012 ABSTRACT Continuous measurement of blood pressure based on pulse transit time (PTT) using GMR sensors is the state-of-art non-invasive cuff-less method in which modulated magnetic signature of blood (MMSB) is used. In this paper, the me - chanism of MMSB is inv e stigated. According to the experimental results, it is found that both blood pulse flowing through the applied magnetic field and the displacement of the GMR sensor caused by blood pulse contribute to the disturbance of magnetic fi e l d de t e c ted by GMR se nsors. The feasibility of MMSB method is discussed as well. Keywords: Blood Pressure; Magnetic Sensor; Pulse Transit Time 1. Introduction Blood pressure (BP) is one of the most important vital signs for people’s healthcare. Recently, the MMSB com- bined with electrocardiographic (ECG) was proposed to continuously measure the blood pressure [1,4,10,12]. However , the origin of MMSB is not yet clear enou gh for practical applications. Some researchers believ ed that the signal detected by GMR sensors reflected the disturbance caused by blood flow in an applied magnetic field [2,3], while others argued that this disturbance could be neg- lected. This means there should be other reasons respon- sible for the detected signal [5]. Clarifying the origin of MMSB signal is very important for developing a real blood pressure measurement system. In this paper, a prototype system is established to measure the blood pressure by MMSB. The mechanism of MMSB is investigated and verified by our experimen- tal results. The feasibility of MMSB method is discussed as well. 2. Experimental Setup The prototype system consists of three main parts: MMSB acquisition circuit (including the magnetic sensor), ECG acquisition circuit and back-en d signal process ing system. To obtain MMSB signal, a GMR sensor (AH002-02, NVE Corp.) is used. A permanent magnet with diameter of 2 cm is placed 2.5 cm away from the sensor. This permanent magnet is used to provide a bias magnet field to make the GMR sensor work in the linear region. In order to show the MMSB signal clearly, an oscil- loscope is used before the MMSB signal is sampled by A/D converter. Back-end processing system includes two parts: amplifiers and lo w-pass filters . Considering the signal of MMSB is of the same order as the background noise, the back-end processing system is carefully de- signed so that the noise is suppressed as much as possi- ble. 3. Origins of MMSB In previous studies, the disturbance of magnetic field cause by blood flow in the applied magnetic field is con- sidered the only reason responsible to the MMSB [7,9]. Some research work showed that the disturbance of mag- netic field caused by the blood flow is only about 10−5 Gauss [5]. Unfortunately, the GMR sensors experience small movement caused by blood pulse during measure- ment. Th e angle between the magnetic sensitive direction of the GMR sensor and the geomagnetic field changes with the position of the sensor. Accordingly, this will result in an extra disturbance on the detected signal. We believed that this displacement of sensors contributes to the MMSB besides the change of magnetic field caused by blood fl ow. Hereafter we evaluate the disturbance caused by the displacement. Parameters used are defined as following. Magnetic field intensity of the environment: B Geomagnetic field intensity : BG Inclined angle of the sensor: θ Sensitivity of the sensor: S Power supply voltage: V Magnitu de of Se nsor outp ut: Voutput 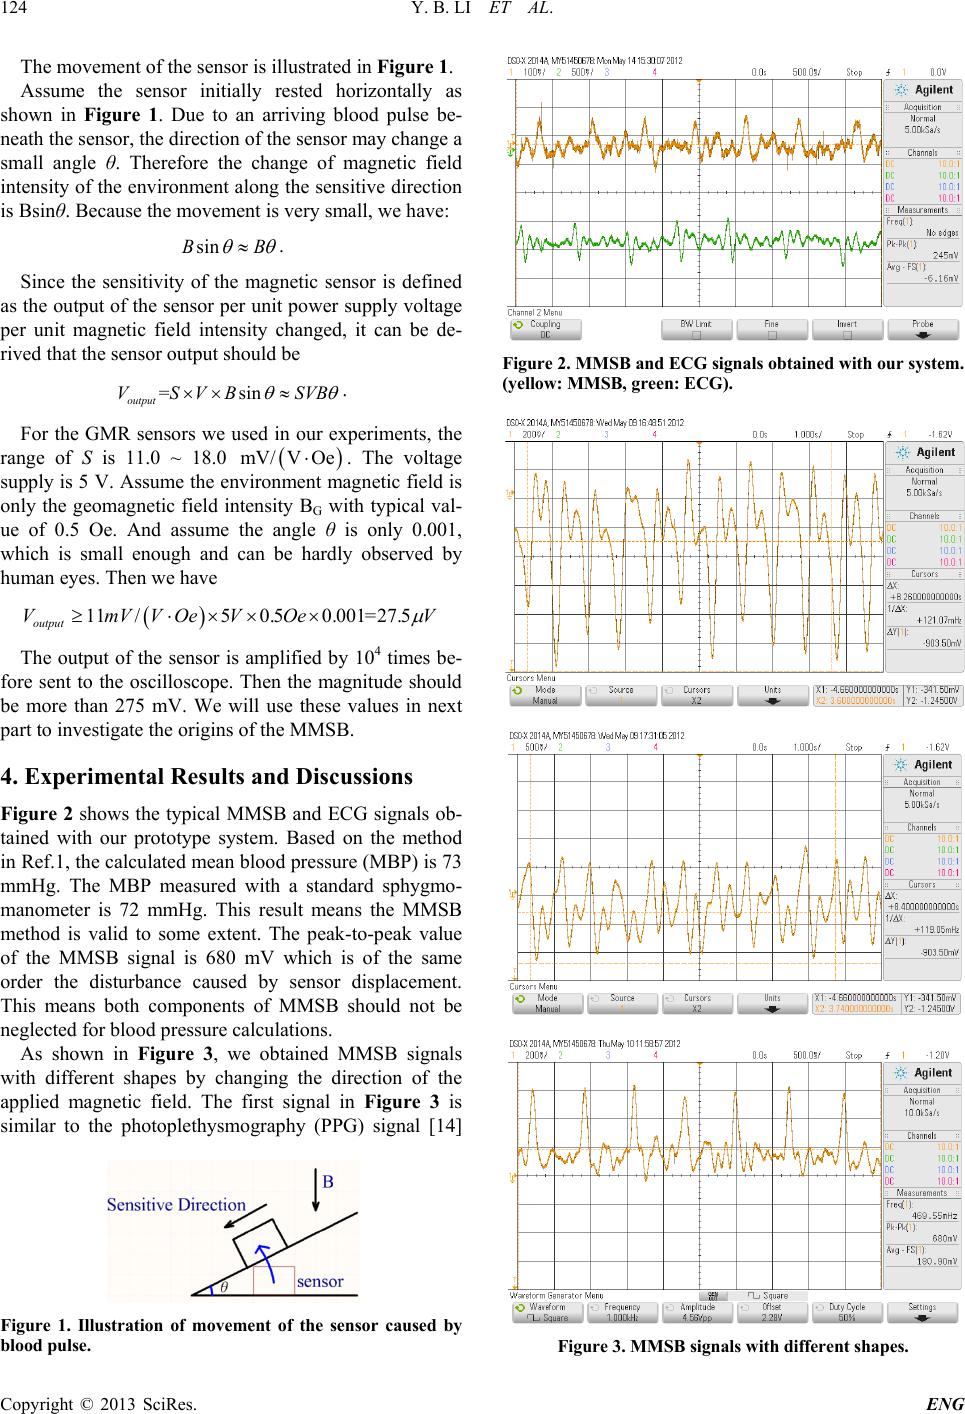 Y. B. LI ET AL. Copyright © 2013 SciRes. ENG 124 The movement of the sensor is illustrated in Figure 1. Assume the sensor initially rested horizontally as shown in Figure 1. Due to an arriving blood pulse be- neath the sensor, the direction of the sensor may change a small angle θ. Therefore the change of magnetic field intensity of the environment along the sensitive direction is Bsinθ. Because the movement is very small, we have: sinBB θθ ≈ . Since the sensitivity of the magnetic sensor is defined as the output of the sensor per unit power supply voltage per unit magnetic field intensity changed, it can be de- rived that the sensor output should be = sin output VS VBSVB θθ ×× ≈ . For the GMR sensors we used in our experiments, the range of S is 11.0 ~ 18.0 ( ) mV/V Oe⋅ . The voltage supply is 5 V. Assume the environment magnetic field is only the geomagnetic field intensity BG with typical val- ue of 0.5 Oe. And assume the angle θ is only 0.001, which is small enough and can be hardly observed by human eyes. Then we have ( ) 11 /5 0.50.001=27.5 output VmVV OeVOeV µ ≥⋅ ××× The output of the sensor is amplified by 104 times be- fore sent to the oscilloscope. Then the magnitude should be more than 275 mV. We will use these values in next part to investigate the origins of the MMSB. 4. Experimental Results and Discussions Figure 2 shows the typical MMSB and ECG signals ob- tained with our prototype system. Based on the method in Ref.1, the calculated mean blood pressure (MBP) is 73 mmHg. The MBP measured with a standard sphygmo- manometer is 72 mmHg. This result means the MMSB method is valid to some extent. The peak-to-peak value of the MMSB signal is 680 mV which is of the same order the disturbance caused by sensor displacement. This means both components of MMSB should not be neglected for blood press u r e c a l c ulations. As shown in Figure 3, we obtained MMSB signals with different shapes by changing the direction of the applied magnetic field. The first signal in Figure 3 is similar to the photoplethysmography (PPG) signal [14] Figure 1. Illustration of movement of the sensor caused by blood pulse. Figure 2. MMSB and ECG si gnals obt ai ned w it h our sys te m. (yellow: MMSB, green: ECG). Figure 3. MMSB signals with different shapes. 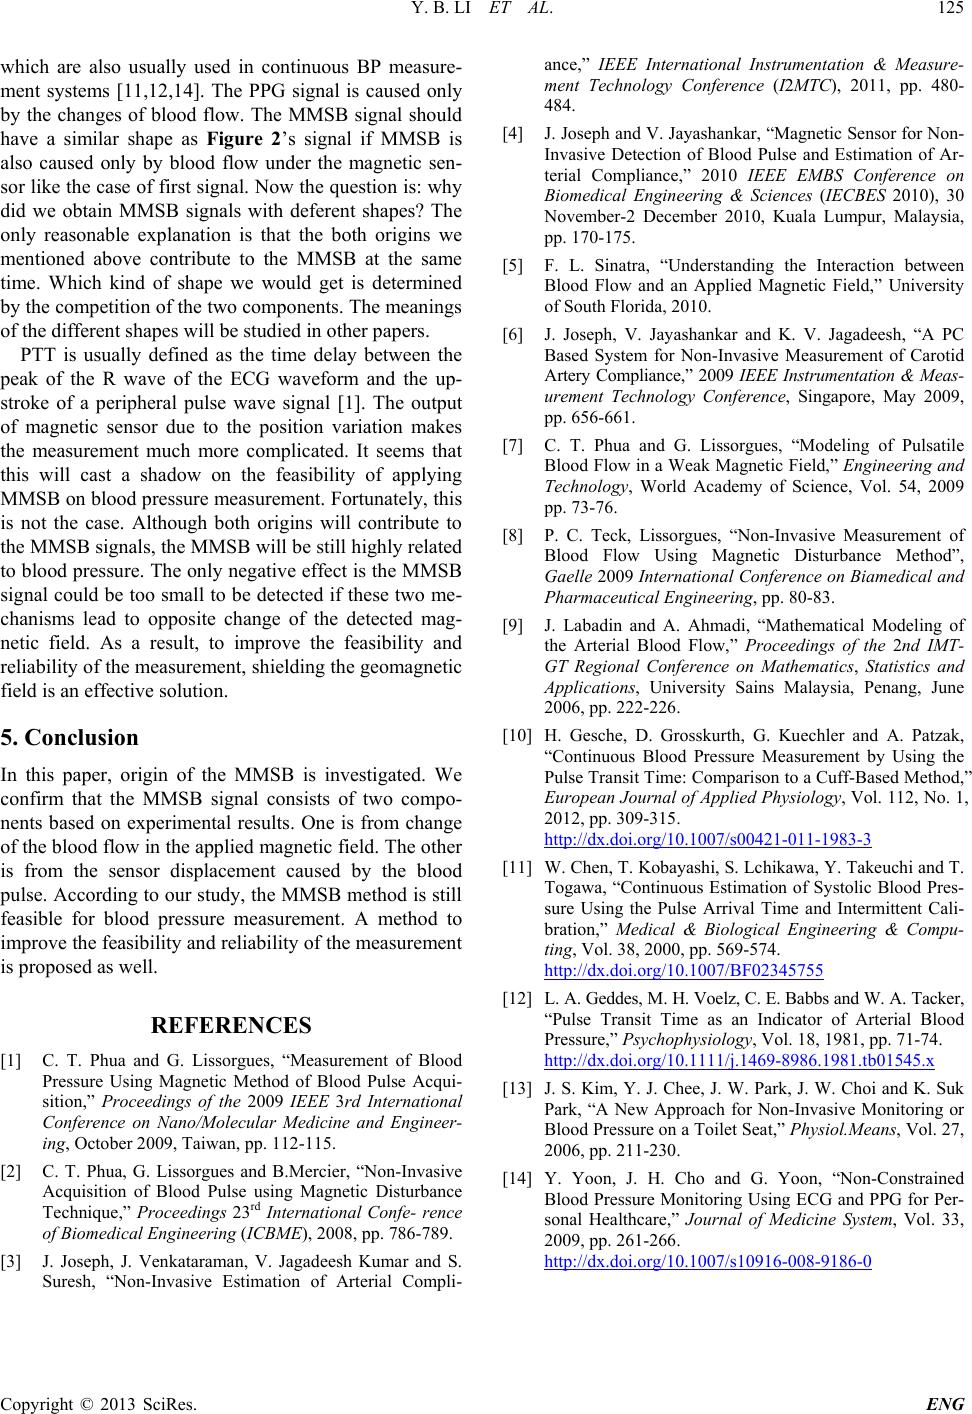 Y. B. LI ET AL. Copyright © 2013 SciRes. ENG 125 which are also usually used in continuous BP measure- ment systems [11,12,14]. The PPG signal is caused only by the changes of blood flow. The MMSB signal should have a similar shape as Figure 2’s signal if MMSB is also caused only by blood flow under the magnetic sen- sor like the case of first signal. Now the question is: why did we obtain MMSB signals with deferent shapes? The only reasonable explanation is that the both origins we mentioned above contribute to the MMSB at the same time. Which kind of shape we would get is determined by the competition of the two components. The meanings of the different shapes will be studied in other papers. PTT is usually defined as the time delay between the peak of the R wave of the ECG waveform and the up- stroke of a peripheral pulse wave signal [1]. The output of magnetic sensor due to the position variation makes the measurement much more complicated. It seems that this will cast a shadow on the feasibility of applying MMSB on bloo d pre ssure measurement. Fortunately, this is not the case. Although both origins will contribute to the MMSB signals, the MMSB will be still highly related to blood pressure. The only negative effect is the MMSB signal could be too small to be detected if these two me- chanisms lead to opposite change of the detected mag- netic field. As a result, to improve the feasibility and reliability of the measurement, shielding the geomagnetic field is an effective solution. 5. Conclusion In this paper, origin of the MMSB is investigated. We confirm that the MMSB signal consists of two compo- nents based on experimental results. One is from change of the blood flow in the applied magnetic field. The other is from the sensor displacement caused by the blood pulse. According to our study, the MMSB method is still feasible for blood pressure measurement. A method to improve the feasibility and reliability of the measurement is proposed as well. REFERENCES [1] C. T. Phua and G. Lissorgues, “Measurement of Blood Pressure Using Magnetic Method of Blood Pulse Acqui- sition,” Proceedings of the 2009 IEEE 3rd International Conference on Nano/Molecular Medicine and Engineer- ing, October 2009, Taiwan, pp. 112-115. [2] C. T. Phua, G. Lissorgues and B.Mercier, “Non-Invasive Acquisition of Blood Pulse using Magnetic Disturbance Technique,” Proceedings 23rd International Confe- rence of Biomedical Engineering (ICBME), 2008, pp. 786-789. [3] J. Joseph, J. Venkataraman, V. Jagadeesh Kumar and S. Suresh, “Non-Invasive Estimation of Arterial Compli- ance,” IEEE International Instrumentation & Measure- ment Technology Conference (I2MTC), 2011, pp. 480- 484. [4] J. Joseph and V. Jay ashankar, “Magnetic Sensor for Non- Invasive Detection of Blood Pulse and Estimation of Ar- terial Compliance,” 2010 IEEE EMBS Conference on Biomedical Engineering & Sciences (IECBES 2010), 30 November-2 December 2010, Kuala Lumpur, Malaysia, pp. 170-175. [5] F. L. Sinatra, “Understanding the Interaction between Blood Flow and an Applied Magnetic Field,” University of South Florida, 2010. [6] J. Joseph, V. Jayashankar and K. V. Jagadeesh, “A PC Based System for Non-Invasive Measurement of Carotid Artery Compliance,” 2009 IEEE Instrumentation & Meas- urement Technology Conference, Singapore, May 2009, pp. 656-661. [7] C. T. Phua and G. Lissorgues, “Modeling of Pulsatile Blood Flow in a Weak Magne tic Field,” Engineering and Technology, World Academy of Science, Vol. 54, 2009 pp. 73-76. [8] P. C. Teck, Lissorgues, “Non-Invasive Measurement of Blood Flow Using Magnetic Disturbance Method”, Gaelle 2009 International Conference on Biamedical and Pharmaceutical Engineering, pp. 80-83. [9] J. Labadin and A. Ahmadi, “Mathematical Modeling of the Arterial Blood Flow,” Proceedings of the 2nd IMT- GT Regional Conference on Mathematics, Statistics and Applications, University Sains Malaysia, Penang, June 2006, pp. 222-226. [10] H. Gesche, D. Grosskurth, G. Kuechler and A. Patzak, “Continuous Blood Pressure Measurement by Using the Pulse Transit Time: Comparison to a Cuff-Ba se d Method,” European Journal of Applied Physiology, Vol. 112, No. 1, 2012, pp. 309-315. http://dx.doi.org/10.1007/s00421-011-1983-3 [11] W. Chen, T. Kobayashi, S. Lchikawa, Y. Takeuchi and T. Togawa, “Continuous Estimation of Systolic Blood Pres- sure Using the Pulse Arrival Time and Intermittent Cali- bration,” Medical & Biological Engineering & Compu- ting, Vol. 38, 2000, pp. 569-574. http://dx.doi.org/10.1007/BF02345755 [12] L. A. Geddes, M. H. Voelz, C. E. Babb s and W. A. Tacker, “Pulse Transit Time as an Indicator of Arterial Blood Pressure,” Psychophysiology, Vol. 18, 1981, pp. 71-74. http://dx.doi.org/10.1111/j.1469-8986.1981.tb01545.x [13] J. S. Ki m, Y. J. Chee, J. W. Park, J. W. Choi and K. Suk Park, “A New Approach for Non-Invasive Monitoring or Blood Pressure on a Toilet Seat,” Physiol.Means, Vol. 27, 2006, pp. 211-230. [14] Y. Yoon, J. H. Cho and G. Yoon, “Non-Constrained Blood Pressure Monitoring Using ECG and PPG for Per- sonal Healthcare,” Journal of Medicine System, Vol. 33, 2009, pp. 261-266. http://dx.doi.org/10.1007/s10916-008-9186-0 |