Paper Menu >>
Journal Menu >>
 Engineering, 2013, 5, 118-122 http://dx.doi.org/10.4236/eng.2013.510B024 Published Online October 2013 (http://www.scirp.org/journal/eng) Copyright © 2013 SciRes. ENG An Adaptive Pulse Compression Filter for Ultrasound Contrast Harmonic Imaging Jenho Tsao, Ming-Huang Chen Graduate Institute of Biomedical Electronics and Bioinformatics, National Taiwan University Email: [email protected] Received December 2012 ABSTRACT Coded excitation is useful for ultrasound contrast imaging to increase penetration and SNR, and improve the contrast to tissue ratio (CTR). The waveform of bubble response depends greatly on bubble size, the frequency and bandwidth of the excitation chirp signal. This makes the pulse compression filter based on square-law be wrong for bubbles with changing sizes. In this paper, an adaptive pulse compression (APC) filter for the second harmonic of microbubble with varying size distribution is proposed. The APC filter is designed based on the estimated power spectrum of the received bubble harmonic echoes. Theoretical analysis and simulation studies are presented for evaluating performance of the APC filter. For monodisperse bubble, the power improvement factor of the APC filter can be more than 20 dB. Keywords: Ultrasound Contrast Imaging; Square Law Pulse Compression; Adaptive Pulse Compression 1. Introduction Coded excitation is useful for ultrasound imaging to in- crease penetration and SNR. For improving the CTR (contrast to tissue ratio) in ultrasound contrast imaging, coded excitation is preferred also. In a previous research, Borsboom et al. suggest a nonlinear compression f ilter to do pulse compression for bubble second harmonic imag- ing [1]. They made use of a square law (SQL) model to design the pulse compression filter, which had the twice instant a neous fre quency of the transmitted chirp. The performance of microbubble agents depends on their resonant character to differ fro m tissue; th e resonant character of bubble depends greatly on th e size of bubble , and the frequency, bandwidth and waveform of the exci- tation signal. Novell et al. indicated that for up-sweep chirp, bubbles below resonance size provided a longer response; whereas bubbles above resonance size produced much more damped responses with large amplitude ex- cursions [2]. Macdonald et al. showed that larger bubbles had more shift in resonance frequency than smaller bub- bles. Also, the resonance frequency shifted to lower fre- quency when driving pressure was increased [3]. In this study, it is shown by simulation that chirp re- sponse of bubble depends greatly on the size of bubble and the frequency, bandwidth the excitation chirp signal. The pulse compression filter designed based on the SQL model (SPC) is a fixed pulse compression filter; equiva- lently it assumes that the chirp response of bubble is in- variant. In reality, microbub bles have a time-varying size distribution in the p erfusion region of interest, bubbles of different sizes respond to chirp excitation differently. This will lead to restrictions on the performance of the SPC filter. Consequently adaptive pulse compression (APC) is required to maximize the backscatter power of microbubbles for contrasting imaging to increase SNR. In this paper, we propose an adaptive pulse compres- sion filter to compress the second harmonic of bubble while microbubbles have a time var ying size distribu tion. It is found that bandwidth of the second harmonic will be reduced while bubbles are excite to resonate. The APC filter is designed based on the estimated power spectrum of the received bubble harmonic echoes. Thus, it ch anges the pulse compression filter for bubble of different sizes adaptively to optimize the output power. In the follows, theoretical analysis of the pulse com- pression problem is given in Section 2. The proposed adaptive pulse compression filter is given in Section 3. The performance of the APC filter is studied using s imu - lation signals generated by BubbleS im [4] 2. Theories Since the bubble response to chirp excitation is compli- cated, the theoretical foundations for the pulse compres- sion problems are given below, step by step. 2.1. Bubble Response The ultrasound contrast agents are encapsulated micro - * This work is supported by the Natio nal Science Co uncil, Taiw an, ROC (NSC101-2221-E-002-081). 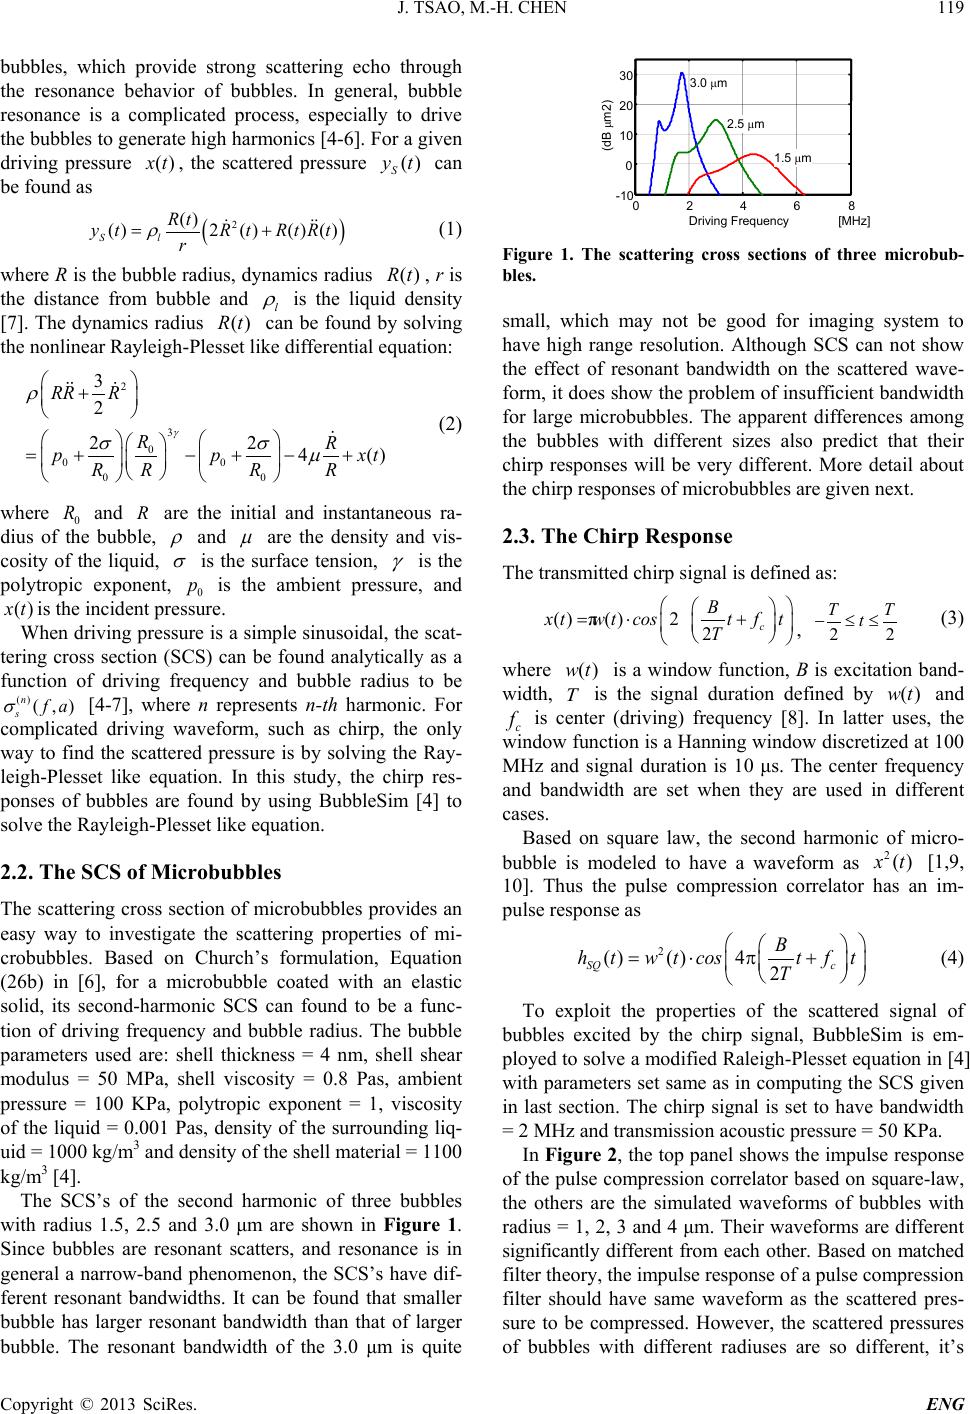 J. TSAO, M.-H. CHEN Copyright © 2013 SciRes. ENG 119 bubbles, which provide strong scattering echo through the resonance behavior of bubbles. In general, bubble resonance is a complicated process, especially to drive the bubbles to generate high harmonics [4-6]. For a given driving pressure ()xt , the scattered pressure () S yt can be found as ( ) 2 () ()2()() () Sl Rt y tR tRtRt r ρ = + (1) where R is the bubble radius, dynamics radius () Rt , r is the distance from bubble and l ρ is the liquid density [7]. The dynamics radius () Rt can be found by solving the nonlinear Rayleigh-Plesset like differential equation: 2 3 0 00 00 3 2 22 4 () RR R RR pp xt RRR R γ ρ σσ µ + =+−+ −+ (2) where 0 R and R are the initial and instantaneous ra- dius of the bubble, ρ and µ are the density and vis- cosity of the liquid, σ is the surface tension, γ is the polytropic exponent, 0 p is the ambient pressure, and ()xt is the incident pressure. When driving pressure is a simple sinusoidal, the scat- tering cross section (SCS) can be found analytically as a function of driving frequency and bubble radius to be () (,) n s fa σ [4-7], where n represents n-th harmonic. For complicated driving waveform, such as chirp, the only way to find the scattered pressure is by solving the Ray- leigh-Plesset like equation. In this study, the chirp res- ponses of bubbles are found by using BubbleSim [4] to solve the Rayleigh-Plesset like equation. 2.2. The SCS of Microbubbles The scattering cross section of microbubbles provides an easy way to investigate the scattering properties of mi- crobubbles. Based on Church’s formulation, Equation (26b) in [6], for a microbubble coated with an elastic solid, its second-harmonic SCS can found to be a func- tion of driving frequency and bubble radius. The bubble parameters used are: shell thickness = 4 nm, shell shear modulus = 50 MPa, shell viscosity = 0.8 Pas, ambient pressure = 100 KPa, polytropic exponent = 1, viscosity of the liquid = 0.001 Pas, density of the surrounding liq- uid = 1000 kg/m3 and density of the shell material = 1100 kg/m3 [4]. The SCS’s of the second harmonic of three bubbles with radius 1.5, 2.5 and 3.0 μm are shown in Figure 1. Since bubbles are resonant scatters, and resonance is in general a narrow-band phenomenon, the SCS’s have dif- ferent resonant bandwidths. It can be found that smaller bubble has larger resonant bandwidth than that of larger bubble. The resonant bandwidth of the 3.0 μm is quite 0 2 4 6 8 -10 0 10 20 30 Driving Frequency [MHz] (dB μm2) 3.0 μm 2.5 μm 1.5 μm Figure 1. The scattering cross sections of three microbub- bles. small, which may not be good for imaging system to have high range resolution. Although SCS can not show the effect of resonant bandwidth on the scattered wave- form, it does show the problem of insufficient bandwidth for large microbubbles. The apparent differences among the bubbles with different sizes also predict that their chirp responses will be very different. More detail about the chirp responses of microbubbles are given next. 2.3. The Chirp Response The transmitted chirp signal is defined as: () ()2π2c B xtw tcostft T =⋅+ , 22 TT t− ≤≤ (3) where () wt is a window function, B is excitation band- width, T is the signal duration defined by () wt and c f is center (driving) frequency [8]. In latter uses, the window function is a Hann ing window discretized at 100 MHz and signal duration is 10 μs. The center frequency and bandwidth are set when they are used in different cases. Based on square law, the second harmonic of micro- bubble is modeled to have a waveform as 2 ()xt [1,9, 10]. Thus the pulse compression correlator has an im- pulse res ponse as 2 ()()4 2 SQ c B htw tcostft T =⋅π+ (4) To exploit the properties of the scattered signal of bubbles excited by the chirp signal, BubbleSim is em- ployed to solve a modified Raleigh-Plesset equation in [4] with parameters set same as i n computing the SCS given in last section. The chirp signal is set to have bandwidth = 2 MHz and transmission acoustic pressure = 50 KPa. In F igure 2, the top panel shows the impulse response of the pulse compression correlator based on square-law, the others are the simulated waveforms of bubbles with radius = 1, 2, 3 and 4 μm. Their waveforms are different significantly different from each other. Based on matched filter theory, the impulse response of a pulse compression filter should have same waveform as the scattered pres- sure to be compressed. However, the scattered pressures of bubbles with different radiuses are so different, it’s 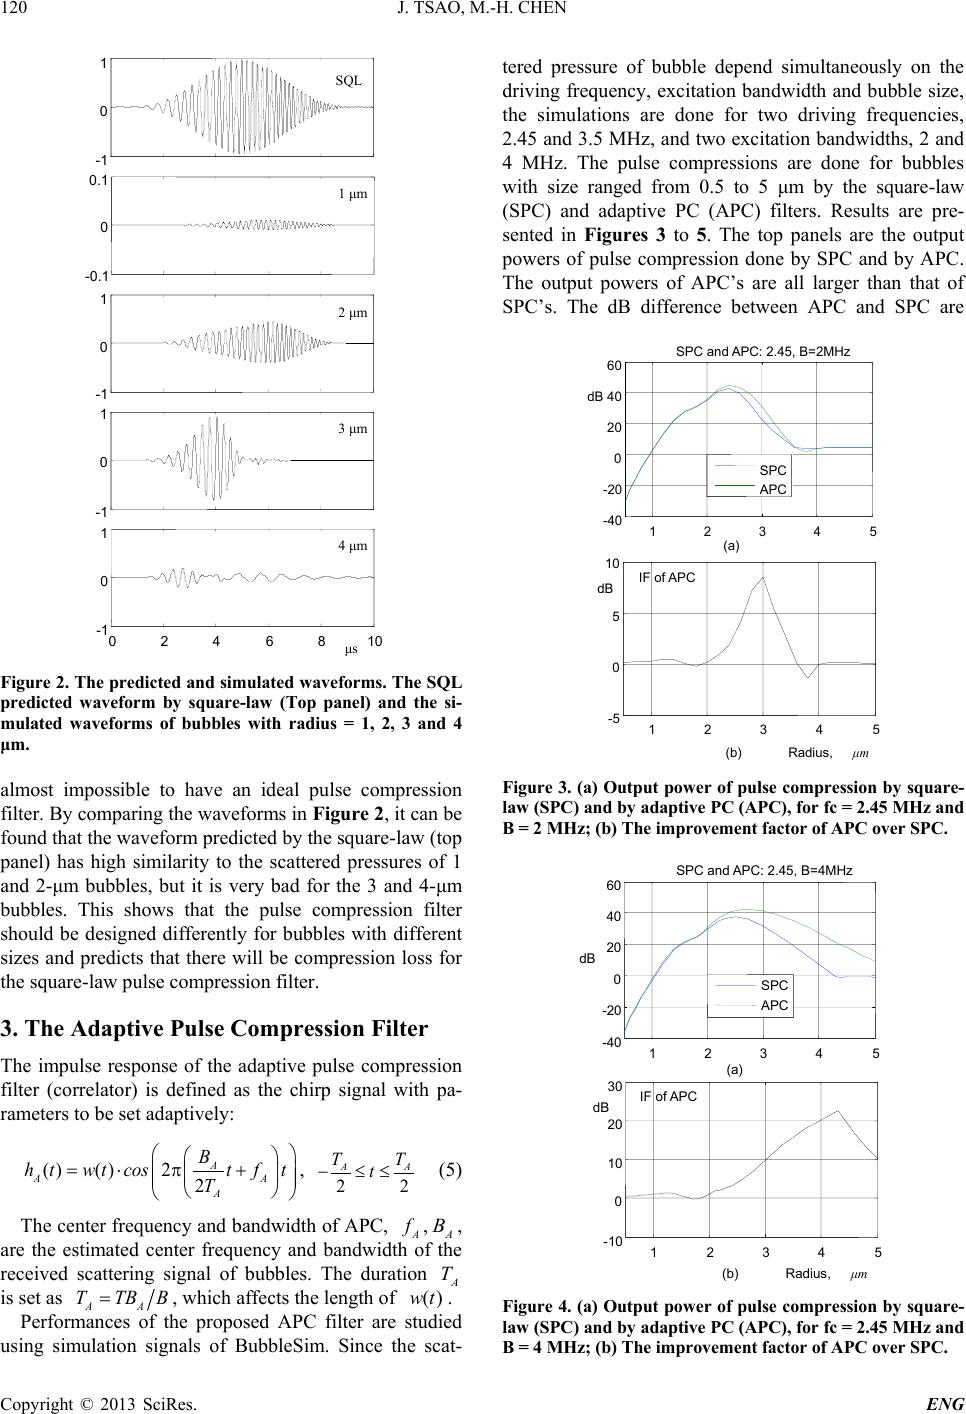 J. TSAO, M.-H. CHEN Copyright © 2013 SciRes. ENG 120 0.1 0 -0.1 -1 0 1 1 μm 2 μm -1 0 1 0 2 4 6 8 10 -1 0 1 μs 3 μm 4 μm -1 0 1 SQL Figure 2. The pre dicted and sim ulated wave forms. The SQL predicted waveform by square-law (Top panel) and the si- mulated waveforms of bubbles with radius = 1, 2, 3 and 4 μm. almost impossible to have an ideal pulse compression filter. By comparing the waveforms in Figure 2, it can be found that the waveform predicted by the square-law (top panel) has high similarity to the scattered pressures of 1 and 2-μm bubbles, but it is very bad for the 3 and 4-μm bubbles. This shows that the pulse compression filter should be designed differently for bubbles with different sizes and predicts that there will be compression loss for the square-law pulse compression filter. 3. The Adaptive Pulse Compression Filter The impulse response of the adaptive pulse compression filter (correlator) is defined as the chirp signal with pa- rameters to be set adaptively: ()()2 2 A AA A B htw tcostft T =⋅π + , 22 AA TT t− ≤≤ (5) The center frequency and bandwidth of APC, A f , A B , are the estimated center frequency and bandwidth of the received scattering signal of bubbles. The duration A T is set as AA TTBB= , which affects the length of () wt . Performances of the proposed APC filter are studied using simulation signals of BubbleSim. Since the scat- tered pressure of bubble depend simultaneously on the driving frequency, excitation bandwidth and bubble size, the simulations are done for two driving frequencies, 2.45 and 3.5 MHz, and two excitation bandwidths, 2 and 4 MHz. The pulse compressions are done for bubbles with size ranged from 0.5 to 5 μm by the square-law (SPC) and adaptive PC (APC) filters. Results are pre- sented in Figures 3 to 5. The top panels are the output powers of pulse compression done by SPC and by APC. The output powers of APC’s are all larger than that of SPC’s. The dB difference between APC and SPC are 1 2 3 4 5 -40 -20 0 20 40 60 (b) Radius, μm dB SPC and APC: 2.45, B=2MHz SPC APC 1 2 3 4 5 -5 0 5 dB (a) 10 IF of APC Figure 3. (a) Output pow er of pulse compressi on by square- law (SPC) and by adapti ve P C (APC), for fc = 2.45 M Hz and B = 2 MHz; (b) The im p ro v em ent factor of APC o v er SPC. 1 2 3 4 5 -40 -20 0 20 40 60 (a) dB SPC and APC: 2.45, B=4MHz SPC APC 1 2 3 4 5 -10 0 10 20 30 dB (b) Radius, μm IF of APC Figure 4. (a) Output pow er of pulse compressi on by square- law (SPC) and by a daptiv e P C (APC), for fc = 2.45 M Hz and B = 4 MHz; (b) Th e im p ro v em ent factor of APC o v er SPC. 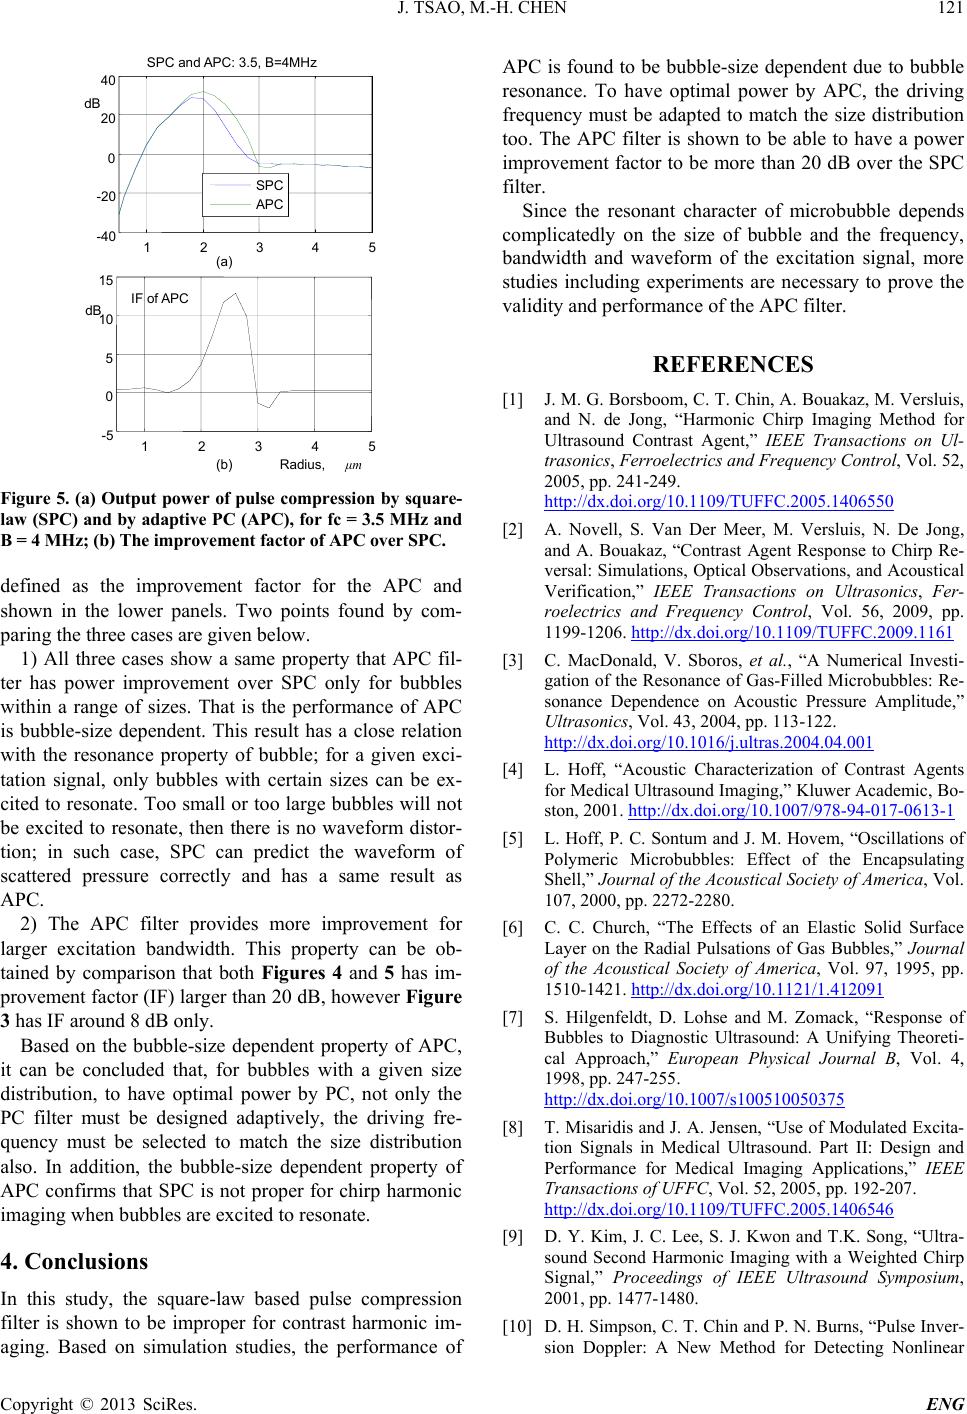 J. TSAO, M.-H. CHEN Copyright © 2013 SciRes. ENG 121 1 2 3 4 5 -40 -20 0 20 40 dB SPC APC 1 2 3 4 5 -5 0 5 10 15 IF of APC dB (b) Radius, μm (a) SPC and APC: 3.5, B=4MHz Figure 5. (a) Output pow er of pulse compressi on by square- law (SPC) and by adaptive PC (APC), f or fc = 3.5 MHz and B = 4 MHz; (b) The im p ro v em ent factor of APC o v er SPC. defined as the improvement factor for the APC and shown in the lower panels. Two points found by com- paring the three cases are given below. 1) All three cases show a same property that APC fil- ter has power improvement over SPC only for bubbles within a range of sizes. That is the performance of APC is bubble-size dependent. This result has a close relation with the resonance property of bubble; for a given exci- tation signal, only bubbles with certain sizes can be ex- cited to resonate. Too small or too large bu bbles will not be excited to resonate, then there is no waveform distor- tion; in such case, SPC can predict the waveform of scattered pressure correctly and has a same result as APC. 2) The APC filter provides more improvement for larger excitation bandwidth. This property can be ob- tained by comparison that both Figures 4 and 5 has im- provement factor (IF) larger than 20 dB, however Figure 3 has IF ar ound 8 dB only . Based on the bubble-size dependent property of APC, it can be concluded that, for bubbles with a given size distribution, to have optimal power by PC, not only the PC filter must be designed adaptively, the driving fre- quency must be selected to match the size distribution also. In addition, the bubble-size dependent property of APC confirms that SPC is not proper for chirp harmonic imagi ng when bubbl e s are excit e d t o re s o na te. 4. Conclusions In this study, the square-law based pulse compression filter is shown to be improper for contrast harmonic im- aging. Based on simulation studies, the performance of APC is found to be bubble-size dependent due to bubble resonance. To have optimal power by APC, the driving frequency must be adapted to match the size distribution too. The APC filter is shown to be able to have a power imp ro ve men t factor to be more than 20 dB over the SPC filter. Since the resonant character of micro bubble depends complicatedly on the size of bubble and the frequency, bandwidth and waveform of the excitation signal, more studies including experiments are necessary to prove the validity and performance of the APC filter. REFERENCES [1] J. M. G. Borsboom, C. T. Chin, A. Bouakaz, M. Versluis, and N. de Jong, “Harmonic Chirp Imaging Method for Ultrasound Contrast Agent,” IEEE Transactions on Ul- trasonics, Ferroelectrics and Frequency Control, Vol. 52, 2005, pp. 241-249. http://dx.doi.org/10.1109/TUFFC.2005.1406550 [2] A. Novell, S. Van Der Meer, M. Versluis, N. De Jong, and A. Bouakaz, “Contrast Agent Response to Chirp Re- versal: Simulations, Optical Observations, and Acoustical Verification,” IEEE Transactions on Ultrasonics, Fer- roelectrics and Frequency Control, Vol. 56, 2009, pp. 1199-1206. http://dx.doi.org/10.1109/TUFFC.2009.1161 [3] C. MacDonald, V. Sboros, et al., “A Numerical Investi- gation of the Resonance of Gas-Filled Microbubbles: Re- sonance Dependence on Acoustic Pressure Amplitude,” Ultrasonics, Vol. 43, 2004, pp. 113-122. http://dx.doi.org/10.1016/j.ultras.2004.04.001 [4] L. Hoff, “Acoustic Characterization of Contrast Agents for Medical Ultrasound Imaging,” Kluwer Academic, Bo- ston, 2001. http://dx.doi.org/10.1007/978-94-017-0613-1 [5] L. Hoff, P. C. Sontum and J. M. Hovem, “Oscillations of Polymeric Microbubbles: Effect of the Encapsulating Shell,” Journal of the Acoustical Society of America, Vol. 107, 2000, pp. 2272-2280. [6] C. C. Church, “The Effects of an Elastic Solid Surface Layer on the Radial Pulsations of Gas Bubbles,” Journal of the Acoustical Society of America, Vol. 97, 1995, pp. 1510-1421. http://dx.doi.org/10.1121/1.412091 [7] S. Hilgenfeldt, D. Lohse and M. Zomack, “Response of Bubbles to Diagnostic Ultrasound: A Unifying Theoreti- cal Approach,” European Physical Journal B, Vol. 4, 1998, pp. 247-255. http://dx.doi.org/10.1007/s100510050375 [8] T. Misaridis and J. A. Jens en, “Use of Modulated Excita- tion Signals in Medical Ultrasound. Part II: Design and Performance for Medical Imaging Applications,” IEEE Transactions of UFFC, Vol. 52, 2005, pp. 192-207. http://dx.doi.org/10.1109/TUFFC.2005.1406546 [9] D. Y. Kim, J. C. Lee, S. J. Kwon and T.K. Song, “Ultra- sound Second Harmonic Imaging with a Weighted Chirp Signal,” Proceedings of IEEE Ultrasound Symposium, 2001, pp. 1477-1480. [10] D. H. Simpson, C. T. Chin and P. N. Burns, “Pulse Inver- sion Doppler: A New Method for Detecting Nonlinear |