

Paper Menu >>
Journal Menu >>
 Engineering, 2013, 5, 114-117 http://dx.doi.org/10.4236/eng.2013.510B023 Published Online October 2013 (http://www.scirp.org/journal/eng) Copyright © 2013 SciRes. ENG A New Approach t o the Presentation of Myocardial SPECT Images —Radial Slices—Data Reduction without Loss of Information Niloufar Darv ish1, Fatma Nadide Öçba1, Hamed Hamid Muhammed1*, Dianna Bone2 1School of Technology and Health STH, Royal Institute of Technology KTH, Alfred Nobels Allé 10, SE-14152 Huddinge, Sweden 2Department of Clinical Physiology, Thoracic Clinics, Karolinska Hospital, SE-17671 Stockholm, Sweden Email: *[email protected] Received December 2012 ABSTRACT Objective: SPECT data from myocardial perfusion imaging (MPI) are normally displayed as a set of three slices or- thogonal to the left ventricular (LV) long axis. For data presentation, the images are orientated about the LV long axis. Therefore, radial slices provide a suitable alternative to standard orthogonal slices, with the advantage of requiring few- er slices to adequately represent the data.In this study, a semi-automatic method is developed for displaying MPI SPECT data as a set of radial slices orientated about the LV axis. The aim is to reduce the number of slices viewed without loss of information and independently from the heart size. Method: Standard short axis slices, orientated per- pendicular to the LV axis, are utilized. The skeleton of the segmented myocardium is found and the true LV axis is de- termined in each central long slice. The LV axis of the whole volume is determined by aligning the axes of all slices. Result: Radial slices centered about this axis were generated by integration over a sector equal to the resolution of the imaging system which was of the order of 1.2 cm. Therefore, assuming a mean LV diameter of 8 cm, 20 slices were sufficient to represent a non-gated study. Gated information could be adequately displayed with 4 slices integrated over an angle of 45˚. Conclusion: Keywords: Myocardial Perfusion SPECT; Cardiac Left Ventricle; Radial Slices; Left Ventricular Long Axis 1. Introduction Myocardial perfusion imaging (MPI) is a non-invasive nuclear medicine technique used to study blood flow in the left ventricular (LV) heart muscle. Images are ac- quired using a gamma camera system following the in- jection of a radiopharmaceutical during a cardiac stress test [1]. At a subsequent examination, an injection is given when the heart is in a resting state. Images from the stress and rest examinations are then compared to identify differences that may indicate ischemia, or other abnormalities [1]. The method of choice for acquiring the myocardial data is single photon emission tomography [2]. A semi-automatic method for generating radial slices from SPECT MPI short axis slices has been developed. SPECT performed without any reference to heart rhythm (MSPECT) provides the best quality images for determining perfusion. Additional useful information about LV function can be obtained with gated-SPECT (GSPECT) studies, when the patient’s ECG is used to control the acquisition [3]. In modern gamma camera systems MSPECT and GSPECT projections can be ac- quired simultaneously. Sets of slices orientated abou t the long axis of the LV are reconstructed from projection images. The standard slices presented for interpretation are horizontal long axis (HLA), ver tical long axis (VLA) and short axis (SA) (Figure 1). Depending on the size of the LV, more than 30 slices from each acquisition are needed to represent the heart muscle, thus a considerable number of images must be compared when making a diagnosis. To assist in this problem, the polar presentation (bull’s eye) has been de- veloped [4], but the display results in loss of information and cannot completely replace the standard sets of slices. An alternative approach would be to reconstruct radial slices. Radial slices are orientated p arallel to the LV long axis and arranged diametrically. The central HLA and VLA slices are examples of radial slices at 0˚ and 90˚ respectively. A set of radial slices would, therefore, include the central HLA and *Corresponding a uthor. 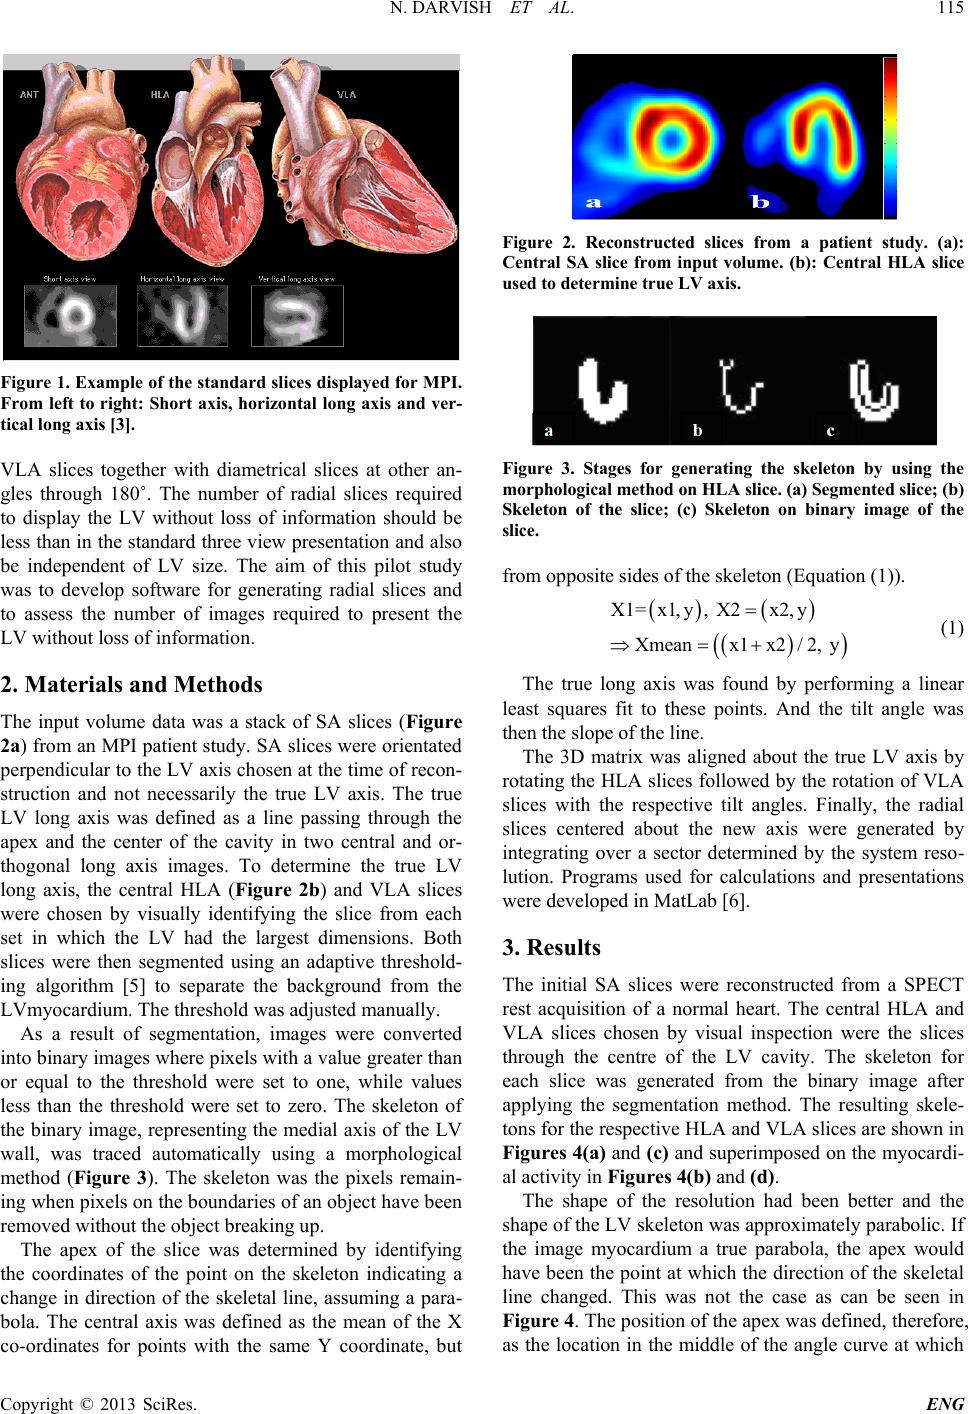 N. DARVISH ET AL. Copyright © 2013 SciRes. ENG 115 Figure 1. Example of the standard slices displayed for MPI. From left to right: Short axis, horizontal long axis and ver- tical long axis [3]. VLA slices together with diametrical slices at other an- gles through 180˚. The number of radial slices required to display the LV without loss of information should be less than in the standard three view presentation and also be independent of LV size. The aim of this pilot study was to develop software for generating radial slices and to assess the number of images required to present the LV without loss of information. 2. Materials and Methods The input volume data was a stack of SA slices (Figu re 2a) from an MPI patient study. SA slices were orientated perpendicular to the LV axis chosen at the time of recon- struction and not necessarily the true LV axis. The true LV long axis was defined as a line passing through the apex and the center of the cavity in two central and or- thogonal long axis images. To determine the true LV long axis, the central HLA (Figure 2b) and VLA slices were chosen by visually identifying the slice from each set in which the LV had the largest dimensions. Both slices were then segmented using an adaptive threshold- ing algorithm [5] to separate the background from the LVmyocardium. The threshold was adjusted manually. As a result of segmentation, images were converted into binary images where pixels with a value greater than or equal to the threshold were set to one, while values less than the threshold were set to zero. The skeleton of the binary image, representing the medial axis of the LV wall, was traced automatically using a morphological method (Figure 3). The skeleton was the pixels remain- ing when pixels on the boundaries of an object have been removed wi thout the object breakin g up . The apex of the slice was determined by identifying the coordinates of the point on the skeleton indicating a change in direction of the skeletal line, assuming a para- bola. The central axis was defined as the mean of the X co-ordinates for points with the same Y coordinate, but Figure 2. Reconstructed slices from a patient study. (a): Central SA slice from input volume. (b): Central HLA slice used to determin e t ru e L V axis. Figure 3. Stages for generating the skeleton by using the morphological method on HLA slice. (a) Segmented slice; (b) Skeleton of the slice; (c) Skeleton on binary image of the slice. from opposite si de s of the skeleton (Equation (1)). ( )() ( ) ( ) X1=x1,y, X2x2,y Xmeanx1x2/2, y = ⇒=+ (1) The true long axis was found by performing a linear least squares fit to these points. And the tilt angle was then the slope of the line. The 3D matrix was aligned about the true LV axis by rotating the HLA slices followed by the rotation of VLA slices with the respective tilt angles. Finally, the radial slices centered about the new axis were generated by integrating over a sector determined by the system reso- lution. Programs used for calculations and presentations were developed in MatLab [6]. 3. Results The initial SA slices were reconstructed from a SPECT rest acquisition of a normal heart. The central HLA and VLA slices chosen by visual inspection were the slices through the centre of the LV cavity. The skeleton for each slice was generated from the binary image after applying the segmentation method. The resulting skele- tons for the respective HLA and VLA slices are shown in Figures 4(a) and ( c) and superimpo sed on the myocardi- al activity in Figures 4(b) and (d). The shape of the resolution had been better and the shape of the LV skeleton was approximately parabolic. If the image myocardium a true parabola, the apex would have been the point at which the direction of the skeletal line changed. This was not the case as can be seen in Figure 4. The position of the apex was defined, therefore, as the location in the middle of the angle curve at which 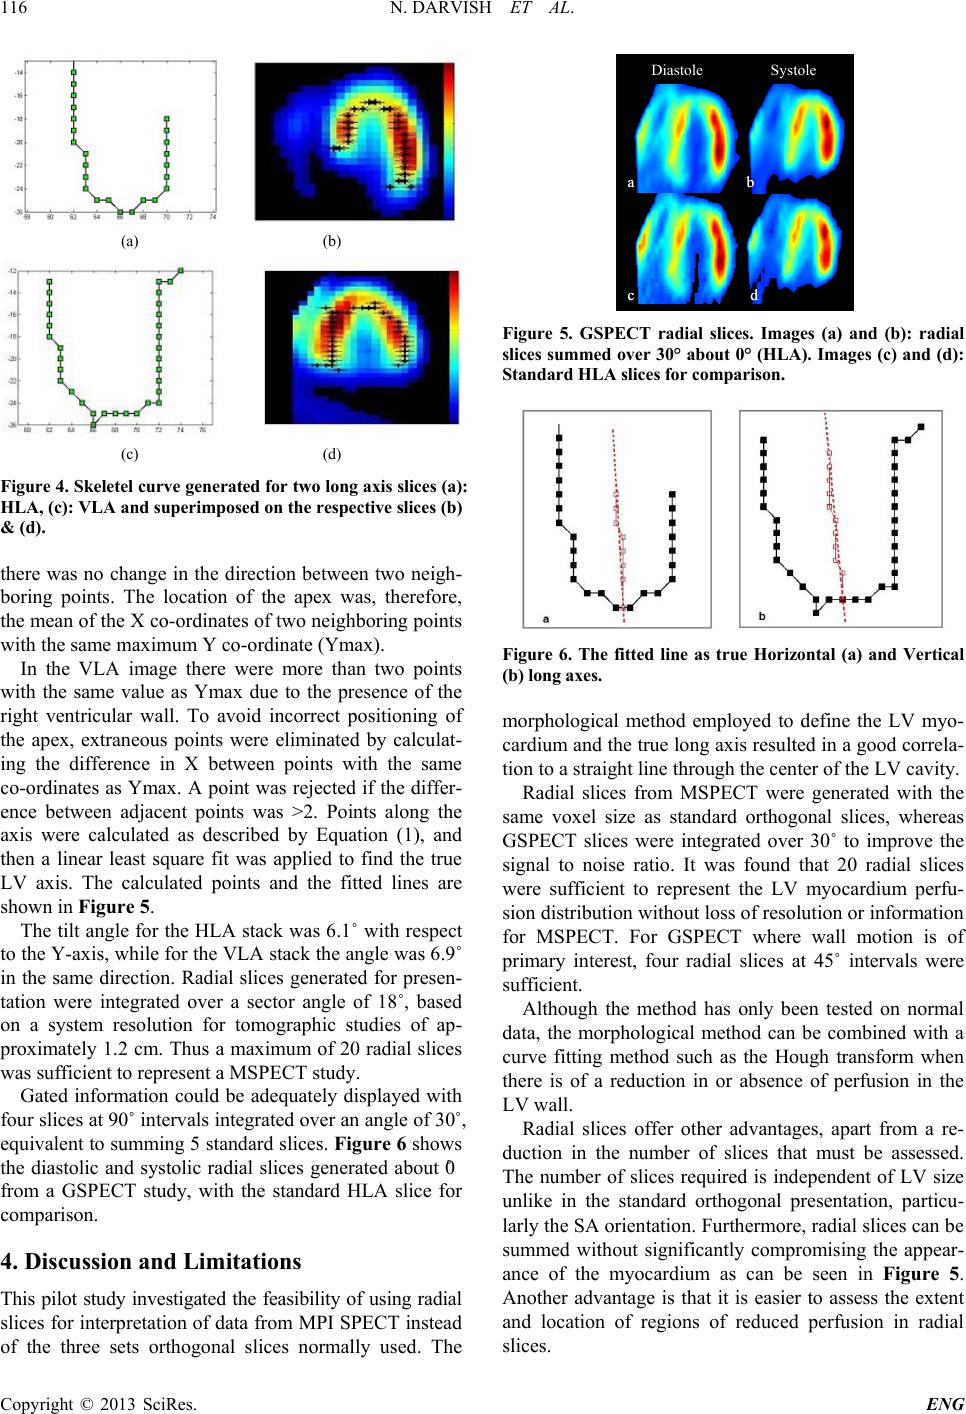 N. DARVISH ET AL. Copyright © 2013 SciRes. ENG 116 (a) (b) (c) (d) Figure 4. Skeletel curve generated for two long axis slices (a): HLA, (c): VLA and superimposed on the respective slices (b) & (d). there was no change in the direction between two neigh- boring points. The location of the apex was, therefore, the mean of the X co-ordinates of two neighboring points with t he same maximu m Y co-ordinate (Ymax) . In the VLA image there were more than two points with the same value as Ymax due to the presence of the right ventricular wall. To avoid incorrect positioning of the apex, extraneous points were eliminated by calculat- ing the difference in X between points with the same co-ordinates as Ymax. A point was rejected if the differ- ence between adjacent points was >2. Points along the axis were calculated as described by Equation (1), and then a linear least square fit was applied to find the true LV axis. The calculated points and the fitted lines are shown in Figure 5. The tilt angle for the HLA stack was 6.1˚ with respe ct to the Y-axis, while for the VLA stack the angle was 6.9˚ in the same direction. Radial slices generated for presen- tation were integrated over a sector angle of 18˚, based on a system resolution for tomographic studies of ap- proximately 1.2 cm. Thus a maximum of 20 radial slices was sufficient to represent a MSPECT study. Gated information could be adequately displayed with four slices at 90˚ intervals integrated over an angle of 30˚, equivalent to summing 5 standard slices. Fig ure 6 shows the diastolic and systolic radial slices generated about 0˚ from a GSPECT study, with the standard HLA slice for comparison. 4. Discussion and Limitations This pilot study investigated the feasibility of using radial slices for interpretation of data from MPI SPECT instead of the three sets orthogonal slices normally used. The Figure 5. GSPECT radial slices. Images (a) and (b): radial slices summe d over 30° about 0° (HLA). Images (c ) and (d): Standard HLA slices for comparison. Figure 6. The fitted line as true Horizontal (a) and Vertical (b) long axes. morphological method employed to define the LV myo- cardium and the true long ax is resulted in a good corre la- tion to a straight line through the center of the LV cavity. Radial slices from MSPECT were generated with the same voxel size as standard orthogonal slices, whereas GSPECT slices were integrated over 30˚ to improve the signal to noise ratio. It was found that 20 radial slices were sufficient to represent the LV myocardium perfu- sion distribution without loss of resolution or information for MSPECT. For GSPECT where wall motion is of primary interest, four radial slices at 45˚ intervals were sufficient. Although the method has only been tested on normal data, the morphological method can be combined with a curve fitting method such as the Hough transform when there is of a reduction in or absence of perfusion in the LV wall. Radial slices offer other advantages, apart from a re- duction in the number of slices that must be assessed. The number of slices required is independent of LV size unlike in the standard orthogonal presentation, particu- larly the SA orientation. Furthermore, radial slices can be summed without significantly compromising the appear- ance of the myocardium as can be seen in Figure 5. Another advantage is that it is easier to assess the extent and location of regions of reduced perfusion in radial slices. Diastole Systole ba dc Diastole Systole Diastole Systole ba dc ba dc 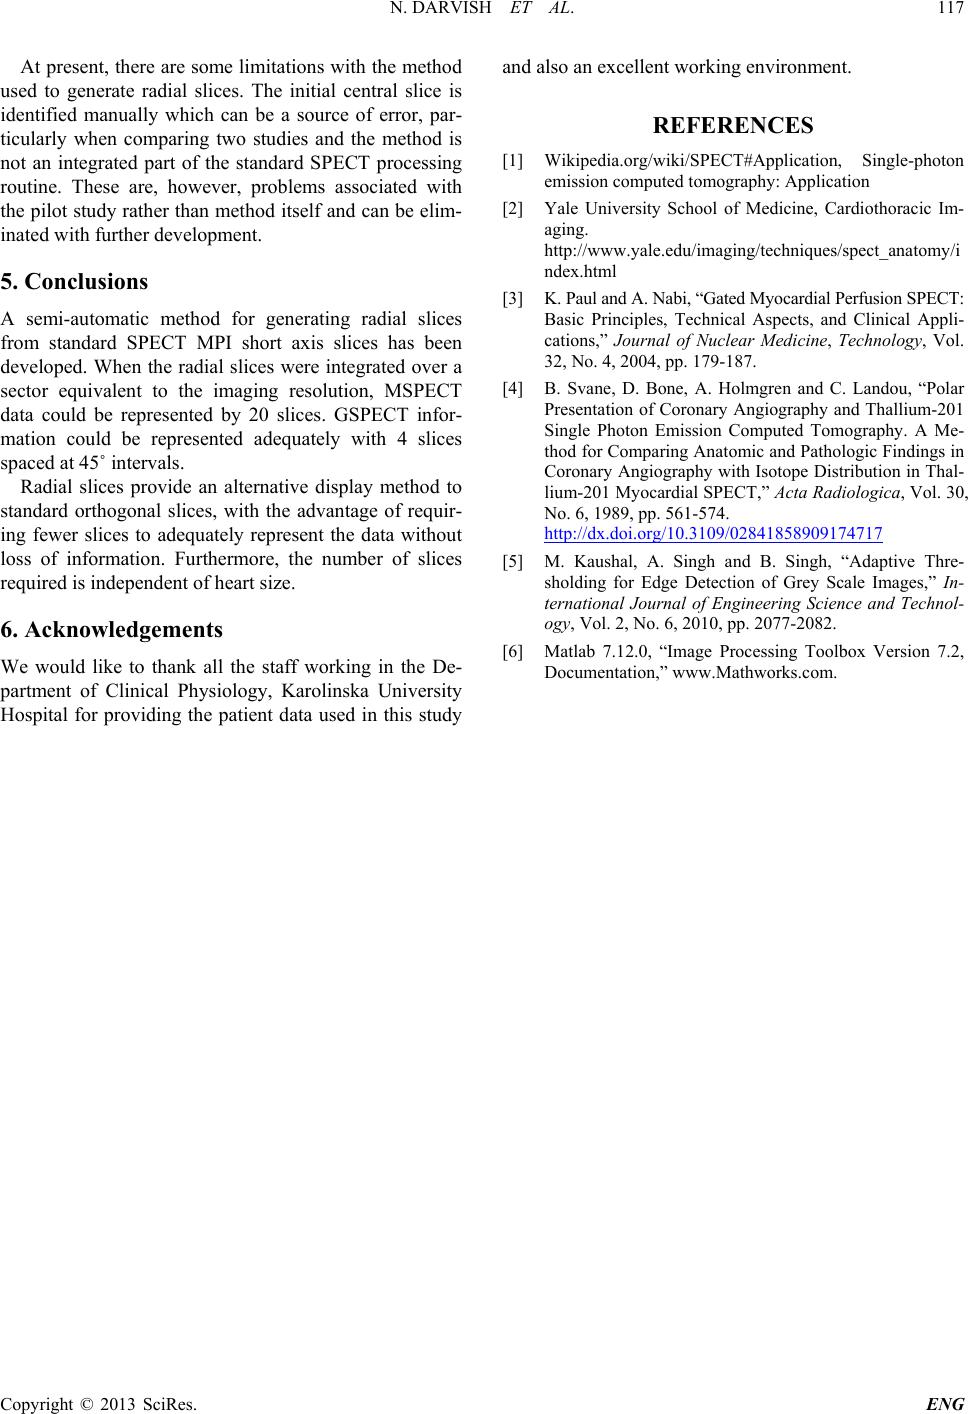 N. DARVISH ET AL. Copyright © 2013 SciRes. ENG 117 At present, there are some limitation s with the method used to generate radial slices. The initial central slice is identified manually which can be a source of error, par- ticularly when comparing two studies and the method is not an integrated part of the standard SPECT processing routine. These are, however, problems associated with the pilot study rather than method itself and can be elim- inated wi th furt he r development. 5. Conclusions A semi-automatic method for generating radial slices from standard SPECT MPI short axis slices has been developed. When the radial slices were integrated over a sector equivalent to the imaging resolution, MSPECT data could be represented by 20 slices. GSPECT infor- mation could be represented adequately with 4 slices spaced at 45˚ intervals. Radial slices provide an alternative display method to standard orthogonal slices, with the advantage of requir- ing fewer slices to adequately represent the data without loss of information. Furthermore, the number of slices required is independent of heart size. 6. Acknowledgements We would like to thank all the staff working in the De- partment of Clinical Physiology, Karolinska University Hospital for providing the patient data used in this study and also an excellent working environment. REFERENCES [1] Wikipedia.org/wiki/SPECT#Application, Single-photon emission computed tomography: Application [2] Yale University School of Medicine, Cardiothoracic Im- aging. http://www.yale.edu/imaging/techniques/spect_anatomy/i ndex.html [3] K. Paul and A. Nabi, “Gated Myocardial Perfusion SPECT: Basic Principles, Technical Aspects, and Clinical Appli- cations,” Journal of Nuclear Medicine, Technology, Vol. 32, No. 4, 2004, pp. 179-187. [4] B. Svane, D. Bone, A. Holmgren and C. Landou, “Polar Presentation of Coronary Angiography and Thallium-201 Single Photon Emission Computed Tomography. A Me- thod for Comparing Anatomic and Pathologic Findings in Coronary Angiography with Isotope Distribution in Thal- lium-201 Myocardial SPECT,” Act a Radiologica, Vol. 30, No. 6, 1989, pp. 561-574. http://dx.doi.org/10.3109/02841858909174717 [5] M. Kaushal, A. Singh and B. Singh, “Adaptive Thre- sholding for Edge Detection of Grey Scale Images,” In- ternational Journal of Engineering Science and Technol- ogy, Vol. 2, No. 6, 2010, pp. 2077-2082. [6] Matlab 7.12.0, “Image Processing Toolbox Version 7.2, Documentation,” www.Mathworks.com. |