

Paper Menu >>
Journal Menu >>
 Engineering, 2013, 5, 99-102 http://dx.doi.org/10.4236/eng.2013.510B020 Published Online October 2013 (http://www.scirp.org/journal/eng) Copyright © 2013 SciRes. ENG Using Variations of Somatosensory Evoked Potentials to Quantify Spinal Cord Injury Level Hasan Mir1, Hasan Al-Nashash1, Douglas Kerr2, Angelo All2, Nitish Thakor2 1Department of E lectrical Engineering, American University of Sharjah, Sharjah, UAE 2Department of Neurology, Department of Biomedical Engineering, Johns Hopkins University School of Medicine, Baltimore, USA Email: [email protected], [email protected], [email protected], [email protected], [email protected] Received December 2012 ABSTRACT Existing work indicates that the degree of variation of somatosensory evoked potential (SEP) signals between a healthy spinal pathway and spinal pathway affected by spinal cord injury (SCI) can be used to evaluate the integrity of the spin- al pathway. This paper develops a metric that exploits the time-do main features of SEP signals (relative amplitude, time scaling, and time duration) in order to quantify the level of SCI. The proposed method is tested on actual SEP signals collected from rodents afflicted with focal demyelination SCI. Results indicate that the proposed method provides a robust assessment of the different degrees of demyelination in the spinal cord. Keywords: Somatosensory Evoked Potential (SEP); Spinal Cord Injury (SC I); Signal Morphology 1. Introduction The spinal cord provides a transmission pathway for motor and sensory signals between the central and peri- pheral nervous systems [1]. Thus, any spinal cord injury (SCI) impairs signal transmission, resulting in sensory and/or motor function loss. Many patients around the world suffer from SCI. In the United States alone, it is estimated that there are more than 250,000 SCI patients [2]. Given the large number of SCI patients worldwide, there is a clear need to develop methods for evaluating the level of SCI. Such methods are important not only for evaluating the effectiveness of therapeutic mechanisms, but also in providing timely surg ica l in tervention. Indeed, immediate treatment of even a small number of spared fibers after incomplete SCI can greatly improve the pa- tient’s quality of life. SCI detection is commonly performed using electro- physiological [3,4] and imaging [5,6] techniques. Imag- ing based approaches such as MRI only reveal informa- tion concerning the injury location and the anatomical damage, but do not provide information about the func- tional integrity of the spinal cord. Amongst electrophysi- ological techniques used in SCI studies, the evoked po- tential provides an assessment of the electrophysiological response of the neural system to an external stimulus. In particular, somatosensory evoked potentials (SEP), which are cortical signals recorded in response to sensory stimulation, are obtained by electrical stimulation of the median nerve at the wrist or the posterior tibial nerve at the ankle [7]. This technique can be used to monitor the ongoing neurophysiological changes during the recovery period after SCI. In [8], it was shown that the similarity between a reference SEP signal taken from a healthy spinal pathway and an SEP signal from an injured trans- mission pathway is a strong indicator of the level of in- jury. Thus, it provides a complement to qualitative, be- haviorial based assessments such as the Basso, Beattie, and Bresnahan (BBB) test [9]. Previous work [10-12] has been done to develop me- trics for quantifying the level of SCI by comparing the variation between SEP signals. While such methods show promise, they do not explicitly account for the temporal relationships that exist between the SEP signals under comparison. In this paper, parameters relating the time -domain variation between SEP signals collected on rodents are used to evaluate the level of SCI. These pa- rameters reflect differences in amplitude, duration, and delay between the SEP signals, and can combined into a single index to quantify the level of SCI. The rest of this paper is organized as follows: Section 2 describes the protocol for collecting the SEP signals from rodents. Section 3 describes metrics for quantifying the level of SCI. Section 4 presents the results of apply- ing the methods in Section 3 to the data descr ib ed in S ec- tion 2. 2. Protocol and Data Collection In accordance with the Rodent Survival Surgery Manual, and with approval from the Institutional Animal Care and  H. MIR ET AL. Copyright © 2013 SciRes. ENG 100 Use Committee at the Johns Hopk ins Un iversity, the SE P data used in this paper was obtained by inducing focal demyelination lesion in dorsal pathways of rodents’s spinal cord. Recombinant myelin oligodendrocyte glyco- protein (MOG) corresponding to the N-terminal se- quence of rodent MOG amino acids 1 to 125 (MOG1- 125) was emulsified in incomplete Freund’s adjuvant (S igma-Aldrich) as 1:1 mixture (Imject IFA; Pierce). 100 μl = 50 μg of this emulsified MOG1-125 (co urtesy o f Dr. Sha Mi, Biogen-Idec, Cambridge, MA) was injected sub- cutaneously near the base of the tail of each rodent at 2 contralateral sites (50 μl per area to minimize irritation to the skin). The rodents were subjected to T9 laminectomy and either (2 × 2 μl) cytokines (250 ng of TNF-α, 150U of INF-γ and 40 ng of IL-6) or (1 µg) ethidium bromide or a combination of the two was injected into dorsal white matter using Hamilton needle (31 G). This causes inflammatory demyelinating lesions, similar to the active demyelinating plaques that characterize multiple sclero- sis (MS). Every seven days thereafter, SEP recordings were performed. The signal-to-noise ratio of the SEP signals was improved via averaging. 3. Quantification Metrics Consider two signals: a reference signal )( 1 ts and a test signal )( 2 ts , both defined over some time interval 21 ttt ≤≤ , as shown in F igure 1. It may be observed that compared to the reference signal )( 1 ts , the test signal )( 2ts exhibits the following characteristics: 1) The amplitude scale has changed; 2) The time scale has changed; 3) The relative time positions have shifted. Various methods have been proposed in the literature to quantify the variation between two signals. Amongst the simplest methods, the Euclidean ( 2 l ) distance pro- vides a simple measure of signal v ariation. However, it is not appropriate for cases when the two signals are not temporally aligned, as in Figure 1. A more sophisticated measure is provided by the Pearson correlation coeffi- cient (PCC), defined as: ( )( ) ( ) ( )( ) ( )( ) 212 1 12 22 22 12 11 d ,= dd t t tt tt s tstt stst sttstt ρ ∫ ∫∫ (1) The PCC is a measure of linear dependence, and is commonly used as a metric to quantify the similarity between two signals. A key weakness of the PCC, how- ever, is its insensitivity to amplitud e differences. In this paper, a more robust means to characterize the variation between two signals is proposed. Towards this end, consider again the effects shown in Figure 1. Let the transformation parameters ),,( τβα denote the change in the amplitude scale, time scale, and relative Figure 1. An illustration of signal variations between a re- ference and test signal. time position, respectively. As such, an approximation )( ˆ 1 ts of the reference signal )( 1 ts may be generated by transforming the test signal )( 2 ts in the following manner: ( ) − β τ α t sts 21 = ˆ (2) In order to determine the degree to which trans- formation parameters approximate the reference signal )( 1 ts , define the error signal ( )( ) tstste 11 ˆ =)( − (3) The energy of the error signal will be used to define the cost function 22 1 =( )d t t J ett ∫ (4) A suitable solution for the value of the transformation parameters ),,( τβα as such may be found through solving the optimization pr oblem ( ) dt t stsJ t t 2 21 2 1 ,,,, argmin = argmin − − ∫ β τ α τβατβα (5) The solution to (5) can be found using standard optimization algorithms such as the Nelder-Mead method [13]. To quantify the degree of SCI, a measure is proposed that combines the deviation of the transformation para- meters from their ideal values. In the ideal case of no signal warping, the amplitude and time scale parameters α and β have a value of one, while the time shift parameter τ has a value of zero. As such, a suitable metric to quantify the overall degree of signal variation (and hence the level of SCI) is: ( )( )() τβαλ +−+− 11=, 21 tsts (6) 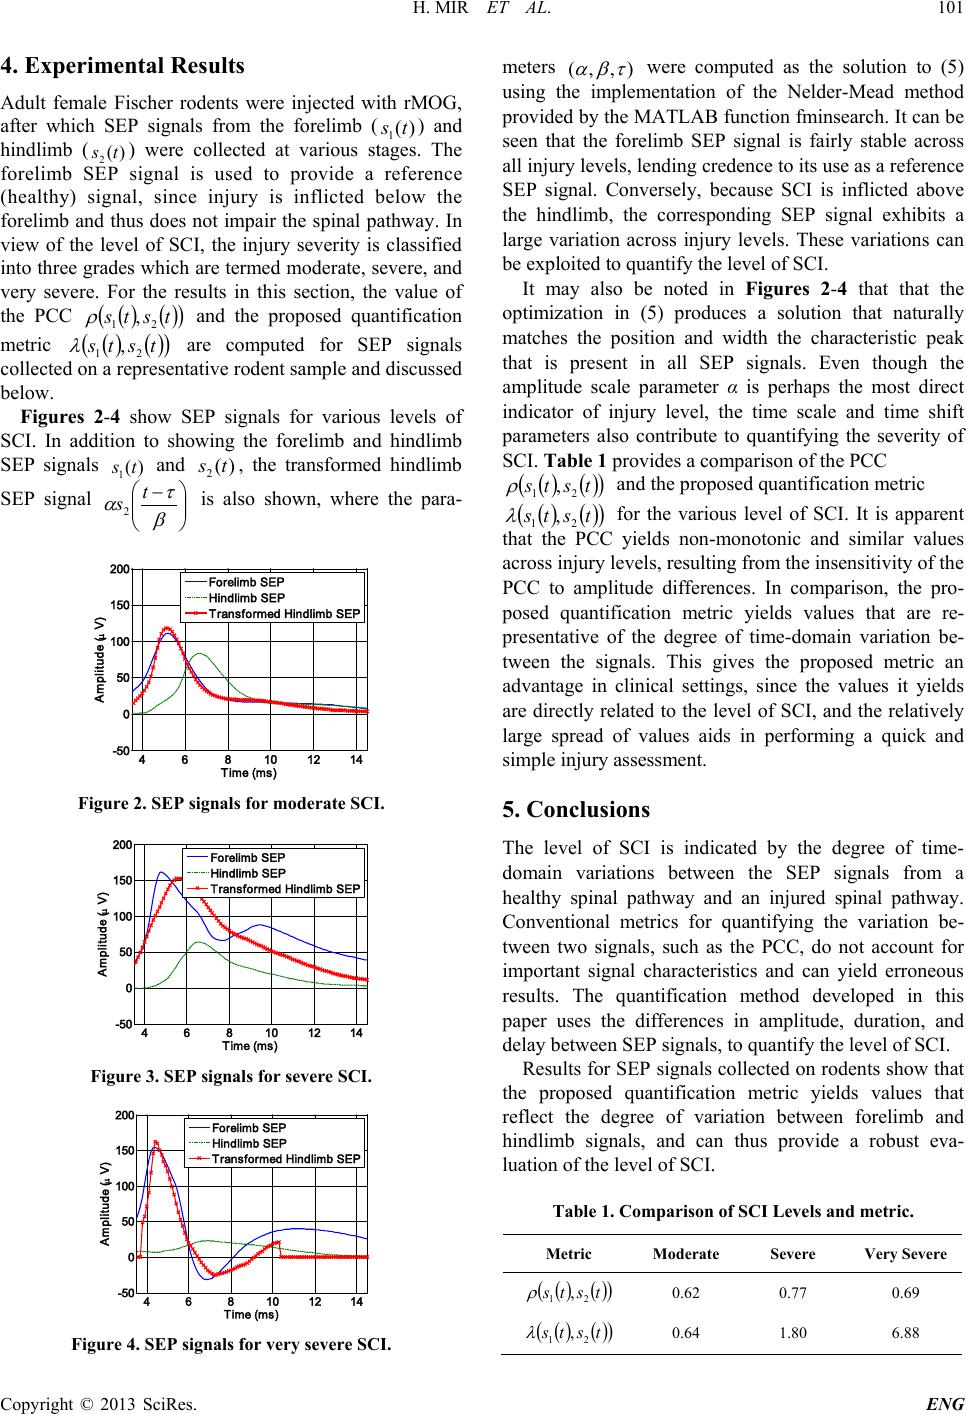 H. MIR ET AL. Copyright © 2013 SciRes. ENG 101 4. Experimental Results Adult female Fischer rodents were injected with rMOG, after which SEP signals from the forelimb ( )( 1 ts ) and hindlimb ( )( 2 ts ) were collected at various stages. The forelimb SEP signal is used to provide a reference (healthy) signal, since injury is inflicted below the forelimb and thus does not impair the spinal pathway. In view of the level of SCI, the injury severity is classified into three grades which are termed moderate, severe, and very severe. For the results in this section, the value of the PCC ( )()() tsts 21 , ρ and the proposed quantification metric ( )()() tsts 21 , λ are computed for SEP signals collected on a representative rodent sample and discussed below. Figures 2-4 show SEP signals for various levels of SCI. In addition to showing the forelimb and hindlimb SEP signals )( 1 ts and )( 2 ts , the transformed hindlimb SEP signal − β τ α t s2 is also shown, where the para- Figure 2. SEP signals for moderate SCI. Figure 3. SEP signals for severe SCI. Figure 4. SEP signals for very severe SCI. meters ),,( τβα were computed as the solution to (5) using the implementation of the Nelder-Mead method provided by the MATLAB function f minsearch. It can be seen that the forelimb SEP signal is fairly stable across all injury levels, lending credence to its use as a reference SEP signal. Conversely, because SCI is inflicted above the hindlimb, the corresponding SEP signal exhibits a large variation across injury levels. These variations can be exploited to quantify the level of SCI. It may also be noted in Figures 2-4 that that the optimization in (5) produces a solution that naturally matches the position and width the characteristic peak that is present in all SEP signals. Even though the amplitude scale parameter α is perhaps the most direct indicator of injury level, the time scale and time shift parameters also contribute to quantifying the severity of SCI. Table 1 provides a comparison of the PCC ( )()() tsts 21 , ρ and the proposed quantification metric ( )()() tsts 21 , λ for the various level of SCI. It is apparent that the PCC yields non-monotonic and similar values across injury levels, r esu lting from the insens itiv ity of the PCC to amplitude differences. In comparison, the pro- posed quantification metric yields values that are re- presentative of the degree of time-domain variation be- tween the signals. This gives the proposed metric an advantage in clinical settings, since the values it yields are directly related to the level of SCI, and the relatively large spread of values aids in performing a quick and simple injury assessment. 5. Conclusions The level of SCI is indicated by the degree of time- domain variations between the SEP signals from a healthy spinal pathway and an injured spinal pathway. Conventional metrics for quantifying the variation be- tween two signals, such as the PCC, do not account for important signal characteristics and can yield erroneous results. The quantification method developed in this paper uses the differences in amplitude, duration, and delay between SEP signals, to quantify the level of SCI. Results for SEP signals collected on rodents show that the proposed quantification metric yields values that reflect the degree of variation between forelimb and hindlimb signals, and can thus provide a robust eva- luation of the level of SCI. Table 1. Comparison of SCI Levels and metric. Metric Moderate Severe Very Severe ( )( )() tsts 21 , ρ 0.62 0.77 0.69 ( )( )() tsts 21 , λ 0.64 1.80 6.88 46810 12 14 -50 0 50 100 150 200 Time (ms) Amplitude ( µ V) Forelimb SEP Hindlimb SEP Transformed Hindli m b SEP 468 10 12 14 -50 0 50 100 150 200 Time (ms) Amplitude ( µ V) Forelimb SEP Hindlimb SEP Transformed Hindlim b SEP 468 10 12 14 -50 0 50 100 150 200 Time (ms) Amplitude ( µ V) Forelimb SEP Hindlimb SEP Transformed Hindlim b SEP  H. MIR ET AL. Copyright © 2013 SciRes. ENG 102 6. Acknowledgements This work was supported b y the Maryland Ste m Cell Re- search Fund 2007-MSCRFII-0159-00 . REFERENCES [1] E. Niedermeyer, “Electroencephalography, Basic Principles, Clinical Applications, and Related Fields,” 4th Edition, Lippincott, Williams and Wilkins, Phil, 1999. [2] R. Spears and A. Holtz, “Spinal Cord Injury,” Oxford University Press, Oxford. [3] W. Truccolo, “Trial-to-Trial Variabil ity of Cortical Evok- ed Responses: Implications for the Analysis of Functional Connectivity,” Clinical Neurophysiology, Vol. 113, 2002, pp. 206-226. http://dx.doi.org/10.1016/S1388-2457(01)00739-8 [4] M. Nuwer, “Spinal c ord monitoring,” Muscle Nerve, Vol. 22, 1999, pp. 1620-1630. http://dx.doi.org/10.1002/(SICI)1097-4598(199912)22:12 <1620::AID-MUS2>3.0.CO;2-1 [5] M. Shepherd and M. Bracken, “Magnetic Resonance Imaging and Neurological Recovery in Acute Spinal Cord Injury: Observations from the National Acute Spinal Cord Injury Study 3,” Spinal Cord, Vol. 37, 1999, pp. 833-837. http://dx.doi.org/10.1038/sj.sc.3100927 [6] O. A. Glenn and J. Barkovich, “Magnetic Resonance Ima- ging of the Fetal Brain and Spine: An Increasingly Im- portant Tool in Prenatal Diagnosis: Part 2,” American Journal of Neuroradiology, Vol. 27, 2006, pp. 1807- 1814. [7] M. Nuwer, “Fundamentals of Evoked Potentials and Common Clinical Applications Today,” Electroencepha- lography and Clinical Neurophysiology, Vol. 106, 1998, pp. 142-148. http://dx.doi.org/10.1016/S0013-4694(97)00117-X [8] H. Al-Nashash, et al., “Spinal Cord Injury Detection and Monitoring Using Spectral Coherence,” IEEE Transac- tions on Biomedical Engineering, Vol. 56, No. 8, 2009, pp. 1971-1979. http://dx.doi.org/10.1109/TBME.2009.2018296 [9] D. Basso, M. Beattie and J. Bresnahan, “A Sensitive and Reliable Locomotor Rating Scale for Open Field Testing in Rats,” Journal of Neurotrauma, Vol. 12, 1995, pp. 1- 21. http://dx.doi.org/10.1089/neu.1995.12.1 [10] H. Mir, H. Al-Nashash, D. Kerr, N. Thakor and A. All, “Spinal Cord Injury Evaluation Using Morphological Difference of Somatosensory Evoked Potentials,” Pro- ceedings of the 2011 International Conference on Bioin- formatics and Biomedical Engineering, 2011, pp. 1-4. [11] H. Mir, H. Al-Nashash, D. Kerr, N. Thakor and A. All, “Histogram Based Quantification of Spinal Cord Injury Level Using Somatosensory Evoked Potentials,” Pro- ceedings of 2010 International Conference of the IEEE Engineering in Medicine and Biology Society, 2010, pp. 4942-4945. [12] H. Mir, H. Al-Nasha sh, A. All and N. Thakor, “Quantifi- cation of Spinal Cord Injury Level Using Somatosensory Evoked Potentials,” Proceedings of the 2010 Internation- al Conference on Bioinformatics and Biomedical Engi- neering, 2010, pp. 1-5. http://dx.doi.org/10.1109/ICBBE.2010.5515579 [13] M. Powell, “On Search Directions for Minimization Al- gorithms,” Mathematical Programming, Vol . 4, 1973, pp. 4193-4201. http://dx.doi.org/10.1007/BF01584660 |