

Paper Menu >>
Journal Menu >>
 Engineering, 2013, 5, 90-93 http://dx.doi.org/10.4236/eng.2013.510B018 Published Online October 2013 (http://www.scirp.org/journal/eng) Copyright © 2013 SciRes. ENG Regulation of E lectroacupu ncture on Gastric Myoelectrial Activities: Monitered by Ele ctrogastrogram s Peng Cheng1,2 1Research Center of Biomedical Engineering, Graduate School at Shenzhen, Tsinghua University, Shenzhen, China 2Shenzhen Key Laboratory for Minimal Invasive Medical Technologies, Shenzhen, China Email: [email protected] Received December 2012 ABSTRACT It is reported that acupuncture on some acupoints can enhance the regularity of gastric myoelectrical activities, which can be observed from the electrogastrograms (EEGs). In this paper, the electroacupuncture (EA) treatments were per- formed on subjects with slight gastric disorders and the EEGs were monitored in the mean while. The EEGs features of baseline, during and after EA treatments were analyzed. The results show that the EA treatments do enhance the regu- larity of EEGs. And a highly possible pattern for EA to attain the enhancement is to regulate the pacemaker quantity and propagation of slow waves rather than regulating the amplitude of slow waves. Keywords: Acupuncture; Electroacupuncture; Gastric Disorder; Electrogastrog rams; Gastric Myoelectrial Activity 1. Introduction Being practiced in China for tens of centuries, acupunc- ture now is accepted to treat some kinds of diseases in both East and West. Especially, in recent decades, acu- puncture is becoming a popular non-medication therapy for the patients with functional gastrointestinal disorders (FGIDs), which has the prevalence as high as 40% - 70% in general population. The electroacupuncture (EA) and cutaneous electrical stimulation on acupoint are applied and reported as effective as the traditional manual acu- puncture in the recent decades [1-3]. The acupoints Zu- sanli (Stomach-36, ST36, at the lower limb) and Neiguan (Pericardium-6, PC-6, at the wrist) are the most com- monly used points in treating FGIDs. Ouyang [4] and Takahashi [5] reviewed the research on applications and mechanisms of acupuncture for the treatment of FGIDs respectively. The efficiency of acupuncture on FGIDs is certified, but its mechanism still remains unc lear . As a noninvasive measurement of gastric function, electrogastrograms (EGGs) gain much attention in diag- nose and treatment of gastric disorders in recent decades. EGGs are measurements of the gastric myoelectrical ac- tivities, which are composed of rhythmic slow waves and spikes. EEGs usually refer to the surface measurements by placing electrodes on the abdominal skin. As recor ded cutaneously, the EGGs present a weighted summation of the electrical activities of var ious regions of the stomach. Studies have shown that the cutaneous electrodes can only pick up the rhythm of the slow waves but not that of the spikes. The normal frequency of slow waves in hu- man is about 3 cycles per minute (3 cpm or 0.05 Hz). The slow waves of 2.4 - 3.7 cpm are defined as normal slow waves, and less than 2.4 cpm as bradygastria, more than 3.7 as tachygastria [6-8]. It is reported that acupuncture on some acupoints can enhance the regularity of gastric myoelectrical activities [1,3-5]. It can be observed from the EEGs. The percen- tage of normal slow waves is increased significantly during acupuncture and after acup uncture is increased slightly or similar to the baseline . In order to obtain more information from EEGs, some new methods and parameters were proposed [9-11]. In this paper, EEGs were monitored before, during and after acupuncture treatments on subjects with gastric disorder s. The features of EEGs were studied and compared. The efficiency of acupuncture on regulating gastric myoelec- trical activities were certified once more, and a possible pattern of the regulation can be derived. 2. Materials and Methods 2.1. Subjects Eleven volunteer subjects with slight gastric disorder or discomfort participated in this study, including 2 males and 9 females, aged from 23 to 61 (average 37.5). All subjects were fasted for more than 10 hours before the study. 2.2. EEG Measurement To obtain the EEG data, five Ag/AgCl electrodes were 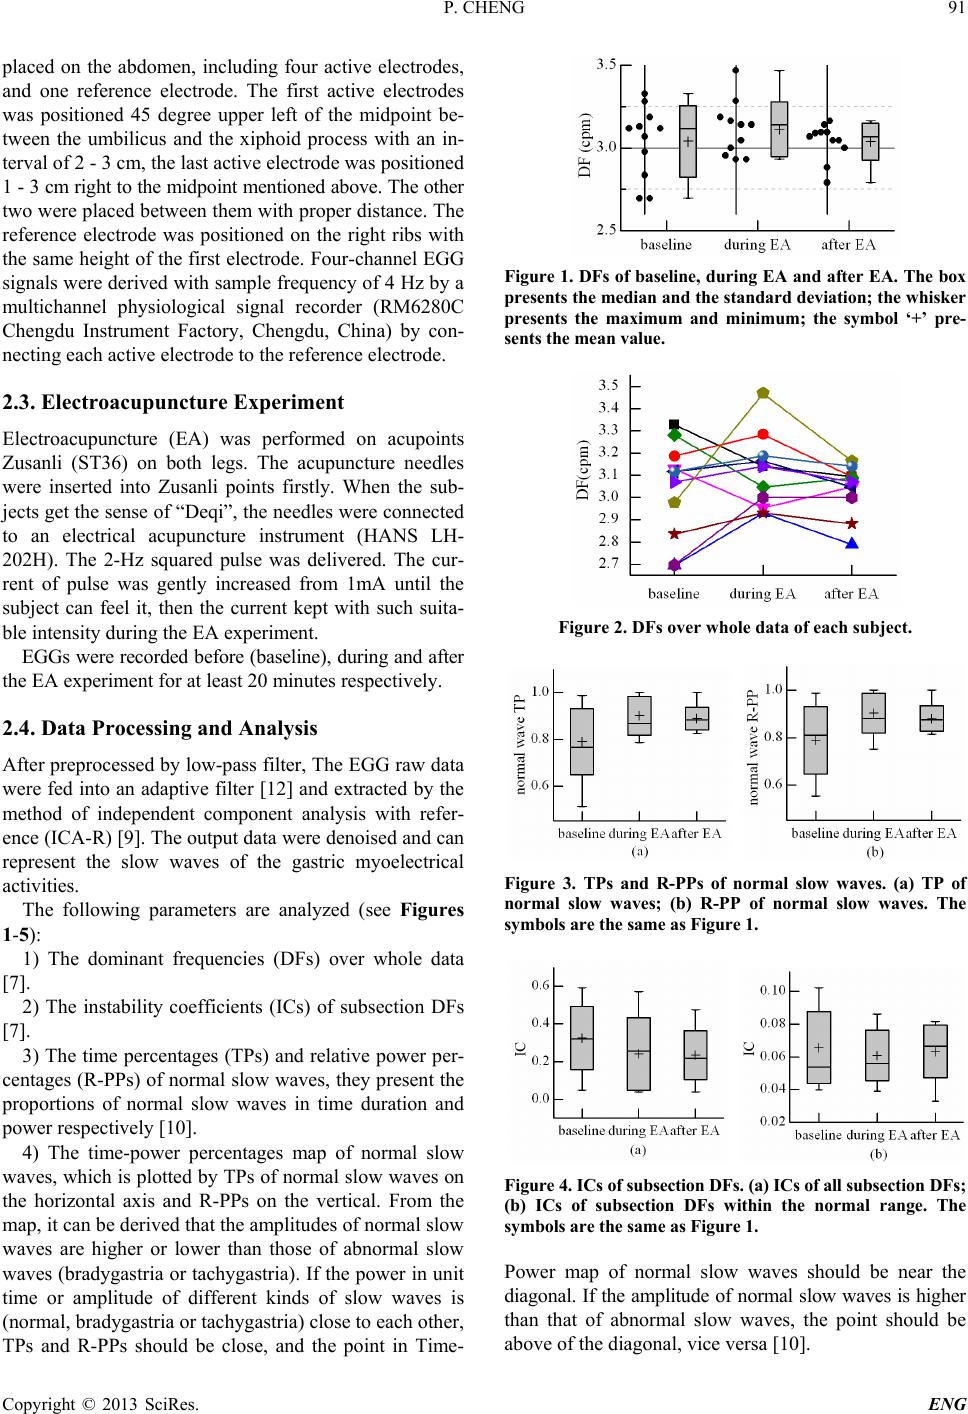 P. CHENG Copyright © 2013 SciRes. ENG 91 placed on the abdomen, including four active electrodes, and one reference electrode. The first active electrodes was positioned 45 degree upper left of the midpoint be- tween the umbilicus and the xiphoid process with an in- terval of 2 - 3 cm, the last active electrode was positioned 1 - 3 cm right to the midpoint mentioned above. The other two were placed between them with proper distance. The reference electrode was positioned on the right ribs with the same height of the first electrode. Four-channel EGG signals were derived with sample frequency of 4 Hz by a multichannel physiological signal recorder (RM6280C Chengdu Instrument Factory, Chengdu, China) by con- necting each active electrode to the reference electrode. 2.3. Electroacupuncture Experim en t Electroacupuncture (EA) was performed on acupoints Zusanli (ST36) on both legs. The acupuncture needles were inserted into Zusanli points firstly. When the sub- jects get the sense of “Deqi”, the needles were connected to an electrical acupuncture instrument (HANS LH- 202H). The 2-Hz squared pulse was delivered. The cur- rent of pulse was gently increased from 1mA until the subject can feel it, then the current kept with such suita- ble intensity during the EA experiment. EGGs were recorded before (baseline), during and after the EA experiment for at least 20 minutes respectively. 2.4. Data Processing and Analysis After preprocessed by low-pass filter, The EGG raw data were fed into an adaptive filter [12] and extracted by the method of independent component analysis with refer- ence (ICA-R) [9]. The output data were denoised and can represent the slow waves of the gastric myoelectrical activities. The following parameters are analyzed (see Figures 1-5): 1) The dominant frequencies (DFs) over whole data [7]. 2) The instability coefficients (ICs) of subsection DFs [7]. 3) The time percentages (TPs) and relative power per- centages (R-PPs) of normal slow waves, they pr esent the proportions of normal slow waves in time duration and power respectively [10]. 4) The time-p ower percentages map of normal slow waves, which is plotted by TPs of normal slow wav es on the horizontal axis and R-PPs on the vertical. From the map, it can be derived that the amplitudes of normal slow waves are higher or lower than those of abnormal slow waves (bradygastria or tachygastria). If the power in unit time or amplitude of different kinds of slow waves is (normal, bradygastria or tachygastria) close to each other, TPs and R-PPs should be close, and the point in Time- Figure 1. DFs of baseline, duri ng EA and after EA. The box presents the median and the standard deviation; the whisker presents the maximum and minimum; the symbol ‘+’ pre- sents the mean value. Figure 2. DFs over whole data of each subject. Figure 3. TPs and R-PPs of normal slow waves. (a) TP of normal slow waves; (b) R-PP of normal slow waves. The symbols are the same as Figure 1. Figure 4. ICs of subsection DFs. (a) ICs of all subsec tio n DF s; (b) ICs of subsection DFs within the normal range. The symbols are the same as Figure 1 . Power map of normal slow waves should be near the diagonal. If the amplitude of normal slow waves is higher than that of abnormal slow waves, the point should be above of the diagona l, vice versa [10]. 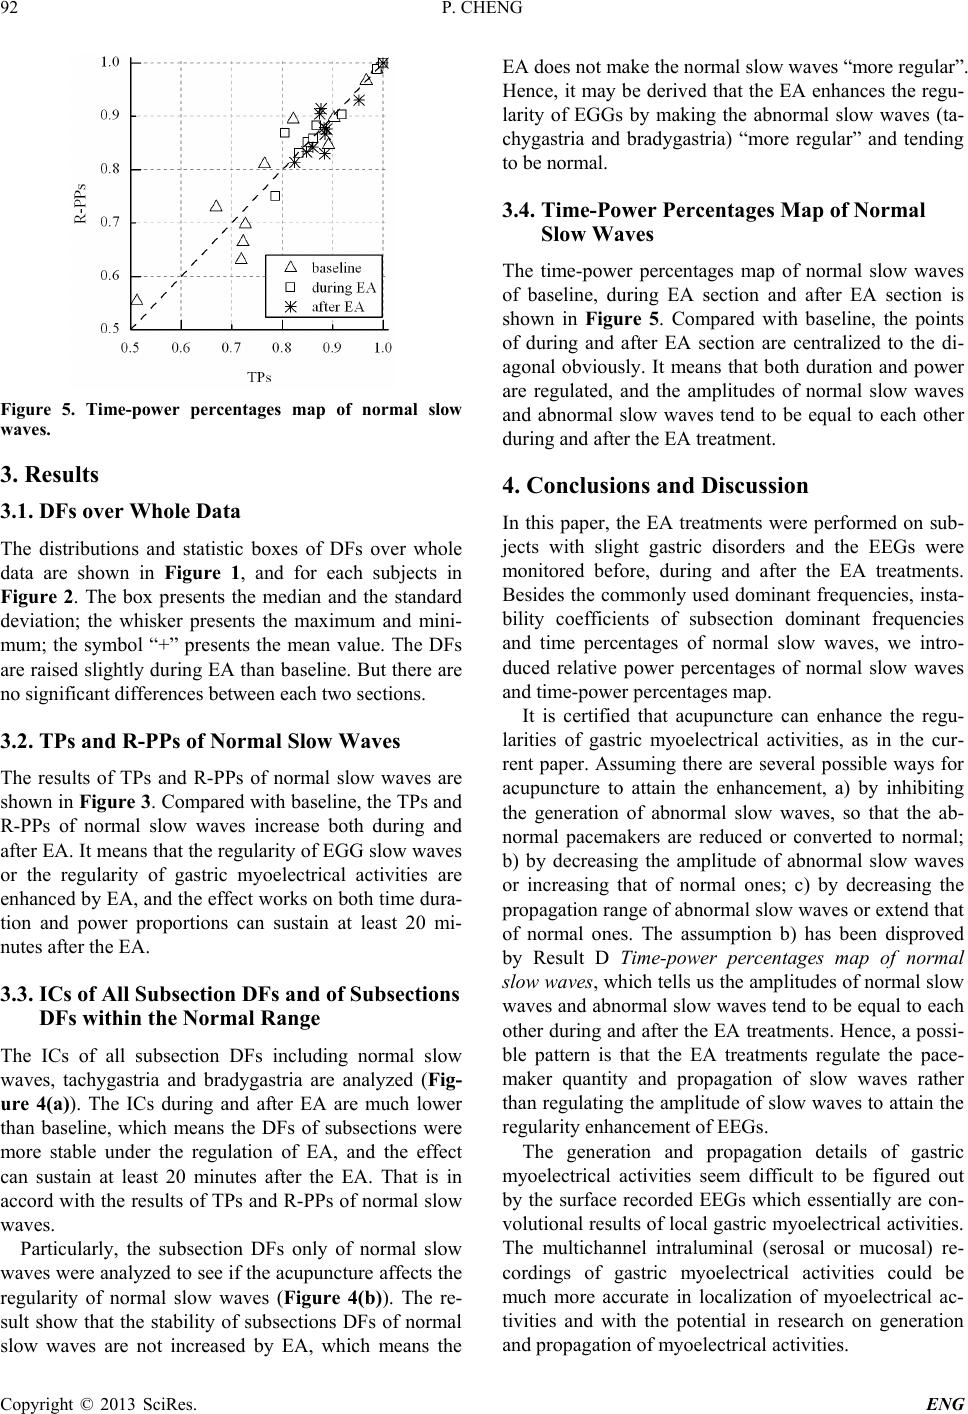 P. CHENG Copyright © 2013 SciRes. ENG 92 Figure 5. Time-power percentages map of normal slow waves. 3. Results 3.1. DFs over Whole Data The distributions and statistic boxes of DFs over whole data are shown in Figure 1, and for each subjects in Figure 2. The box presents the median and the standard deviation; the whisker presents the maximu m and mini- mum ; the symbol “+” presents the mean value. The DFs are raised slightly during EA than b aseline. But the re are no significant differences between each two sections. 3.2. TPs and R-PPs of Normal Slow Waves The results of TPs and R-PPs of normal slow waves are shown in Figure 3. Compared with baseline, the TPs and R-PPs of normal slow waves increase both during and after EA. It means that the regularity of EGG slow waves or the regularity of gastric myoelectrical activities are enhanced by EA, and the effect works on both time dur a- tion and power proportions can sustain at least 20 mi- nutes after the EA. 3.3. ICs of All Subsection DFs and of Subsections DFs within the Normal Range The ICs of all subsection DFs including normal slow waves, tachygastria and bradygastria are analyzed (Fig- ure 4(a)). The ICs during and after EA are much lower than baseline, which means the DFs of subsections were more stable under the regulation of EA, and the effect can sustain at least 20 minutes after the EA. That is in accord with the results of TPs and R-PPs of normal slow waves. Particularly, the subsection DFs only of normal slow waves were analyzed to see if the acupuncture affects the regularity of normal slow waves (Figure 4( b)). The re- sult show that the stability of subsections DFs of normal slow waves are not increased by EA, which means the EA does not make the normal slow waves “more regular”. Hence, it may be derived that the EA enhances the regu- larity of EGGs by making the abnormal slow waves (ta- chygastria and bradygastria) “more regular” and tending to be normal. 3.4. Time-Power Percenta ges Map of Normal Slow Waves The time-power percentages map of normal slow waves of baseline, during EA section and after EA section is shown in Figure 5. Compared with baseline, the points of during and after EA section are centralized to the di- agonal obviously. It means that both duration and power are regulated, and the amplitudes of normal slow waves and abnormal slow waves tend to be equal to each other during and after the EA treatment. 4. Conclusions and Discussion In this paper, the EA treatments were performed on sub- jects with slight gastric disorders and the EEGs were monitored before, during and after the EA treatments. Besides the commonly used dominant frequencies, insta- bility coefficients of subsection dominant frequencies and time percentages of normal slow waves, we intro- duced relative power percentages of normal slow waves and time-power percentages map. It is certified that acupuncture can enhance the regu- larities of gastric myoelectrical activities, as in the cur- rent paper. Assuming there are several possible ways for acupuncture to attain the enhancement, a) by inhibiting the generation of abnormal slow waves, so that the ab- normal pacemakers are reduced or converted to normal; b) by decreasing the amplitude of abnormal slow waves or increasing that of normal ones; c) by decreasing the propagation range of abnormal slow waves or extend that of normal ones. The assumption b) has been disproved by Result D Time-power percentages map of normal slow waves, which tells us the amplitudes of normal slow waves and abnormal slow waves tend to be equal to each other during and after the EA treatments. Hence, a possi- ble pattern is that the EA treatments regulate the pace- maker quantity and propagation of slow waves rather than regulating the amplitude of slow waves to attain the regularity enhancement of EEGs. The generation and propagation details of gastric myoelectrical activities seem difficult to be figured out by the surface recorded EEGs which essentially are con- volutional results of loca l gastric myoelectrical activities. The multichannel intraluminal (serosal or mucosal) re- cordings of gastric myoelectrical activities could be much more accurate in localization of myoelectrical ac- tivities and with the potential in research on generation and propagation of myoelectrical activities.  P. CHENG Copyright © 2013 SciRes. ENG 93 REFERENCES [1] C.-S. Chang, J.-W. Chou, C.-W. Ko, C.-Y. Wu and G.-H. Chen, “Cutaneous Electrical Stimulation of Acupuncture Points May Enhance Gastric Myoelectrical Regularity,” Digestion, Vol. 66, 2002, pp. 106-111. http://dx.doi.org/10.1159/000065596 [2] C.-S. Chang, C.-W. Ko, C.-Y. Wu and G.-H. Chen, “Ef- fect of Electrical Stimulation on Acupuncture Points in Diabetic Patients with Gastric Dysrhythmia: A Pilot Study,” Digestion, Vol. 64, 2001, pp. 184-190. http://dx.doi.org/10.1159/000048860 [3] X. M. Lin, J. Liang, J. Y. Ren, F. Mu, M. Zhang and J. D. Z. Chen, “Electrical Stimulation of Acupuncture Points Enhances Gastric Myoelectrical Activity in Humans,” The American Journal of Gastroenterology, Vol. 92, No. 9, 1997, pp. 1527-1530. [4] H. Ouyang and J. D. Z. Chen, “Therapeutic Roles of Acu- puncture in Functional Gastrointestinal Disorders,” Ali- mentary Pharmacology & Therapeutics, Vol. 2, No. 8, 2004, pp. 831-841. http://dx.doi.org/10.1111/j.1365-2036.2004.02196.x [5] T. Takahashi, “Acupuncture for Functional Gastrointes- tinal Disorders,” Journal of Gastroenterology, Vol. 41, 2006, pp. 408-417. http://dx.doi.org/10.1007/s00535-006-1773-6 [6] J. Chen and R. W. McCallum, “Clinical Applications of Electrogastrography,” The American Journal of Gastro- enterology, Vol. 88, No. 9, 1993, pp. 1324-1336. [7] J. Chen and R. W. McCallum, “Electrogastrography: Principles and Applications,” Raven Press, New York, 1994. [8] J. Chen and R. W. McCallum, “Electrogastrography: Mea- surement, Analysis and Prospective Applications,” Med- ical & Biological Engineering & Computing, Vol. 29, 1991, pp. 339-350. http://dx.doi.org/10.1007/BF02441653 [9] C. Peng, X. Qian and D. Ye, “Electrogastrogram Extrac- tion Using Independent Component Analysis with Refer- ences,” Neural Computing and Applications, Vol. 16, No. 6, 2007, pp. 581-587. http://dx.doi.org/10.1007/s00521-007-0100-3 [10] C. Peng and D. T. Ye, “Relative Power Percentage and Time-Power Percentages Map Analysis of Electrogastro- gram Slow Waves,” Proceedings of 2008 International Conference on Biomedical Engineering and Informatics (BMEI2008), Sanya, Vol. 2, 2008, pp. 875-878. [11] C. Peng, Z. Wu and D. Ye, “Estimation of Percentage of Electrogastrogram Slow Wave Rhythm,” Space Medicine & Medical Engineering, Vol. 20, No. 4, 2007, pp. 280- 284. [12] J. Chen, J. Vandewalle, W. Sansen, G. Vantrappen and J. Janssens, “Adaptive Method for Cancellation of Respira- tory Arte fa ct in Electrogastric Measurements,” Medical & Biological Engineering & Computing, Vol. 27, 1989, pp. 57-63. http://dx.doi.org/10.1007/BF02442170 |