

Paper Menu >>
Journal Menu >>
 Engineering, 2013, 5, 57-61 http://dx.doi.org/10.4236/eng.2013.510B012 Published Online October 2013 (http://www.scirp.org/journal/eng) Copyright © 2013 SciRes. ENG Information Transfer Index-A Promi sing Measure of the Corticomusclar Interaction* Ping Xie1, Peipei Ma1, Xiaoling Chen1, Xiaoli Li1, Yuping Su2 1Institute of Electrical Engineering, Yanshan Univer sity, Qinhuangdao, China 2Department of Rehabilitation, Qinhuangdao People’s Hospital, Qinhuangdao, China Email: pi [email protected] n, [email protected] Received October 2012 ABSTRACT It is generally believed that a major cause of motor dysfunction is the impairment in neural network that controls movement. But little is known about the underlying mechanisms of the impairment in cortical control or in the neural connections between cortex and muscle that lead to the loss of motor ability. So understanding the functional connec- tion between motor cortex and effector muscle is of utmost importance. Previous study mostly relied on cross-correla- tion, coherence functions or model based approaches such as Granger causality or dynamic causal modeling. In this work the information transfer index (ITI) was introduced to describe the information flows between motor cortex and muscle. Based on the information entropy the ITI can detect both linear and nonlinear interaction between two signals and thus represent a very comprehensive way to define the causality strength. The applicability of ITI is investigated based on simulations and electroencephalogram (EEG), surface electromyography (sEMG) recordings in a simple mo- tor task. Keywords: Information Theory; Information Transfer Index; Corticomuscular Interaction 1. Introduction The relationship and interdependence between simulta- neously recorded neurophysiological signals, give in- sights into the function of the systems that produce th em. Since Conway discovered that oscillations at beta band (15 - 30 HZ) in the magnetoencephalogram (MEG) in humans are coherent with the surface electromyogram (sEMG) in 1995 [1]. Many researches have been done focusing on the functional relationship between neurons in the sensorimotor cortex and motor units in the effector muscle. To assess the interdependence between EEG and EMG, cross-correlation or coherence functions have been extensively used which can provide information on the linear correlation between two signals [2]. Coherence has been highly successful as a methodology for assessing functional coupling in neurosciences. Previous study has shown that increased corticomuscular coherence can im- prove motor performance during steady-state motor out- put [3] indicating that coherence may promote effective corticomuscular interaction. Studies have also revealed changes in coherence in some pathological conditions, such as stroke [4]. The methods give useful information in the study of corticomuscular interaction, but it has the intrinsic limitation that the y are linear methods, althoug h neural connectivity may be nonlinear. Thus linear me- thods are insufficient for the study of complex neurophy- siological data. Furthermore, they cannot give the direc- tion of information flow. To better understand the un- derlying mechanism and functional relevance of the sen- sorimotor neural network, it is important to know the direction of the information flow between EEG and EMG [5]. In view of detecting coupling direction, di- rected coherence was proposed based on Grang er causal- ity methods [6]. But this is also a linear method. A po- tential new method should be nonlinear naturally leading to the application of information theoretic techniques. Information theoretic tools, such as entropy, address the issue of linearity and so far have numerous applications in neuroscience. First attempts to measure the relation- ship between two random variables were based on mu- tual information (MI), which can be interpreted as the amount of uncertainty about one signal that can be re- duced by observation of another. MI is based on proba- bility distributions and is sensitive to second and all higher order correlations. But conventional MI can not account for the direction of information flow, because it is a symmetric measure. Seung-Hyun Jin addressed this issue by defining the time-delayed mutual information (TDMI), which adds a time delay in one of the variables * This work was supported by the National Natural Science Foundation of China under Grants 61271142/F010802 and Postdoctoral Science Foundation of China under Grants 2011M500539. 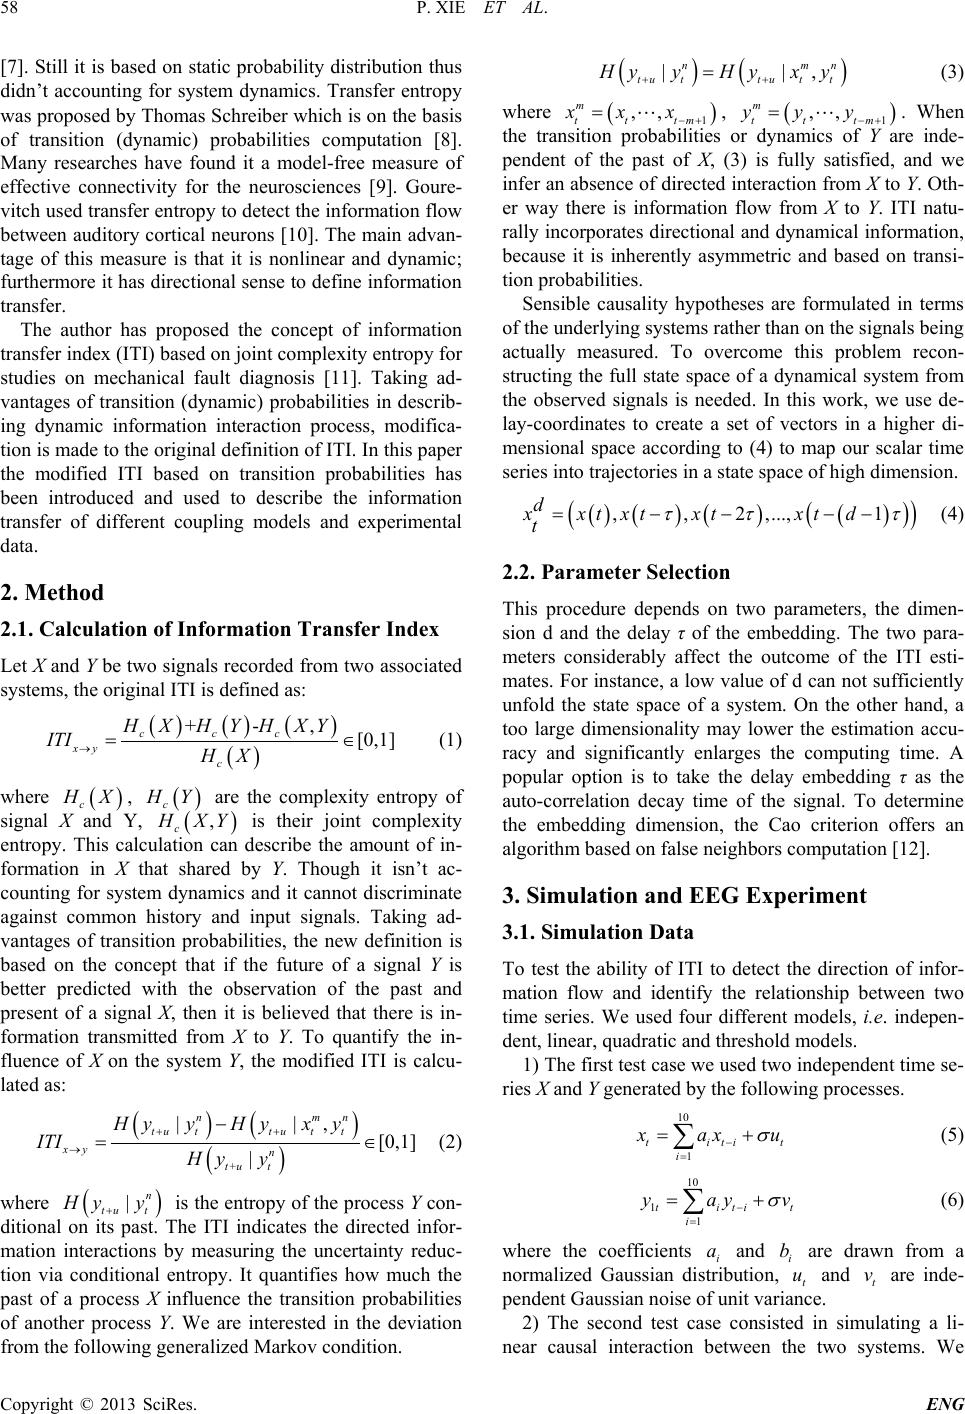 P. XIE ET AL. Copyright © 2013 SciRes. ENG 58 [7]. Still it is based on static probability distribution thus didn’t accounting for system dynamics. Transfer entropy was proposed by Thomas Schreiber which is on the basis of transition (dynamic) probabilities computation [8]. Many researches have found it a model-free measure of effective connectivity for the neurosciences [9]. Goure- vitch used transfer entropy to detect the information flow between auditory c ortical neurons [10]. The main advan- tage of this measure is that it is nonlinear and dynamic; furthermore it has directional sense to define information transfer. The author has proposed the concept of information transfer index (ITI) based on joint complexity entropy for studies on mechanical fault diagnosis [11]. Taking ad- vantages of transition (dynamic) probabilities in describ- ing dynamic information interaction process, modifica- tion is made to the original definition of ITI. In this paper the modified ITI based on transition probabilities has been introduced and used to describe the information transfer of different coupling models and experimental data. 2. Method 2.1. Calculation of Information Transfer Index Let X and Y be two signals recorded from two associated systems, the original ITI is defined as: ()( )() ( ) + -, [0,1] c cc xy c HX HYHXY ITI HX → = ∈ (1) where ( ) c HX , ( ) c HY are the complexity entropy of signal X and Y, ( ) , c H XY is their joint complexity entropy. This calculation can describe the amount of in- formation in X that shared by Y. Though it isn’t ac- counting for system dynamics and it cannot discriminate against common history and input signals. Taking ad- vantages of transition probabilities, the new definition is based on the concept that if the future of a signal Y is better predicted with the observation of the past and present of a signal X, then it is believed that there is in- formation transmitted from X to Y. To quantify the in- fluence of X on the system Y, the modified ITI is calcu- lated as: () () ( ) + ||, [0,1] | n mn tuttu tt xy n tu t HyyHyx y ITI Hy y ++ → − = ∈ (2) where ( ) | n tu t Hy y + is the entropy of the process Y con- ditional on its past. The ITI indicates the directed infor- mation interactions by measuring the uncertainty reduc- tion via conditional entropy. It quantifies how much the past of a process X influence the transition probabilities of another process Y. We are interested in the deviation from the following generalized Markov condition. () () | |, n mn tuttu tt HyyHyx y ++ = (3) where ( ) 1 ,, m tt tm xxx −+ = , ( ) 1 ,, m tt tm yyy −+ = . When the transition probabilities or dynamics of Y are inde- pendent of the past of X, (3) is fully satisfied, and we infer an absence of directed interaction from X to Y. Oth- er way there is information flow from X to Y. ITI natu- rally incorporates direc tional and dynamical information, because it is inherently asymmetric and based on transi- tion probabilities. Sensible causality hypotheses are formulated in terms of the underlying systems rather than on the signals being actually measured. To overcome this problem recon- structing the full state space of a dynamical system from the observed signals is needed. In this work, we use de- lay-coordinates to create a set of vectors in a higher di- mensional space according to (4) to map our scalar time series into trajectories in a state space of high dimension. () () ()() ( ) ( ) ,,2,...,1 d xxt xtxtxtd t ττ τ =− −−− (4) 2.2. Parameter Selection This procedure depends on two parameters, the dimen- sion d and the delay τ of the embedding. The two para- meters considerably affect the outcome of the ITI esti- mates. For instance, a low value of d can not sufficiently unfold the state space of a system. On the other hand, a too large dimensionality may lower the estimation accu- racy and significantly enlarges the computing time. A popular option is to take the delay embedding τ as the auto-correlation decay time of the signal. To determine the embedding dimension, the Cao criterion offers an algorithm based on false neig hb ors com putation [12]. 3. Simulation and EEG Experiment 3.1. Simulation Data To test the ability of ITI to detect the direction of infor- mation flow and identify the relationship between two time series. We used four different models, i.e. indepen- dent, linear, quadratic and threshold models. 1) The first test case we used two independent time se- ries X and Y generated by t he followin g process e s. 10 1 ti tit i xax u σ − = = + ∑ (5) 10 11 ti tit i yay v σ − = = + ∑ (6 ) where the coefficients i a and i b are drawn from a normalized Gaussian distribution, t u and t v are inde- pendent Gaussian noise of unit variance. 2) The second test case consisted in simulating a li- near causal interaction between the two systems. We 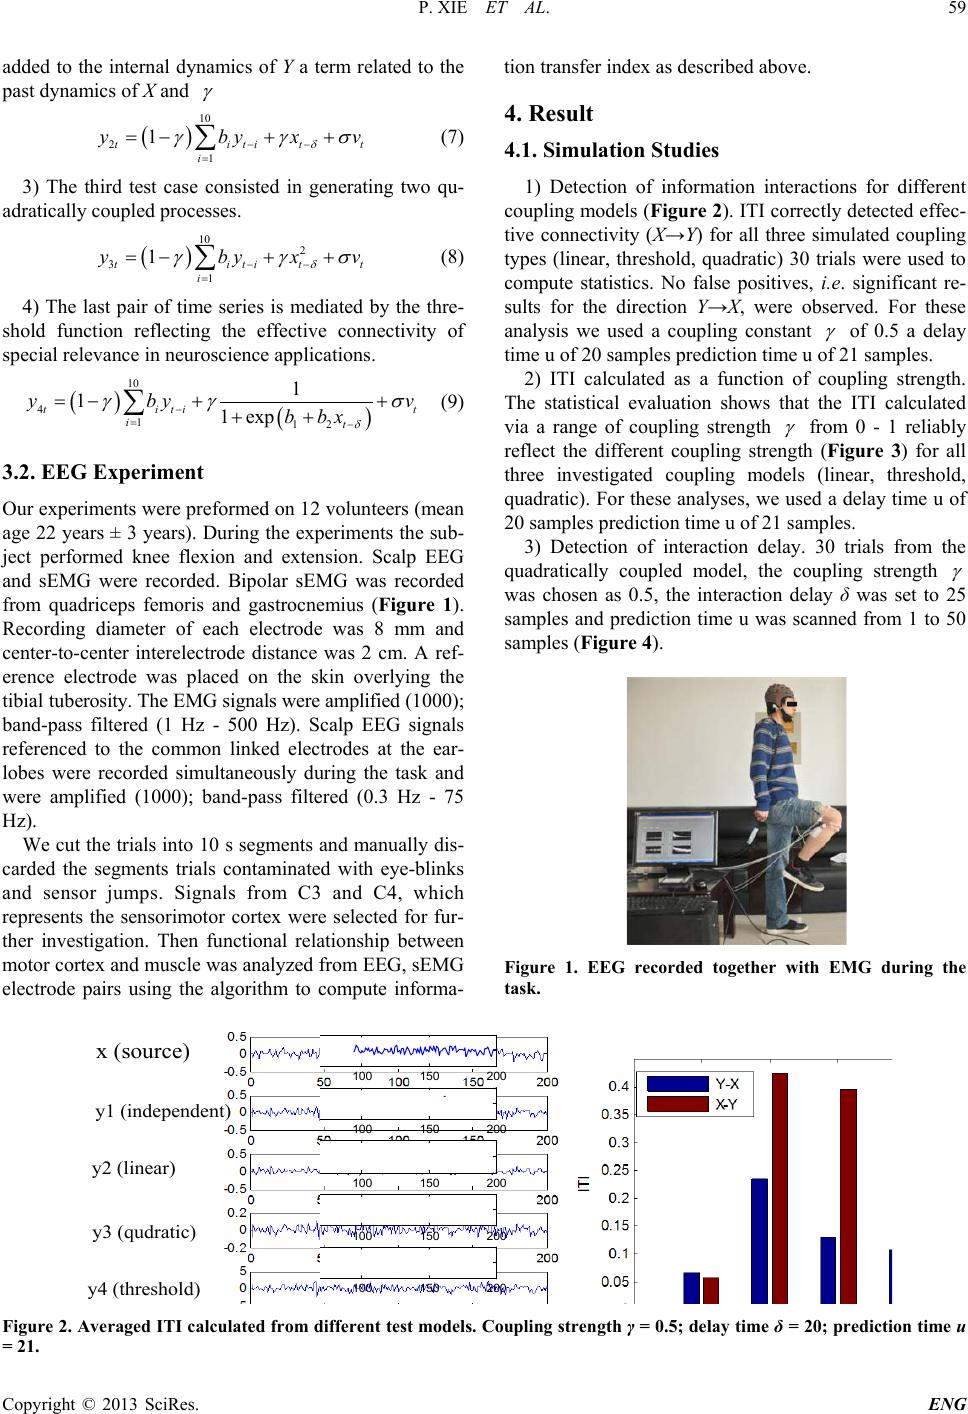 P. XIE ET AL. Copyright © 2013 SciRes. ENG 59 added to the internal dynamics of Y a term related to the past dynamics of X and γ ( ) 10 21 1 ti titt i yby xv δ γ γσ −− = =− ++ ∑ (7) 3) The third test case consisted in generating two qu- adratically coupled processes. ( ) 10 2 31 1 ti titt i ybyxv δ γ γσ −− = =− ++ ∑ (8) 4) The last pair of time series is mediated by the thre- shold function reflecting the effective connectivity of special relevance in neuroscience applications. ( )( ) 10 4112 1 11 exp ti tit it y byv b bx δ γγ σ − =− =−+ + ++ ∑ (9) 3.2. EEG Experiment Our experiments were preformed on 12 volunteers (mean age 22 years ± 3 years). During the experiments the sub- ject performed knee flexion and extension. Scalp EEG and sEMG were recorded. Bipolar sEMG was recorded from quadriceps femoris and gastrocnemius (Figure 1). Recording diameter of each electrode was 8 mm and center-to-center interelectrode distance was 2 cm. A ref- erence electrode was placed on the skin overlying the tibial tuberosity. Th e EMG s ign als were amp lified ( 1000); band-pass filtered (1 Hz - 500 Hz). Scalp EEG signals referenced to the common linked electrodes at the ear- lobes were recorded simultaneously during the task and were amplified (1000); band-pass filtered (0.3 Hz - 75 Hz). We cut the trials into 10 s segments and manually dis- carded the segments trials contaminated with eye-blinks and sensor jumps. Signals from C3 and C4, which represents the sensorimotor cortex were selected for fur- ther investigation. Then functional relationship between motor cortex and muscle was analyzed from EEG, sE MG electrode pairs using the algorithm to compute informa- tion transfer index as described above. 4. Result 4.1. Simulation Studies 1) Detection of information interactions for different coupling models (Figure 2). ITI correctly detected effec- tive connectivity (X→Y) for all three simulated coupling types (linear, threshold, quadratic) 30 trials were used to compute statistics. No false positives, i.e. significant re- sults for the direction Y→X, were observed. For these analysis we used a coupling constant γ of 0.5 a delay time u of 20 samples prediction time u of 21 samples. 2) ITI calculated as a function of coupling strength. The statistical evaluation shows that the ITI calculated via a range of coupling strength γ from 0 - 1 reliably reflect the different coupling strength (Figure 3) for all three investigated coupling models (linear, threshold, quadratic). For these analyses, we used a delay time u of 20 samples prediction time u of 21 samples. 3) Detection of interaction delay. 30 trials from the quadratically coupled model, the coupling strength γ was chosen as 0.5, the interaction delay δ was set to 25 samples and prediction time u was scanned from 1 to 50 samples (Figure 4). Figure 1. EEG recorded together with EMG during the task. Figure 2. Averaged ITI calculated from different test models. Coupling strength γ = 0.5; delay time δ = 20; prediction time u = 21. 100 150 200 100 150 200 100 150 200 100 150 200 100 150 200 x (source) y1 (independent) y2 (linear) y3 (qudratic) y4 (threshold) 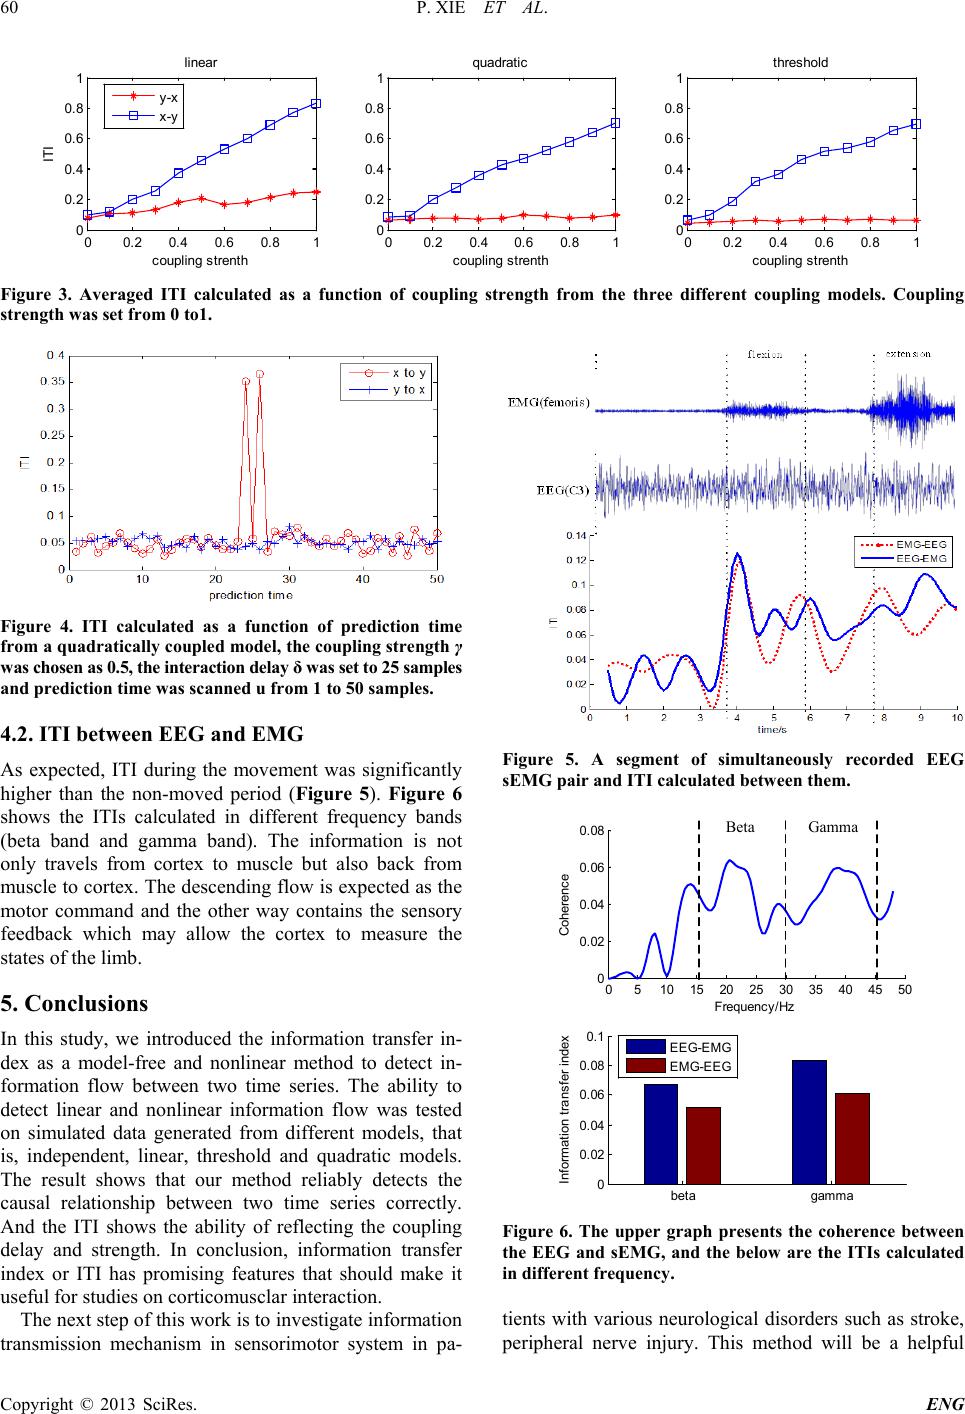 P. XIE ET AL. Copyright © 2013 SciRes. ENG 60 Figure 3. Averaged ITI calculated as a function of coupling strength from the three different coupling models. Coupling strength was set from 0 to1. Figure 4. ITI calculated as a function of prediction time from a quadratically coupled model, the coupling strength γ was chosen as 0.5, the interaction delay δ was set to 25 samples and prediction time was scanned u from 1 to 50 samples. 4.2. ITI between EEG and EMG As expected, ITI during the movement was significantly higher than the non-moved period (Figure 5). Figure 6 shows the ITIs calculated in different frequency bands (beta band and gamma band). The information is not only travels from cortex to muscle but also back from muscle to cortex. The descending flow is expected as the motor command and the other way contains the sensory feedback which may allow the cortex to measure the states of the limb. 5. Conclusions In this study, we introduced the information transfer in- dex as a model-free and nonlinear method to detect in- formation flow between two time series. The ability to detect linear and nonlinear information flow was tested on simulated data generated from different models, that is, independent, linear, threshold and quadratic models. The result shows that our method reliably detects the causal relationship between two time series correctly. And the ITI shows the ability of reflecting the coupling delay and strength. In conclusion, information transfer index or ITI has promising features that should make it useful fo r studies on corticomusclar interaction. The next step of this work is to investigate information transmission mechanism in sensorimotor system in pa- Figure 5. A segment of simultaneously recorded EEG sEMG pair and ITI calculated between them. Figure 6. The upper graph presents the coherence between the EEG and sEMG, and the below are the ITIs calculated in different f requency. tients with various neurological disorders such as stroke, peripheral nerve injury. This method will be a helpful 00.2 0.4 0.6 0.8 1 0 0. 2 0. 4 0. 6 0. 8 1li near ITI c oupl i ng st rent h00.2 0.4 0.6 0.8 1 0 0. 2 0. 4 0. 6 0. 8 1quadrat i c c oupl i ng st rent h00.2 0.4 0.6 0.8 1 0 0. 2 0. 4 0. 6 0. 8 1 c oupl i ng st rent h t hreshold y-x x-y 05 10 15 2025 30 3540 45 50 0 0. 02 0. 04 0. 06 0. 08 Frequency/ Hz Coherence beta gamma 0 0. 02 0. 04 0. 06 0. 08 0. 1 I nf orm ati on trans f er i ndex EEG-EMG EMG-EEG Beta Gamma  P. XIE ET AL. Copyright © 2013 SciRes. ENG 61 addition in evaluating the integrity and functionality neural circuits. REFERENCES [1] B. A. Conway, D. M. Halliday and U. Shahani, “Com- mon Frequency Components Identified from Correlations between Magnetic Recordings of Cortical Activity and the Electromyogram in Ma n,” Journal of Physiol ogy, Vol. 483, 1995, pp. 35 -69. [2] M.A. Perez, D. S. Soteropoulos and S. N. Baker, “Corti- comuscular Coherence during Bilateral Isometric Arm Voluntary Activity in Healthy Humans,” Journal of Neu- rophysiology, Vol. 107, 2012, pp. 2154-2162. http://dx.doi.org/10.1152/jn.00722.2011 [3] V. Chakarov, J. Rau, Naranjo and J. Schulte-Monting, “Beta-Range EEG-EMG Coherence with Isometric Com- pensation for Increasing Modulated Low-Level Forces,” Journal of Neurophysiology, Vol. 102, 2009, pp. 1115- 1120. http://dx.doi.org/10.1152/jn.91095.2008 [4] Y. Fang, J. J. Daly and J. Sun, “Functional Corticomus- cular Connection during Reaching Is Weakened Follow- ing Stroke,” Clinical Neurophysiology, Vol. 120, 2009, pp. 994-1002. http://dx.doi.org/10.1016/j.clinph.2009.02.173 [5] F. Vecchio and C. Babiloni, “Direction of Information Flow in Alzheimer’s Disease and MCI Patients,” Interna- tional Journal of Alzheimer’s Disease, Vol. 10, 2011, pp. 1168-1179. [6] C. L. Witham, C. N. Riddle and M. R. Bakerand, “Con- tributions of Descending and Ascending Pathways to Cor- ticomuscular Coherence in Humans,” The Journal of Phy- siology, Vol. 589, 2011, pp. 3789-3800. http://dx.doi.org/10.1113/jphysiol.2011.211045 [7] S.-H. Jin, P. Lin and M. Hallett, “Linear and Nonlinear Information Flow Based on Time Delayed Mutual Infor- mation Method and Its Application to Corticomuscular Interaction,” Clinical Neurophysiology, Vol. 121, 2010, pp. 392-418. http://dx.doi.org/10.1016/j.clinph.2009.09.033 [8] T. Schreiber, “Measuring Information Transfer,” Physical Review Letters, Vol. 85, 2000, pp. 461-464. http://dx.doi.org/10.1103/PhysRevLett.85.461 [9] B. Gourevitch and J. J. Eggermont, “Evaluating Informa- tion Transfer between Auditory Cortical Neurons,” Jour- nal of Neurophysiology, Vol. 97, 2007, pp. 533-2543. [10] R. Vicente , M. Wibral, M. Lindner and G. Pipa, “Transfer Entropy—A Model-Free Measure of Effective Connec- tivity for the Neurosciences,” Journal of Computational Neuroscience, Vol. 30, 2011, pp. 45-67. http://dx.doi.org/10.1007/s10827-010-0262-3 [11] P. Xie, Y. H. Du and S. F. Huang, “Study of Feature Ex- traction Method for Complex Mechanical System Based on Infor mation E ntropy,” Journal of Viberation and Shock, Vol. 27, 2007, pp. 135-128. [12] L. Ca o, “Practi cal Method for Determining the Minimum Embedding Dimension of a Scalar Time Ser ies,” Physica, Vol. 110, 1997, pp. 43-50. |