

Paper Menu >>
Journal Menu >>
 Engineering, 2013, 5, 53-56 http://dx.doi.org/10.4236/eng.2013.510B011 Published Online October 2013 (http://www.scirp.org/journal/eng) Copyright © 2013 SciRes. ENG An Integrated Analysis of Aberrantly Expressed miRNA and mRNA Profiles Unveils a Robus t Regu latory Network in HepG2 Cell* Sheng Yang, Hui Zhang, Li Guo, Yang Zhao, Feng Chen# Department of Epidemiology and Biostatistics, Nanjing Medical University (NJMU), Nanjing, China Email: kyny2011@hotmail.com, zhanghui31[email protected], [email protected], Received October 2012 ABSTRACT As crucial negative regu latory small non-coding molecules, microRNAs (miRNAs), have multiple biological roles. The abnormal expression of specific miRNAs may contribute to the occurrence and development of tumor. Here, based on HepG2 and L02 cells, we attempted to demonstrate the potential regulatory network of aberrantly expressed miRN A profiles, interaction between miRNA and mRNA, and potential functional correlation between different miRNAs. De- regulated miRNA and mRNA expression profiles were completely surveyed and identified by applying deep sequenc- ing and microarray techniques, respectively. The genome-wide and integrative analysis of miRNA-mRNA was per- formed based on their functional relationship according to experimentally validated and predicted targets. Nearly 50% targets were negatively regulated by at least 2 aberrantly expressed miRNAs. Similar results were obtained based on experimentally validated and predicted targets. Compared with abnormal miRNAs , their targets showed various expres- sion patterns: stably expressed, down-regulated or up-regulated. Although the theoretical potential miRNA-mRNA in- teraction could be predicted, they showed consistent or inconsistent expression patterns. Both functional enrichment analysis of target mRNAs of dysregulated miRNAs and abnormal mRNA profiles suggested that corresponding path- ways were involved in tumorigenesis. Moreover, to obtain potential fun ction al relation ships between different miRNAs, we also performed expression analysis of homologous miRNAs in gene families. Generally, they could co-regulate bi- ological processes with similar roles. The integr ative analysis of miRNA-mRNA ind icated a complex and flexible reg- ulatory network. The robust network mainly derived from multiple targets for a specific miRNA (and vice ver sa), each mRNA and co-regulation roles of different miRNAs. Keywords: miRNA (mi c roRNA ); mRNA; Intergrated Analysis; Hepatoma Carcinoma Cell 1. Introduction MicroRNAs (miRNA) are not only the most conserved but also special non-coding RNAs which guide RNA silencing. These different characters are given rise to the disparate structure and biogenesis [1]. Mature miRNA with a length of approximately 22 nucleotides (nt) is a single strand and processes from a stem-loop precursor miRNA (pre-miRNA) molecule (60 - 120 nt), with the assistance of DISER. Before the precursor forming, pri- mary miRNA (pri-miRNA) is cleaved by a ribonuclease (RNase), such as DROSHA. After processing the miR- NA duplex, one strand, called mature or active miRNA, is loaded into AGO protein to participate the post-tr an s- criptional procedure. Then the single strand miRNA is incorporated with RNA-inducing silencing complex (RISC) that interacts with 3’ untranslated region (UTR) of messenger RNAs (mRNAs) through base pairing to facilitate mRNAs repression or degradation [2-4]. Many experimental and bioinformatics analysis evi- dences indicate that one single miRNA can regulate or depress a great amount of mRNAs, because miRNAs match the mRNAs only by the seed sequence which is comprised by the nucleotides from 2 to 7 or 8 [5]. The process of RNA silencing or RNA interference is com- pleted of miRNAs, whose abnormal expression may give rise to many tumors, such as breast cancer, non-s ma l l - cell lung cancer and bladder cancer [1,6-8]. Recently, the personalized treatment of cancer patients has been de- veloping with the deep study of molecular characteriza- *The work was supported by the project of 810723 89 from National Natural Science Foundation of China and a Project Funded by the Priority Academic Program Development of Jiangsu Higher Education Institutions (PAPD). # Corresponding author. 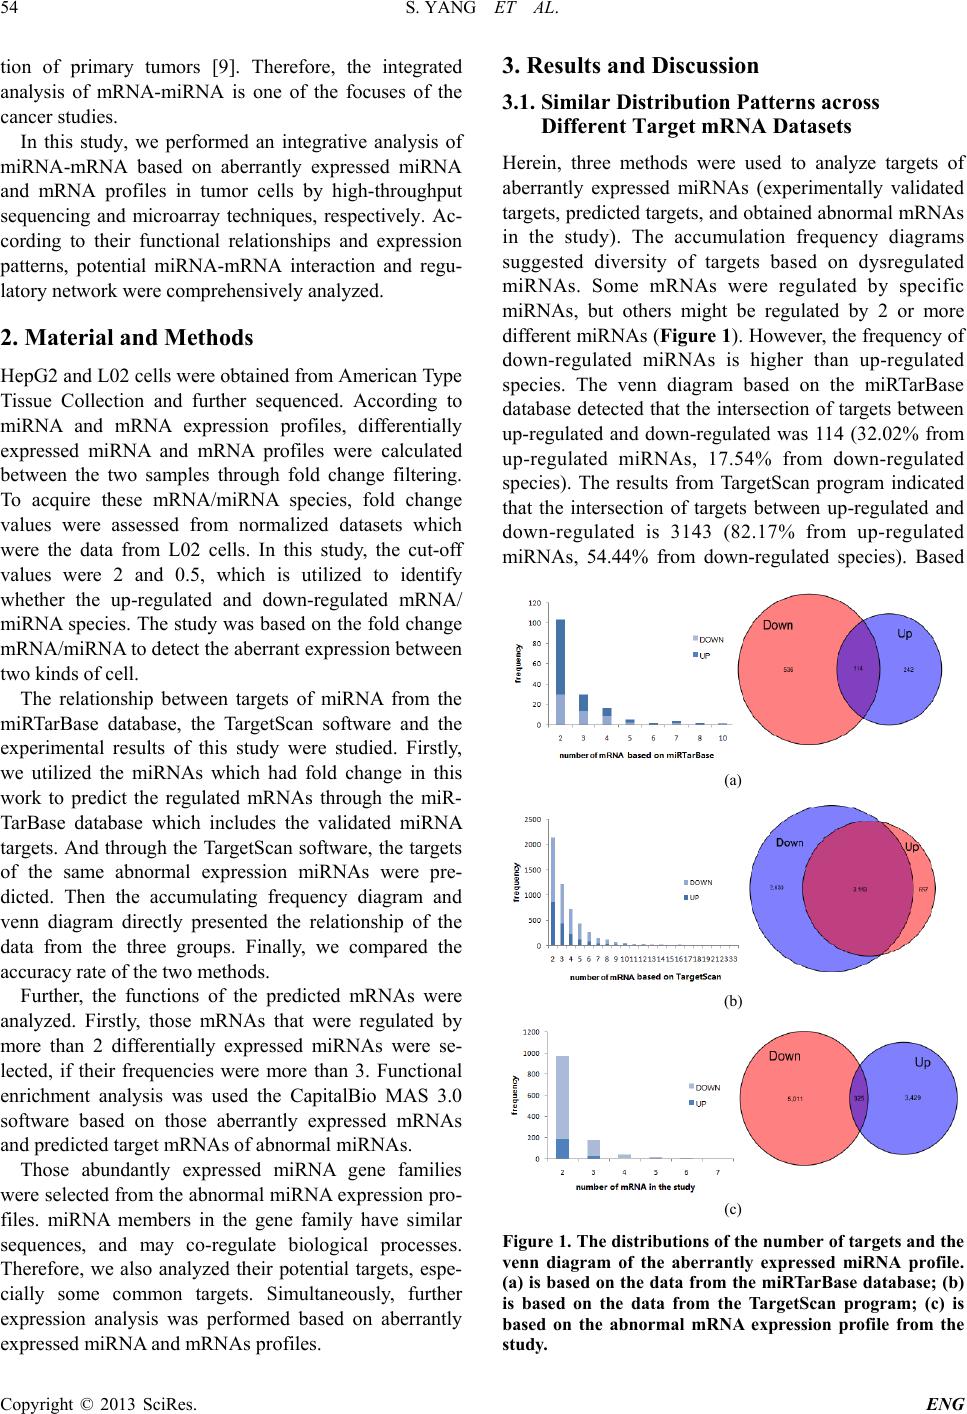 S. YANG ET AL. Copyright © 2013 SciRes. ENG 54 tion of primary tumors [9]. Therefore, the integrated analysis of mRNA-miRNA is one of the focuses of the cancer studies. In this study, we performed an integrative analysis of miRNA-mRNA based on aberrantly expressed miRNA and mRNA profiles in tumor cells by high-throughput sequencing and microarray techniques, respectively. Ac- cording to their functional relationships and expression patterns, potential miRNA-mRNA interaction and regu- latory network were comprehensively analyzed. 2. Material and Methods HepG2 an d L02 cells were obtained from American Type Tissue Collection and further sequenced. According to miRNA and mRNA expression profiles, differentially expressed miRNA and mRNA profiles were calculated between the two samples through fold change filtering. To acquire these mRNA/miRNA species, fold change values were assessed from normalized datasets which were the data from L02 cells. In this study, the cut-off values were 2 and 0.5, which is utilized to identify whether the up-regulated and down-regulated mRNA/ miRNA species. The study was based on the fold change mRNA/miRNA to detect the aberrant expr ession between two kinds of cell. The relationship between targets of miRNA from the miRTarBase database, the TargetScan software and the experimental results of this study were studied. Firstly, we utilized the miRNAs which had fold change in this work to predict the regulated mRNAs through the miR- Tar Ba se database which includes the validated miRNA targets. And through the TargetScan software, the targets of the same abnormal expression miRNAs were pre- dicted. Then the accumulating frequency diagram and venn diagram directly presented the relationship of the data from the three groups. Finally, we compared the accuracy rate of the two methods. Further, the functions of the predicted mRNAs were analyzed. Firstly, those mRNAs that were regulated by more than 2 differentially expressed miRNAs were se- lected, if their frequencies were more than 3. Functional enrichment analysis was used the CapitalBio MAS 3.0 software based on those aberran tly expressed mRNAs and predicted target mRNAs of abnormal miRNAs. Those abundantly expressed miRNA gene families were selected from the abnormal miRNA expression pro- files. miRNA members in the gene family have similar sequences, and may co-regulate biological processes. Therefore, we also analyzed their potential targets, espe- cially some common targets. Simultaneously, further expression analysis was performed based on aberrant ly expressed miRNA and mRNAs profiles. 3. Results and Discussion 3.1. Similar Distribution Patterns across Different Target mRNA Datasets Herein, three methods were used to analyze targets of aberrantly expressed miRNAs (experimentally validated targets, pred icted targets, and obtained abnormal mRNAs in the study). The accumulation frequency diagrams suggested diversity of targets based on dysregulated miRNAs. Some mRNAs were regulated by specific miRNAs, but others might be regulated by 2 or more differen t miRNAs (Figure 1). However, the frequ ency of down-regulated miRNAs is higher than up-r egu lated species. The venn diagram based on the miRTarBase database detected that the intersection of targets between up-regulated and down-regulated was 11 4 (32.02% from up-regulated miRNAs, 17.54% from down-regulated species). The results from TargetScan program indicated that the intersection of targets between up-regulated and down-regulated is 3143 (82.17% from up-regulated miRNAs, 54.44% from down-regulated species). Based (a) (b) (c) Figure 1. The dist ribution s of the number of targets an d the venn diagram of the aberrantly expressed miRNA profile. (a) is based on the data from the miRTarBase database; (b) is based on the data from the TargetScan program; (c) is based on the abnormal mRNA expression profile from the study. 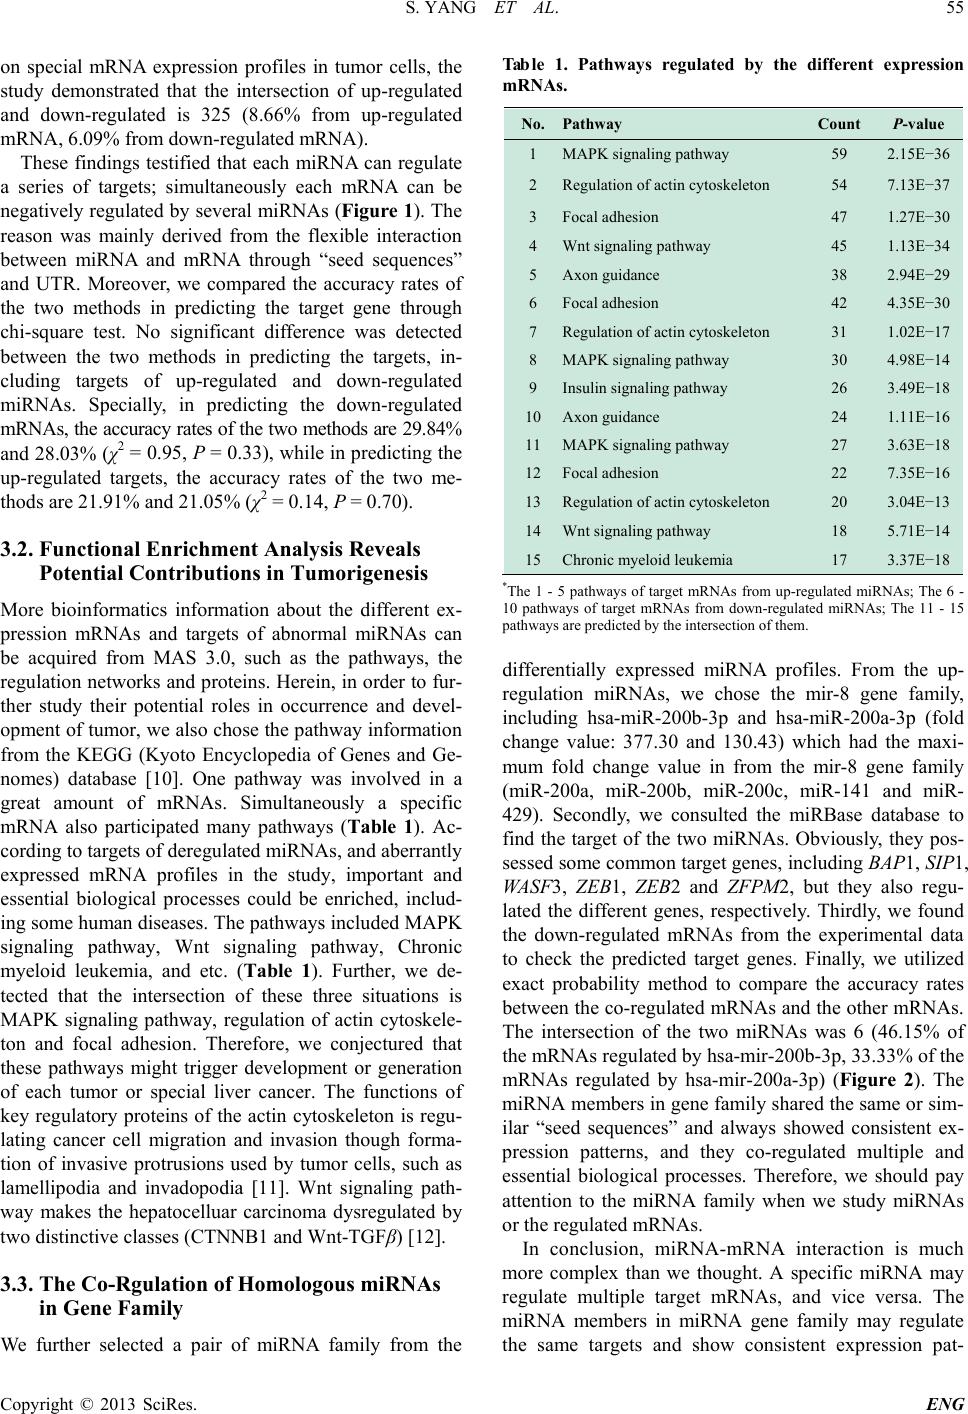 S. YANG ET AL. Copyright © 2013 SciRes. ENG 55 on special mRNA expression profiles in tumor cells, the study demonstrated that the intersection of up-regulated and down-regulated is 325 (8.66% from up-regulated mRNA, 6.09% from down-regulated mRNA). These findings testified that each miRNA can regulate a series of targets; simultaneously each mRNA can be negatively regulated by several miRNAs (F ig ure 1). The reason was mainly derived from the flexible interaction between miRNA and mRNA through “seed sequences” and UTR. Moreover, we compared the accuracy rates of the two methods in predicting the target gene through chi-square test. No significant difference was detected between the two methods in predicting the targets, in - cluding targets of up-regulated and down-regulated miRNAs. Specially, in predicting the down-regulated mRNAs, the accuracy rates of the two methods are 29.84% and 28.0 3% (χ2 = 0.95, P = 0.33), wh ile in predicting the up-regulated targets, the accuracy rates of the two me- thods are 21.91% and 21.05% (χ2 = 0.14, P = 0.70). 3.2. Functional Enrichment Analysis Reveals Potential Contributions in Tumorigenesis More bioinformatics information about the different ex- pression mRNAs and targets of abnormal miRNAs can be a cqu ir ed from MAS 3.0, such as the pathways, the regulation netw orks and proteins. Herein, in order to fur- ther study their potential roles in occu rr en ce and devel- opment of tumor, we also chose the pathway information from the KEGG (Kyoto Encyclopedia of Genes and Ge- nomes) database [10]. One pathway was involved in a great amount of mRNAs. Simultaneously a specific mRNA also participated many pathways (Table 1). Ac- cording to targets of der eg ul ated miRNAs, and aberrantly expressed mRNA profiles in the study, important and essential biological processes could be enriched, includ- ing some human diseases. The pathways included MAPK signaling pathway, Wnt signaling pathway, Chronic myeloid leukemia, and etc. (Table 1). Further, we de- tected that the intersection of these three situations is MAPK signaling pathway, regulation of actin cytoskele- ton and focal adhesion. Therefore, we conjectured that these pathways might trigger development or generation of each tumor or special liver cancer. The functions of key regulatory proteins of the actin cytoskeleton is regu- lating cancer cell migration and invasion though forma- tion of invasive protrusions used by tumor cells, such as lamellipodia and invadopodia [11]. Wnt signaling path- way makes the hepatocelluar carcinoma dysregulated by two distinctive classes (CTNNB1 and Wnt -TGFβ) [12]. 3.3. The Co-Rgulation of Homologous miRNAs in Gene Family We further selected a pair of miRNA family from the Table 1. Pathways regulated by the different expression mRNAs. No. Pathway Count P-value 1 MAPK signaling pathway 59 2.15E−36 2 Regulation of actin cytoskeleton 54 7.13E−37 3 Focal adhesion 47 1.27E−30 4 Wnt signaling pathway 45 1.13E−34 5 Axon guidance 38 2.94E−29 6 Focal adhesion 42 4.35E−30 7 Regulation of actin cytoskeleton 31 1.02E−17 8 MAPK signaling pathway 30 4.98E−14 9 Insulin signaling pathway 26 3.49E−18 10 Axon guidance 24 1.11E−16 11 MAPK signaling pathway 27 3.63E−18 12 Focal adhesion 22 7.35E−16 13 Regulation of actin cytoskeleton 20 3.04E−13 14 Wnt signaling pathway 18 5.71E−14 15 Chronic myeloid leukemia 17 3.37E−18 *The 1 - 5 pathways of target mRNAs from up-regulated miRNAs; The 6 - 10 pathways of target mRNAs from down-regulated miRNAs; The 11 - 15 pathways are predicted by the intersection of them. differentially expressed miRNA profiles. From the up- regulation miRNAs, we chose the mir-8 gene family, including hsa-miR-200b-3p and hsa-miR-200a-3p (fold change value: 377.30 and 130.43) which had the maxi- mum fold change value in from the mir-8 gene family (mi R-200a, miR-200b, mi R-200c, mi R-141 and miR- 429). Secondly, we consulted the miRBase database to find the target of the two miRNAs. Obviously, they pos- sessed some common target genes, including BAP1, SIP1, WASF3, ZEB1, ZEB2 and ZFPM2, but they also regu- lated the different genes, respectively. Thirdly, we found the down-regulated mRNAs from the experimental data to check the predicted target genes. Finally, we utilized exact probability method to compare the accuracy rates between the co-regulated mRNAs and the other mRNAs. The intersection of the two miRNAs was 6 (46.15% of the mRNAs regulated by hsa-mir-200b-3p, 33.33% of the mRNAs regulated by hsa-mir- 200 a-3p) (Figure 2). The miRNA members in gene family shared the same or sim- ilar “seed sequences” and always showed consistent ex- pression patterns, and they co-regulated multiple and essential biological processes. Therefore, we should pay attention to the miRNA family when we study miRNAs or the regulated mRNAs. In conclusion, miRNA-mRNA interaction is much more complex than we thought. A specific miRNA may regulate multiple target mRNAs, and vice versa. The miRNA members in miRNA gene family may regulate the same targets and show cons istent expression pat- 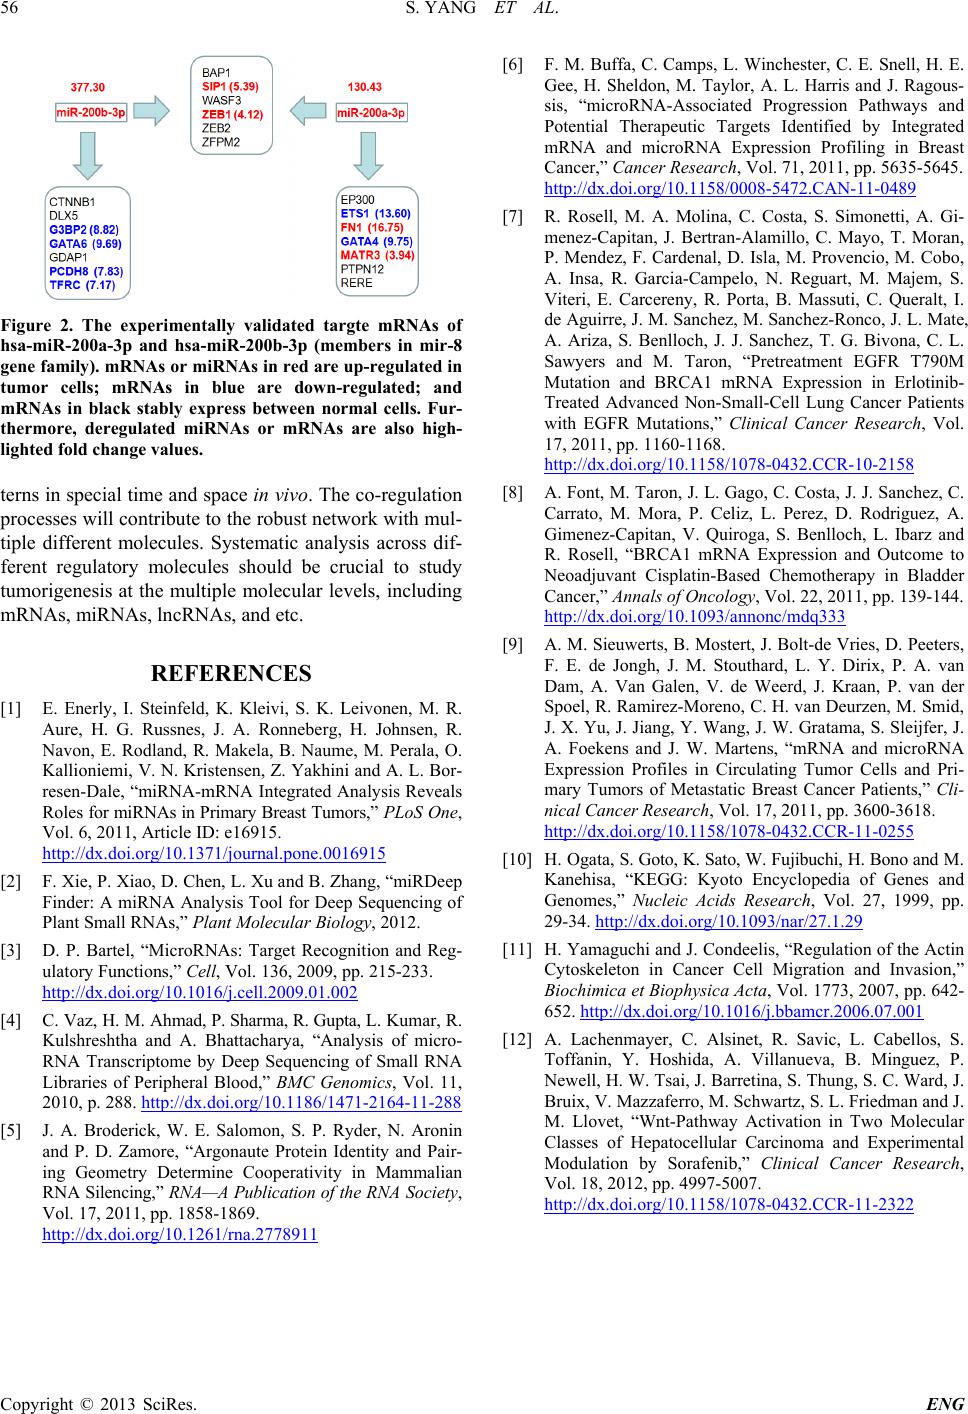 S. YANG ET AL. Copyright © 2013 SciRes. ENG 56 Figure 2. The experimentally validated targte mRNAs of hsa-miR-200a-3p and hsa-miR -200b-3p (members in mir-8 gene family). mRNAs or mi RNAs in red are up-regulated in tumor cells; mRNAs in blue are down-regulated; and mRNAs in black stably express between normal cells. Fur- thermore, deregulated miRNAs or mRNAs are also high- lighted fold change values. terns in special time and space in vivo. The co-regulation processes will contribute to the robust network with mul- tiple different molecules. Systematic analysis across dif- ferent regulatory molecules should be crucial to study tumorigenesis at the multiple molecular levels, including mRNAs, miRNAs, lncRNA s, and etc. REFERENCES [1] E. Enerly, I. Steinfeld, K. Kleivi, S. K. Leivonen, M. R. Aure, H. G. Russnes, J. A. Ronneberg, H. Johnsen, R. Navon, E. Rodland, R. Makela, B. Naume, M. Perala, O. Kallioniemi, V. N. Kristensen, Z. Yakhini and A. L. Bor- resen-Dale, “miRNA-mRNA Inte grated Analysis Reveals Roles for miRNAs in Primary Breast Tumor s,” PLoS One, Vol. 6, 2011, Article ID: e16915. http://dx.doi.org/10.1371/journal.pone.0016915 [2] F. Xie, P. Xiao, D. Chen, L. Xu and B. Zhang, “miRDeep Finder: A miRNA Analysi s Tool for Deep Sequencing of Plant Small RNAs,” Plant Molecular Biology, 2012. [3] D. P. Bartel, “MicroRNAs: Target Recognition and Reg- ulatory Functions,” Cell, Vol. 136, 2009, pp. 215-233. http://dx.doi.org/10.1016/j.cell.2009.01.002 [4] C. Vaz, H. M. Ahmad, P. Shar ma, R. Gupta , L. Kumar, R. Kulshreshtha and A. Bhattacharya, “Analysis of micro- RNA Transcriptome by Deep Sequencing of Small RNA Libraries of Peripheral Blood,” BMC Genomics, Vol. 11, 2010, p. 288 . http://dx.doi.org/10.1186/1471-2164-11-288 [5] J. A. Broderick, W. E. Salomon, S. P. Ryder, N. Aronin and P. D. Zamore, “Argonaute Protein Identity and Pair- ing Geometry Determine Cooperativity in Mammalian RNA Silencing,” RNA —A Public ation of the RNA Soci ety, Vol. 17, 2011, pp. 1858-1869. http://dx.doi.org/10.1261/rna.2778911 [6] F. M. Buffa, C. Camps, L. Winchester, C. E. Snell, H. E. Gee, H. Sheldon, M. Taylor, A. L. Harris and J. Ragous- sis, “microRNA-Associated Progression Pathways and Potential Therapeutic Targets Identified by Integrated mRNA and microRNA Expression Profiling in Breast Cancer,” Cancer Research, Vol. 71, 2011, pp. 5635-5645. http://dx.doi.org/10.1158/0008-5472.CAN-11-0489 [7] R. Rosell, M. A. Molina, C. Costa, S. Simonetti, A. Gi- menez-Capitan, J. Bertran-Alamillo, C. Mayo, T. Moran, P. Mendez, F. Cardenal, D. Isla, M. Provencio, M. Cobo, A. Insa, R. Garcia-Campelo, N. Reguart, M. Majem, S. Viteri, E. Carcereny, R. Porta, B. Massuti, C. Queralt, I. de Aguirre, J. M. Sanchez, M. Sanchez-Ronco, J. L. Mate, A. Ariza, S. Benlloch, J. J. Sanchez, T. G. Bivona, C. L. Sawyers and M. Taron, “Pretreatment EGFR T790M Mutation and BRCA1 mRNA Expression in Erlotinib- Treated Advanced Non-Small-Cell Lung Cancer Patients with EGFR Mutations,” Clinical Cancer Research, Vol. 17, 2011, pp. 1160-1168. http://dx.doi.org/10.1158/1078-0432.CCR-10-2158 [8] A. Font, M. Taron, J. L. Gago, C. Costa, J. J. Sanchez, C. Carrato, M. Mora, P. Celiz, L. Perez, D. Rodriguez, A. Gimenez-Capitan, V. Quiroga, S. Benlloch, L. Ibarz and R. Rosell, “BRCA1 mRNA Expression and Outcome to Neoadjuvant Cisplatin-Based Chemotherapy in Bladder Cancer,” Annals of Oncology, Vol. 22, 2011, pp. 139-144. http://dx.doi.org/10.1093/annonc/mdq333 [9] A. M. Sieuwerts, B. Mostert, J. Bolt-de Vries, D. Peeters, F. E. de Jongh, J. M. Stouthard, L. Y. Dirix, P. A. van Dam, A. Van Galen, V. de Weerd, J. Kraan, P. van der Spoel, R. Ramirez-Moreno, C. H. van Deurzen, M. S mid, J. X. Yu, J. Jia ng, Y . Wang, J. W. Gratama, S. Sl eijfer, J. A. Foekens and J. W. Martens, “mRNA and microRNA Expression Profiles in Circulating Tumor Cells and Pri- mary Tumors of Metastatic Breast Cancer Patients,” Cli- nical Cancer Research, Vol. 17, 2011, pp. 3600-3618. http://dx.doi.org/10.1158/1078-0432.CCR-11-0255 [10] H. Ogata, S. Goto, K. Sato, W. Fujibuchi, H. Bono and M. Kanehisa, “KEGG: Kyoto Encyclopedia of Genes and Genomes,” Nucleic Acids Research, Vol. 27, 1999, pp. 29-34. http://dx.doi.org/10.1093/nar/27.1.29 [11] H. Yamaguchi and J. Condeelis, “Regulati on of the Actin Cytoskeleton in Cancer Cell Migration and Invasion,” Biochimica et Biophysica Acta, Vol. 1773, 2007, pp. 642- 652. http://dx.doi.org/10.1016/j.bbamcr.2006.07.001 [12] A. Lachenmayer, C. Alsinet, R. Savic, L. Cabellos, S. Toffanin, Y. Hoshida, A. Villanueva, B. Minguez, P. Newell, H. W. Tsai , J. Barretina, S. Thung, S. C. Ward, J. Bruix, V. Mazzaferro, M. Schwartz, S. L. Friedman and J. M. Llovet, “Wnt-Pathway Activation in Two Molecular Classes of Hepatocellular Carcinoma and Experimental Modulation by Sorafenib,” Clinical Cancer Research, Vol. 18, 2012, pp. 4997-5007. http://dx.doi.org/10.1158/1078-0432.CCR-11-2322 |