

Paper Menu >>
Journal Menu >>
 Open Journal of Geology, 2013, 3, 28-33 doi:10.4236/ojg.2013.32B007 Published Online April 2013 (http://www.scirp.org/journal/ojg) Gravity Modeling for the Rifted Crust at the Arabian Shield Margin – Further Insight into Red Sea Spreading Saad Mogren, Manoj Mukhopadhyay Department Department of Geology and Geophysics, King Saud University, Riyadh, Kingdom of Saudi Arabia Email: [email protected] Received 2013 ABSTRACT A large variation in elevation and gravity anomaly prevails from the Red Sea coast to the interior of the Arabian Shield (AS) across the Asir Igneous Province (AIP); The Asir Mountain (AM) is developed on AIP. Here the elevation varies from 45 - 2700 m, corresponding changes in F.A. are from –30 to + 220 mgal and B.A. from +22 to –175 mgal. Regres- sion relationships between elevation and gravity anomalies demonstrate significant changes in trend at about 400 m threshold of elevation across the pediment west of AM, at about 45 km inland of the shoreline, flanking the Hizaz-Asir Escarpment (HAE). Gravity anomaly variation along a traverse taken across HAE and AIP is interpreted here in terms of anomalous masses in crust as well as due to deeper crustal configuration. 2D gravity interpretation is, in part, con- strained by surface geology, available geologic cross-sections for crust, interpretations from the IRIS Deep-Seismic Refraction Line, and to a lesser extent by the available gross results from shear-wave splitting and receiver function analysis. The gravity model provides probable solutions for the first time on geometric configuration and geophysical identification: a) for the seaward margin of the mid-Tertiary Mafic Crust (TMC) below sediment cover of the Asir pediment that coincides with the 400 m threshold elevation. This signifies an anomalous uplift at the rifting phase. Moho below TMC extends from 10 - 22 km depth across HAE and west margin of AIP, b). Thinned continental crust below the Asir margin whose upper layer coincides with a seismic reflector is at about 22 km depth, c). Rift-margin characteristic detachment fault associated with basaltic flows on top surface of TMC at its inner margin, d). Two geo- logically mapped low-angle normal faults dipping to the east developed between the basic rocks intruding the AIP and e). felsic pluton farther east within AS. Large scale igneous activity followed by intense deformation affecting AIP clearly owes their origin to the rifting architecture of the AS at the Red Sea extensional margin. Keywords: Shield-margin Mafic Crust; Asir Igneous Province; Seismic Moho; 2D Gravity Crustal Model; Red Sea Extensional Margin 1. Introduction Configuration and the overall mass distribution both in crust as well as in top most part of upper mantle below the AS and Red Sea coastal plains are of much geody- namic significance from the viewpoint of effects due to Red Sea spreading. Saudi Arabia has an area of about 2.25 million km2, out of which, igneous and metamor- phic rocks cover nearly 1/3 of it. These rocks are exposed in the west, north-west and south-west. The AS is narrow in the north (50 - 100 km), widening to about 200 km in the south; but it is widest at its middle (about 700 km). The present study area focuses on this middle part corre- sponding to the AIP [1] (Figure 1). The AS is nearly 2000 km long, it has an average elevation of 1500 m and a crustal thickness of approximately 42 km (refer below). Between the AM and the Red Sea coast, the narrow but elongated coastal plains in southwestern Saudi Arabia is formally known as “Tihamat-Asir’ (TS). TS is about 30 km wide at about 17 degrees latitude in the present study area where its average elevation is less than 100 m but the topography rises sharply eastward to about 600 m at the foothills across the pediment of the Asir; further inland the shield margin crust is elevated to 3.5 - 4 km across the HAE. Average distance of HAE from the Red Sea axial trough is 250 km, while, HAE locates inland at about 115 km from the coast. Rift-related extensional deformation extends for nearly 150 km inland from the coast between 17 °N and 18 °N encompassed within the present study area (Figrue 1). Mainly three contrasting views are advocated in lit- erature on the evolutionary history of the AS: i) Island Arcs theory: The AS developed as a result of collision of more than one Island Arc. These Island Arcs formed in oceanic crust [2,3]. ii) Continental Crust theory: The AS developed as a result from tectonic deformation from magmatic activities [4]. iii) Suture zones and Microplates Copyright © 2013 SciRes. OJG 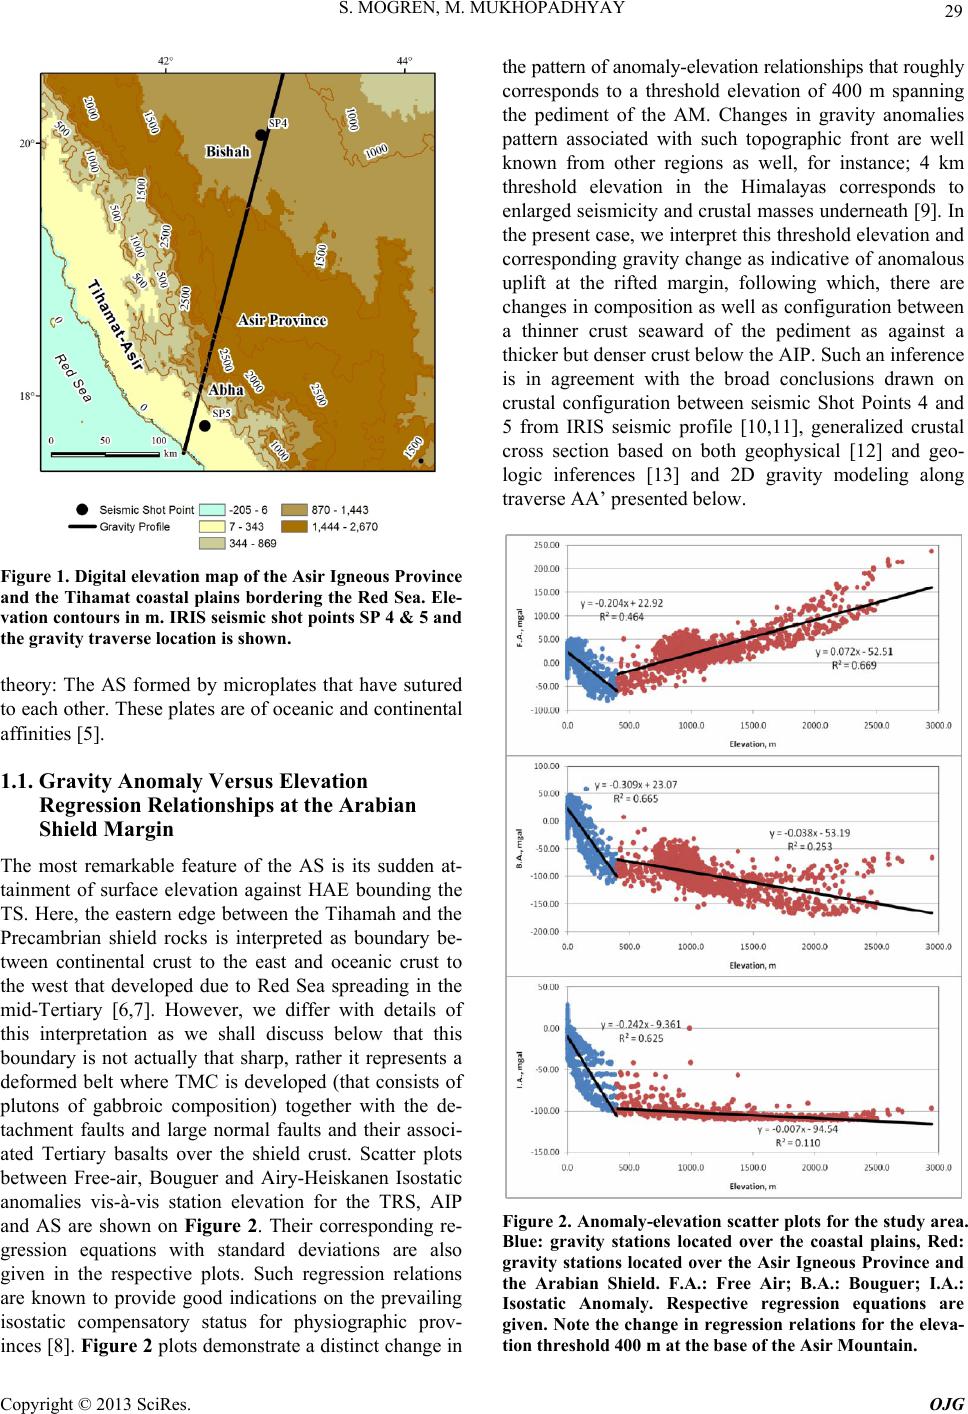 S. MOGREN, M. MUKHOPADHYAY 29 Figure 1. Digital elevation map of the Asir Igneous Province and the Tihamat coastal plains bordering the Red Sea. Ele- vation contours in m. IRIS seismic shot points SP 4 & 5 and the gravity traverse location is shown. theory: The AS formed by microplates that have sutured to each other. These plates are of oceanic and continental affinities [5]. 1.1. Gravity Anomaly Versus Elevation Regression Relationships at the Arabian Shield Margin The most remarkable feature of the AS is its sudden at- tainment of surface elevation against HAE bounding the TS. Here, the eastern edge between the Tihamah and the Precambrian shield rocks is interpreted as boundary be- tween continental crust to the east and oceanic crust to the west that developed due to Red Sea spreading in the mid-Tertiary [6,7]. However, we differ with details of this interpretation as we shall discuss below that this boundary is not actually that sharp, rather it represents a deformed belt where TMC is developed (that consists of plutons of gabbroic composition) together with the de- tachment faults and large normal faults and their associ- ated Tertiary basalts over the shield crust. Scatter plots between Free-air, Bouguer and Airy-Heiskanen Isostatic anomalies vis-à-vis station elevation for the TRS, AIP and AS are shown on Figure 2. Their corresponding re- gression equations with standard deviations are also given in the respective plots. Such regression relations are known to provide good indications on the prevailing isostatic compensatory status for physiographic prov- inces [8]. Figure 2 plots demonstrate a distinct change in the pattern of anomaly-elevation relationships that roughly corresponds to a threshold elevation of 400 m spanning the pediment of the AM. Changes in gravity anomalies pattern associated with such topographic front are well known from other regions as well, for instance; 4 km threshold elevation in the Himalayas corresponds to enlarged seismicity and crustal masses underneath [9]. In the present case, we interpret this threshold elevation and corresponding gravity change as indicative of anomalous uplift at the rifted margin, following which, there are changes in composition as well as configuration between a thinner crust seaward of the pediment as against a thicker but denser crust below the AIP. Such an inference is in agreement with the broad conclusions drawn on crustal configuration between seismic Shot Points 4 and 5 from IRIS seismic profile [10,11], generalized crustal cross section based on both geophysical [12] and geo- logic inferences [13] and 2D gravity modeling along traverse AA’ presented below. Figure 2. Anomaly-elevation scatter plots for the study area. Blue: gravity stations located over the coastal plains, Red: gravity stations located over the Asir Igneous Province and the Arabian Shield. F.A.: Free Air; B.A.: Bouguer; I.A.: Isostatic Anomaly. Respective regression equations are given. Note the change in regression relations for the eleva- tion threshold 400 m at the base of the Asir Mountain. Copyright © 2013 SciRes. OJG 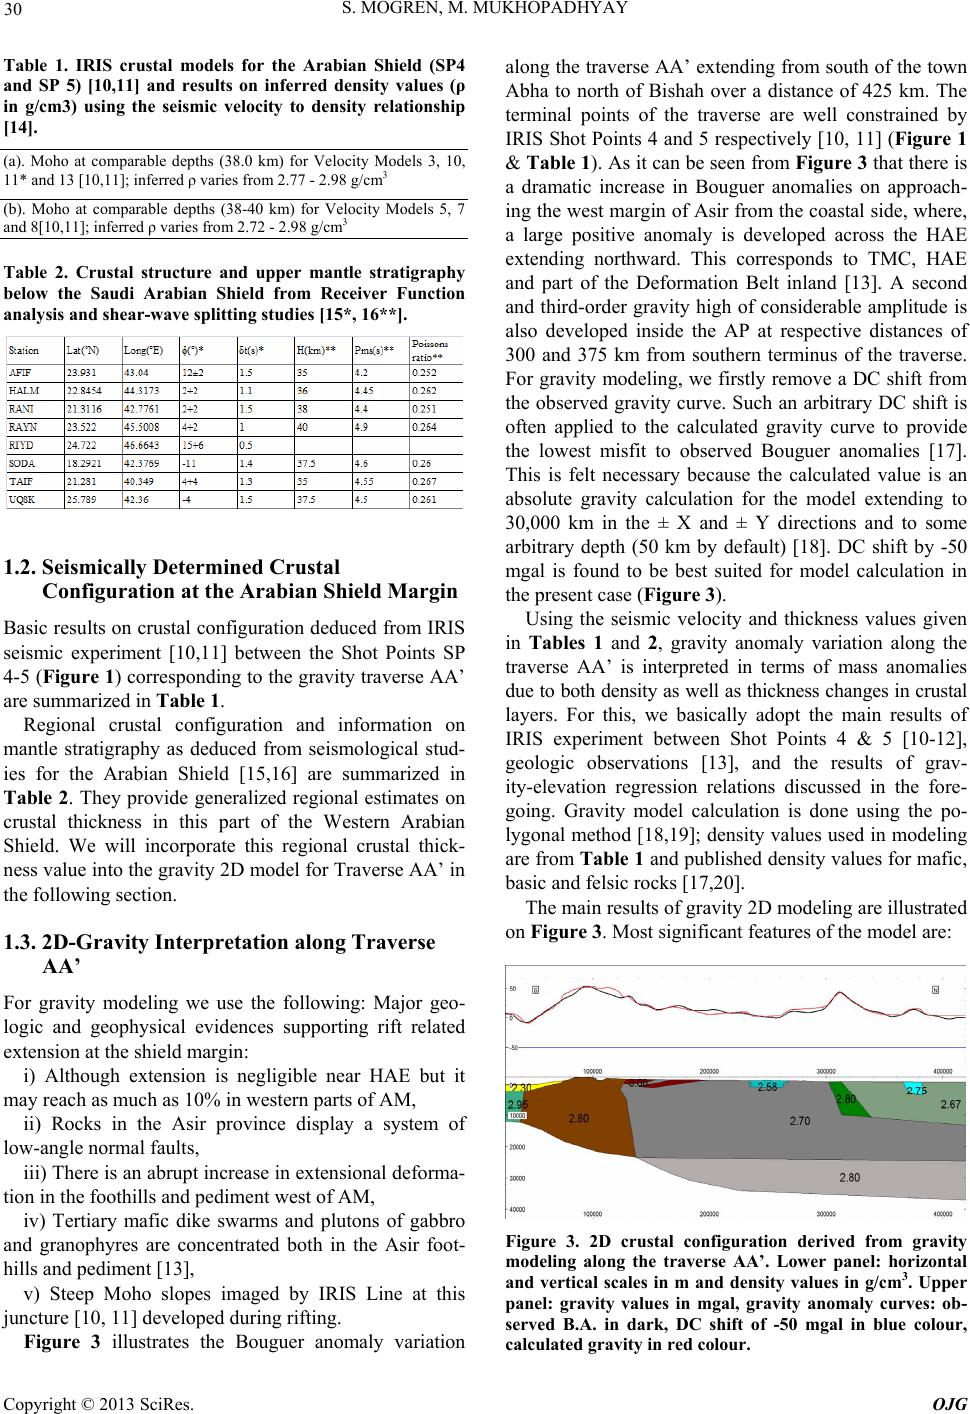 S. MOGREN, M. MUKHOPADHYAY 30 Table 1. IRIS crustal models for the Arabian Shield (SP4 and SP 5) [10,11] and results on inferred density values (ρ in g/cm3) using the seismic velocity to density relationship [14]. (a). Moho at comparable depths (38.0 km) for Velocity Models 3, 10, 11* and 13 [10,11]; inferred ρ varies from 2.77 - 2.98 g/cm3 (b). Moho at comparable depths (38-40 km) for Velocity Models 5, 7 and 8[10,11]; inferred ρ varies from 2.72 - 2.98 g/cm3 Table 2. Crustal structure and upper mantle stratigraphy below the Saudi Arabian Shield from Receiver Function analysis and shear-wave splitting studies [15*, 16**]. 1.2. Seismically Determined Crustal Configuration at the Arabian Shield Margin Basic results on crustal configuration deduced from IRIS seismic experiment [10,11] between the Shot Points SP 4-5 (Figure 1) corresponding to the gravity traverse AA’ are summarized in Table 1. Regional crustal configuration and information on mantle stratigraphy as deduced from seismological stud- ies for the Arabian Shield [15,16] are summarized in Table 2. They provide generalized regional estimates on crustal thickness in this part of the Western Arabian Shield. We will incorporate this regional crustal thick- ness value into the gravity 2D model for Traverse AA’ in the following section. 1.3. 2D-Gravity Interpretation along Traverse AA’ For gravity modeling we use the following: Major geo- logic and geophysical evidences supporting rift related extension at the shield margin: i) Although extension is negligible near HAE but it may reach as much as 10% in western parts of AM, ii) Rocks in the Asir province display a system of low-angle normal faults, iii) There is an abrupt increase in extensional deforma- tion in the foothills and pediment west of AM, iv) Tertiary mafic dike swarms and plutons of gabbro and granophyres are concentrated both in the Asir foot- hills and pediment [13], v) Steep Moho slopes imaged by IRIS Line at this juncture [10, 11] developed during rifting. Figure 3 illustrates the Bouguer anomaly variation along the traverse AA’ extending from south of the town Abha to north of Bishah over a distance of 425 km. The terminal points of the traverse are well constrained by IRIS Shot Points 4 and 5 respectively [10, 11] (Figure 1 & Table 1). As it can be seen from Figure 3 that there is a dramatic increase in Bouguer anomalies on approach- ing the west margin of Asir from the coastal side, where, a large positive anomaly is developed across the HAE extending northward. This corresponds to TMC, HAE and part of the Deformation Belt inland [13]. A second and third-order gravity high of considerable amplitude is also developed inside the AP at respective distances of 300 and 375 km from southern terminus of the traverse. For gravity modeling, we firstly remove a DC shift from the observed gravity curve. Such an arbitrary DC shift is often applied to the calculated gravity curve to provide the lowest misfit to observed Bouguer anomalies [17]. This is felt necessary because the calculated value is an absolute gravity calculation for the model extending to 30,000 km in the ± X and ± Y directions and to some arbitrary depth (50 km by default) [18]. DC shift by -50 mgal is found to be best suited for model calculation in the present case (Figure 3). Using the seismic velocity and thickness values given in Tables 1 and 2, gravity anomaly variation along the traverse AA’ is interpreted in terms of mass anomalies due to both density as well as thickness changes in crustal layers. For this, we basically adopt the main results of IRIS experiment between Shot Points 4 & 5 [10-12], geologic observations [13], and the results of grav- ity-elevation regression relations discussed in the fore- going. Gravity model calculation is done using the po- lygonal method [18,19]; density values used in modeling are from Table 1 and published density values for mafic, basic and felsic rocks [17,20]. The main results of gravity 2D modeling are illustrated on Figure 3. Most significant features of the model are: Figure 3. 2D crustal configuration derived from gravity modeling along the traverse AA’. Lower panel: horizontal and vertical scales in m and density values in g/cm3. Upper panel: gravity values in mgal, gravity anomaly curves: ob- served B.A. in dark, DC shift of -50 mgal in blue colour, calculated gravity in red colour. Copyright © 2013 SciRes. OJG  S. MOGREN, M. MUKHOPADHYAY 31 i) There is a massive change in crustal configuration from the coastal to the interior of the Arabian Shield. A two-layered crust below the AP extending down to about 38 km depth, segregated between largely metamorphosed upper crust from a more mafic lower crust, The Asir crust is assumed to transit across the HAE towards Abha -- finally meeting the largely mafic crust underlying the Tihamat coastal plains; the latter is covered by Neo- gene-Quaternary sediments. We interpret this mafic crust as the very primary oceanic crust formed at the conti- nental margin due to Red Sea spreading. The transitional crust is of average density ρ = 2.8 g/cm3, its lower edge coincides with the Moho boundary that extends from 12 - 22 km depth. It is having a median width of 115 km. By definition, this rather-wide transition zone represents the initial areas of crustal stretching at the Arabian Shield margin. ii) There are strong density heterogeneities in the up- per crust in AP: this is broadly divisible into a denser (ρ = 2.7 g/cm3) block in western part of Asir as compared to a less dense top crust (ρ = 2.67 g/cm3) in more eastern areas. Metamorphosed basalts and altered mafic rocks are mapped in large terrenes in AP. Two such large bod- ies, of assumed density ρ = 3.0 g/cm3 are modeled be- tween 125 - 185 km distance from southern end of the traverse. Inferred density for the upper crust is likely to represent rocks of greenschist facies [12]. The denser upper crust extends to about 22 km depth, where, it cor- responds to a horizontal velocity discontinuity of 6.4 - 6.5 km/s, mapped below most areas of the Arabian shield [10,11]. iii) Gravity model infers a dipping but laterally exten- sive lower rock layer, of density ρ = 2.8 g/cm3, between 22 - 38 km depth below the thinned continental crust of AP. This inferred density is practically the same as that derived for TMC. Gravity interpretation however cannot decide whether the geometric configuration of the layer or its inferred rock density represents the lower conti- nental crust or it as an area of thick magmatic under- plating under a thinned-out continental crust below the AP. Joint interpretation of seismic reflection and gravity data are required for the purpose; refer the studies on the Gabon Margin [21]. iv) The other two prominent gravity highs along the traverse, at respective distances of 300 and 375 km from its southern end, located within the AP are interpreted due to basic rocks intruded in top crust. A felsic pluton, of density ρ = 2.58 g/cm3, explains a localized gravity low at 240 - 260 km distance along the traverse. 2. Discussion An analysis of gravity anomalies and corresponding ele- vation values at the margin of the AM suggests that there is a significant change in their regression relationship at about 400 m elevation. This threshold elevation is taken here as an indicator for changes in subsurface mass dis- tribution and crustal thickness variation between the coastal plains towards the AM across its foothills and pediment. This area also roughly corresponds to current seismicity evidenced from instrumental records. Such an inference is conceptually similar to what is known from the Himalayas [8,9]. Gravity anomaly variation along a 425 km long traverse extending from the Red Sea coastal plains to the AM across the HAE is taken up for gravity interpretation study with an objective to investigate the nature of the boundary crust between the Asir Province and the Tihamat coastal plains. Gravity model presented here is reasonably well constrained by results from the IRIS Deep Refraction profile, in particular, by the two seismic shot points located at the terminal points of the gravity traverse near the towns Ad-Darb south of Abha and Bishah on the north. The town Abha locates at the edge of HAE. Results of gravity model provide some basic insight into the mass distribution and crustal con- figuration and their significant changes across this tec- tonically interesting region. Major findings being: a) the west margin of the Asir represents the zone of crustal transition between a typical continental crust below the Asir vis-à-vis a typical mafic crust below the coastal plains. The rugged topography on the surface of the tran- sition is an outcome of extension of the continental crust and its intense deformation at the Red Sea margin. This zone of crustal transition is rather wide, which contra- dicts a popular view that transition is sharp here. Transi- tional crust is denser than the adjacent continental crust by about 0.1 g/cm3; thus favoring its mafic composition. This mafic crust developed in mid-Tertiary due to the stretching episodes at the Arabian shield margin. b). There are massive changes in crustal configuration be- tween the coastal plains to the shield interior across the HAE. Highly stretched continental crust below western parts of the Asir is modeled to be somewhat denser than typical continental crust farther to the east. This denser crust constitutes large proportions of metamorphosed basalts and altered mafic rocks. This crust is probably elevated to greenschist facies during the rifting process. c). Strong density heterogeneities in top crust below the AP are inferred by gravity model. Typical extensional features of the stretched Asir crust are presented in the gravity model and their geodynamic significance is also briefly reviewed in the foregoing section. d). An impor- tant finding from gravity modeling is that the laterally extensive rock layer below the upper crust of the Shield is of similar density as that of the TMC at the transition zone. Gravity model alone cannot distinguish whether this layer represents the normal continental crust ‘sensu stricto’ or it developed in consequence to magmatic un- derplating below the thinned continental crust due to Red Copyright © 2013 SciRes. OJG 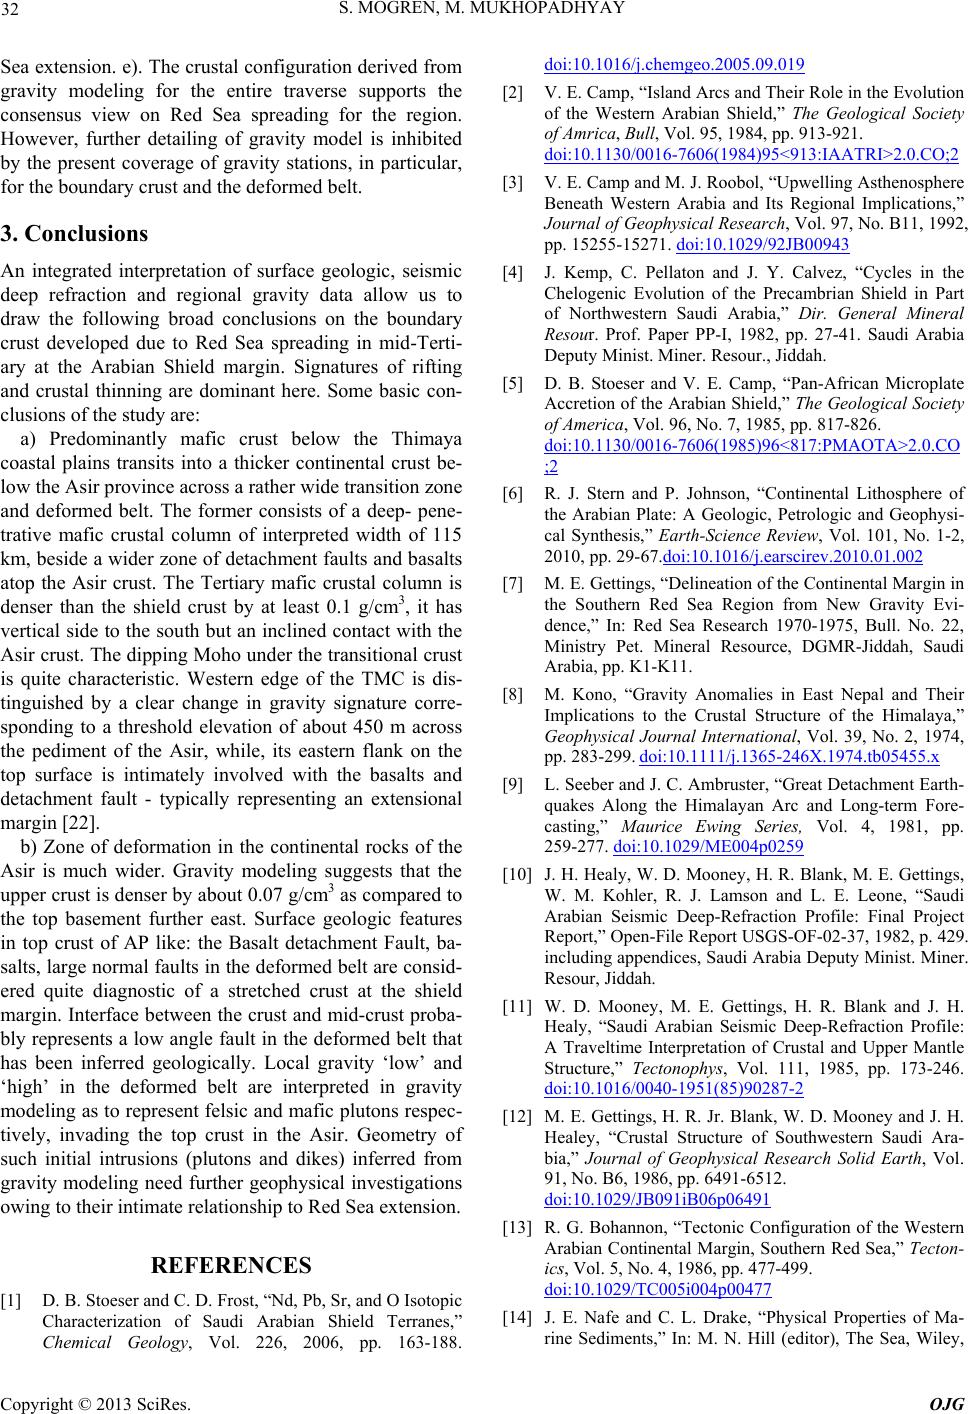 S. MOGREN, M. MUKHOPADHYAY 32 Sea extension. e). The crustal configuration derived from gravity modeling for the entire traverse supports the consensus view on Red Sea spreading for the region. However, further detailing of gravity model is inhibited by the present coverage of gravity stations, in particular, for the boundary crust and the deformed belt. 3. Conclusions An integrated interpretation of surface geologic, seismic deep refraction and regional gravity data allow us to draw the following broad conclusions on the boundary crust developed due to Red Sea spreading in mid-Terti- ary at the Arabian Shield margin. Signatures of rifting and crustal thinning are dominant here. Some basic con- clusions of the study are: a) Predominantly mafic crust below the Thimaya coastal plains transits into a thicker continental crust be- low the Asir province across a rather wide transition zone and deformed belt. The former consists of a deep- pene- trative mafic crustal column of interpreted width of 115 km, beside a wider zone of detachment faults and basalts atop the Asir crust. The Tertiary mafic crustal column is denser than the shield crust by at least 0.1 g/cm3, it has vertical side to the south but an inclined contact with the Asir crust. The dipping Moho under the transitional crust is quite characteristic. Western edge of the TMC is dis- tinguished by a clear change in gravity signature corre- sponding to a threshold elevation of about 450 m across the pediment of the Asir, while, its eastern flank on the top surface is intimately involved with the basalts and detachment fault - typically representing an extensional margin [22]. b) Zone of deformation in the continental rocks of the Asir is much wider. Gravity modeling suggests that the upper crust is denser by about 0.07 g/cm3 as compared to the top basement further east. Surface geologic features in top crust of AP like: the Basalt detachment Fault, ba- salts, large normal faults in the deformed belt are consid- ered quite diagnostic of a stretched crust at the shield margin. Interface between the crust and mid-crust proba- bly represents a low angle fault in the deformed belt that has been inferred geologically. Local gravity ‘low’ and ‘high’ in the deformed belt are interpreted in gravity modeling as to represent felsic and mafic plutons respec- tively, invading the top crust in the Asir. Geometry of such initial intrusions (plutons and dikes) inferred from gravity modeling need further geophysical investigations owing to their intimate relationship to Red Sea extension. REFERENCES [1] D. B. Stoeser and C. D. Frost, “Nd, Pb, Sr, and O Isotopic Characterization of Saudi Arabian Shield Terranes,” Chemical Geology, Vol. 226, 2006, pp. 163-188. doi:10.1016/j.chemgeo.2005.09.019 [2] V. E. Camp, “Island Arcs and Their Role in the Evolution of the Western Arabian Shield,” The Geological Society of Amrica, Bull, Vol. 95, 1984, pp. 913-921. doi:10.1130/0016-7606(1984)95<913:IAATRI>2.0.CO;2 [3] V. E. Camp and M. J. Roobol, “Upwelling Asthenosphere Beneath Western Arabia and Its Regional Implications,” Journal of Geophysical Research, Vol. 97, No. B11, 1992, pp. 15255-15271. doi:10.1029/92JB00943 [4] J. Kemp, C. Pellaton and J. Y. Calvez, “Cycles in the Chelogenic Evolution of the Precambrian Shield in Part of Northwestern Saudi Arabia,” Dir. General Mineral Resour. Prof. Paper PP-I, 1982, pp. 27-41. Saudi Arabia Deputy Minist. Miner. Resour., Jiddah. [5] D. B. Stoeser and V. E. Camp, “Pan-African Microplate Accretion of the Arabian Shield,” The Geological Society of America, Vol. 96, No. 7, 1985, pp. 817-826. doi:10.1130/0016-7606(1985)96<817:PMAOTA>2.0.CO ;2 [6] R. J. Stern and P. Johnson, “Continental Lithosphere of the Arabian Plate: A Geologic, Petrologic and Geophysi- cal Synthesis,” Earth-Science Review, Vol. 101, No. 1-2, 2010, pp. 29-67.doi:10.1016/j.earscirev.2010.01.002 [7] M. E. Gettings, “Delineation of the Continental Margin in the Southern Red Sea Region from New Gravity Evi- dence,” In: Red Sea Research 1970-1975, Bull. No. 22, Ministry Pet. Mineral Resource, DGMR-Jiddah, Saudi Arabia, pp. K1-K11. [8] M. Kono, “Gravity Anomalies in East Nepal and Their Implications to the Crustal Structure of the Himalaya,” Geophysical Journal International, Vol. 39, No. 2, 1974, pp. 283-299. doi:10.1111/j.1365-246X.1974.tb05455.x [9] L. Seeber and J. C. Ambruster, “Great Detachment Earth- quakes Along the Himalayan Arc and Long-term Fore- casting,” Maurice Ewing Series, Vol. 4, 1981, pp. 259-277. doi:10.1029/ME004p0259 [10] J. H. Healy, W. D. Mooney, H. R. Blank, M. E. Gettings, W. M. Kohler, R. J. Lamson and L. E. Leone, “Saudi Arabian Seismic Deep-Refraction Profile: Final Project Report,” Open-File Report USGS-OF-02-37, 1982, p. 429. including appendices, Saudi Arabia Deputy Minist. Miner. Resour, Jiddah. [11] W. D. Mooney, M. E. Gettings, H. R. Blank and J. H. Healy, “Saudi Arabian Seismic Deep-Refraction Profile: A Traveltime Interpretation of Crustal and Upper Mantle Structure,” Tectonophys, Vol. 111, 1985, pp. 173-246. doi:10.1016/0040-1951(85)90287-2 [12] M. E. Gettings, H. R. Jr. Blank, W. D. Mooney and J. H. Healey, “Crustal Structure of Southwestern Saudi Ara- bia,” Journal of Geophysical Research Solid Earth, Vol. 91, No. B6, 1986, pp. 6491-6512. doi:10.1029/JB091iB06p06491 [13] R. G. Bohannon, “Tectonic Configuration of the Western Arabian Continental Margin, Southern Red Sea,” Tecton- ics, Vol. 5, No. 4, 1986, pp. 477-499. doi:10.1029/TC005i004p00477 [14] J. E. Nafe and C. L. Drake, “Physical Properties of Ma- rine Sediments,” In: M. N. Hill (editor), The Sea, Wiley, Copyright © 2013 SciRes. OJG  S. MOGREN, M. MUKHOPADHYAY Copyright © 2013 SciRes. OJG 33 N. Y., Vol. 3, 1963, pp. 794-815. [15] C. J. Wolfe, F. Vernon and A. Al-Amri, “Shear-Wave Splitting Across Western Saudi Arabia: The Pattern of Upper Mantle Anisotropy at a Proterozoic Shield,” Geo- physical Research Letters, Vol. 26, No. 6, 1999, pp. 779-782. doi:10.1029/1999GL900056 [16] M. R. Kumar, D. S. Ramesh, J. Saul, D. Sarkar and R. Kind, “Crustal Structure and Upper Mantle Stratigraphy of the Arabian Shield,” Geophysical Research Letters, Vol. 29, No. 8, 2002, pp. 831-834. doi:10.1029/2001GL014530 [17] A. R. A. Aitken, P. G. Betts, R. F. Weinberg and D. Gray, “Constrained Potential Field Modeling of the Crustal Ar- chitecture of the Musgrave Province in Central Australia: Evidence for Lithospheric Strengthening Due to Crust-Mantle Boundary Uplift,” Journal of Geophysical Research, Vol. 114, No. B12, 2009. doi:0.1029/2008JB006194 [18] GEOSOFT 2012, “Oasis Montaj How - To Guide Apply a DC Shift in GM-SYS Profile,” www.geosoft.com [19] M. Talwani, J. L. Worzel and M. Landisman,” Rapid Gravity Computations for Two-Dimensional Bodies with Application to Mendocino Submarine Fracture Zone,” Journal of Geophysical Research, Vol. 64, No. 1, 1959, pp. 49-59. doi:10.1029/JZ064i001p00049 [20] C. Subrahmanyam and R. K. Verma, “Densities and Mag- netic Susceptibilities of Precambrian Rocks of Different Metamorphic Grade (southern Indian shield),” Journal of Geophysical Research, Vol. 49, 1981, pp.101-107. [21] S. Dupre’, S. Cloetingh and G. Bertotti, “Structure of the Gabon Margin from Integrated Seismic Reflection and Gravity Data,” Tectonophys, Vol. 506, No. 1- 4, 2011, pp. 31-45. doi:10.1016/j.tecto.2011.04.009 [22] G. S. Lister, M. A. Etheridge and P. A. Symonds, “De- tachment Faulting and the Evolution of Passive Conti- nental Margins,” Geology, Vol. 14, 1986, pp. 246-250. doi:10.1130/0091-7613(1986)14<246:DFATEO>2.0.CO; 2 |