

Paper Menu >>
Journal Menu >>
 Journal of Surface Engineered Materials and Advanced Technology, 2013, 3, 36-42 http://dx.doi.org/10.4236/jsemat.2013.34A1005 Published Online October 2013 (http://www.scirp.org/journal/jsemat) Copyright © 2013 SciRes. JSEMAT Interaction between Peptide Pheromone or Its Truncated Derivatives and Pheromone Receptor of the Fission Yeast Schizosaccharomyces pombe Examined by a Force Spectroscopy Study and a GFP Reporter Assay Sho Hidaka1, Osamu Nikaido1, Shoichi Kiyosaki1, Atsushi Ikai2, Toshiya Osada1 1Department of Life Science, Graduate School of Bioscience and Biotechnology, Tokyo Institute of Technology, Yokohama, Japan; 2Innovation Laboratory, Tokyo Institute of Technology, Yokohama, Japan. Email: [email protected] Received June 17th, 2013; revised July 25th, 2013; accepted August 3rd, 2013 Copyright © 2013 Sho Hidaka et al. This is an open access article distributed under the Creative Commons Attribution License, which permits unrestricted use, distribution, and reproduction in any medium, provided the original work is properly cited. ABSTRACT In our previous study, the specific interaction between P-factor, a peptide pheromone and its receptor, Mam2, on the cell surface of the fission yeast Schizosaccharomyces pombe was investigated by two methods, an atomic force micro- scope (AFM) and a GFP reporter assay. The removal of Leu at C-terminal of P-factor resulted in an inactivation of P-factor function to bind Mam2 and induce the signal transduction pathway. Here, we used truncated P-factor deriva- tives lacking N-terminal of P-factor (P12 ~ P22: 12 ~ 22 amino acid residues from C-terminal) as ligands for Mam2. From the dose-dependent analysis of the GFP reporter assay ranging from 1 nM to 100 µM of the peptide concentration, the peptides can be classified into three groups based on EC50 and maximal GFP production level, group1 (P-factor), group2 (P17 ~ P22), and group3 (P12 ~ P16). At 0.1 µM, only P-factor induced the signal transduction pathway. At 1 µM, peptides from group2 partially induced the pathway and peptides from group3 induced the pathway a little. At 10 µM, all peptides induced the pathway mostly depending on the length of peptides. We also performed AFM experi- ments using P-factor and peptides from group3 to investigate the interaction between the peptides and Mam2 for com- parison between the two methods. Keywords: GPCR; Mam2; Pheromone; GFP; AFM; Yeast 1. Introduction G-protein-coupled receptors (GPCRs) are integral mem- brane proteins characterized by seven transmembrane helices and constitute a large family of transmembrane proteins. They play an important role in transducing cell signals by binding to extracellular substances, which invoke alterations of cell physiology. Peculiarly, GPCRs receive considerable attention in drug research, as ap- proximately 70% of medication under development and more than half of drugs currently on the market targeting these proteins [1-3]. The fission yeast Schizosaccharomyces pombe (S. Pombe) is a popular model organism as a host system for analyzing heterogenous GPCR due to ease in handling of transgenesis and culture [4-7]. S. pombe multiplies in the haploid state. This organism has a two-haploid mating type, h+ (P) and h− (M) [8]. These cells initiate sexual development when they are starved for nutrients. Under nutrition depletion, the cells cease to be divided with the cAMP cascade and conjugate with cells of the opposite mating type to form diploid zygotes. Diffusible phero- mones are involved in the conjugating process. h+ cells secrete P-factor, which bind to the P-factor receptor Mam2 on the surface of h− cells, whereas h− cells se- crete M-factor, which bind to the M-factor receptor Map3 on the surface of h+ cells. The binding of the pher- omones to their receptors activates the pheromone re- sponse pathway [9-13]. The active receptors induce Gα subunit Gpa1 to facilitate a GDP-to-GTP exchange factor and the dissociation of Gα from the G protein complex. The Gα subunit with GTP then interacts with downstream effectors [14-17]. The Gα subunit with GTP then interacts with downstream effectors to engage signaling cascades including the MAP kinase pathway consisting of Byr2,  Interaction between Peptide Pheromone or Its Truncated Derivatives and Pheromone Receptor of the Fission Yeast Schizosaccharomyces pombe Examined by a Force Spectroscopy Study and a GFP Reporter Assay Copyright © 2013 SciRes. JSEMAT 37 Byr1, Spk1 etc. [18] Since its invention by Binnig et al. [19], the atomic force microscope (AFM) has become a powerful tool to study biological samples for measuring interaction between biomolecules. The AFM tip makes contact with the cell surface, allowing binding between ligand and receptor. The tip retraction then induces stretching of the complex molecules followed by forced dissociation of the complex. This technique has already permitted us to quantify unbinding forces of numerous ligand-receptor pairs, either on an artificial surface or on the surface of living cells [20-27]. In our previous paper, we revealed that P-factor lack- ing C-terminal Leu had no ability to bind Mam2 or in- duce the signal transduction pathway using AFM and the reporter assay. In this study, we investigated the interaction between the series of N-terminal truncated P-factors and Mam2 with the same two methods [28]. Our study showed that peptides were able to be divided into three groups based on EC50 and maximal GFP production level with the reporter assay. Although some peptides from group3 were able to induce the signal transduction pathway only at high concentration, the distribution pattern of force curve histogram of group3 peptides from the AFM study was very similar to that of P-factor. For the evaluation of the interaction between receptors and ligands, we found that the result of the AFM experiment was not always in agreement with that of the GFP assay. 2. Materials and Methods 2.1. Peptides Peptides used in this study are listed in Table 1. The customized peptides were obtained from Operon Co. Ltd. (Tokyo, Japan). Each peptide was prepared as a stock solution of 1 mM in Milli-Q water and stored at −80˚C. 2.2. GFP Reporter Assay for Mam2 Signaling Reporter strains which were previously designed in our laboratory were grown in YES10 media at 32˚C for 24 - 36 h and were inoculated into 5 mL of the fresh YES10 media [28]. Then the cells were grown at 30˚C for 18 h and harvested. After having been washed twice with ster- ile water, cells were transferred to YCB media at OD600 of 1.0 for nitrogen starvation. The cells were incubated at 30˚C for 2 h and used for AFM study and Mam2 signal- ing assay. For the signaling assay, 1 mL aliquots of cells were transferred to 24-well microplate containing 1 μL of peptide solution (final concentration of 0.001, 0.01, 0.1, 1, 3.1, 10, 31, 100 μM each). After incubation at 30˚C for 20 h, the cells were washed three times with PBS and resuspended in the same volume of PBS. Fluorescence Table 1. List of peptides used in this study. Peptides Sequences P-factor TYADFLRAYQSWNTFVNPDRPNL P22 YADFLRAYQSWNTFVNPDRPNL P21 ADFLRAYQSWNTFVNPDRPNL P20 DFLRAYQSWNTFVNPDRPNL P19 FLRAYQSWNTFVNPDRPNL P18 LRAYQSWNTFVNPDRPNL P17 RAYQSWNTFVNPDRPNL P16 AYQSWNTFVNPDRPNL P15 YQSWNTFVNPDRPNL P14 QSWNTFVNPDRPNL P13 SWNTFVNPDRPNL P12 WNTFVNPDRPNL Cys-P-factor CTYADFLRAYQSWNTFVNPDRPNL Cys-P15 CYQSWNTFVNPDRPNL Cys-P14 CQSWNTFVNPDRPNL Cys-P13 CSWNTFVNPDRPNL Cys-P12 CWNTFVNPDRPNL intensity of GFP was measured by a fluorescence spec- trophotometer (Hitachi F-3010, Japan). The cells expressing GFP were excited at 491 nm, and fluorescence emission was detected at 515 nm. 2.3. AFM Measurement AFM tip preparation was done in the same manner as described previously [28]. The addition of cysteine at N-terminal of P-factor and P12 ~ P15 was carried out for the AFM tip preparation. Force measurements were car- ried out at room temperature with an NVB-100 AFM (Olympus, Inc., Tokyo, Japan), which was set on an in- verted optical microscope (IX70, Olympus, Inc., Tokyo, Japan) [29,30]. The modified AFM tips were placed on the nitrogen starved cell surface, and force curve meas- urements were executed on different positions with a scan speed of around 1.74 μm/s and using a relative trig- ger of 20 - 40 nm on the cantilever deflection. The force curves from about 1024 positions (32 × 32) were re- corded in each experimental condition to make a histo- gram of the rupture force in force curves. In the inhibi- tion experiments, the force measurements were per- formed in an experimental buffer with free P-factor (final concentration of 1 μM). To calibrate the response of the cantilever deflection signal as a function of piezoelectrics, 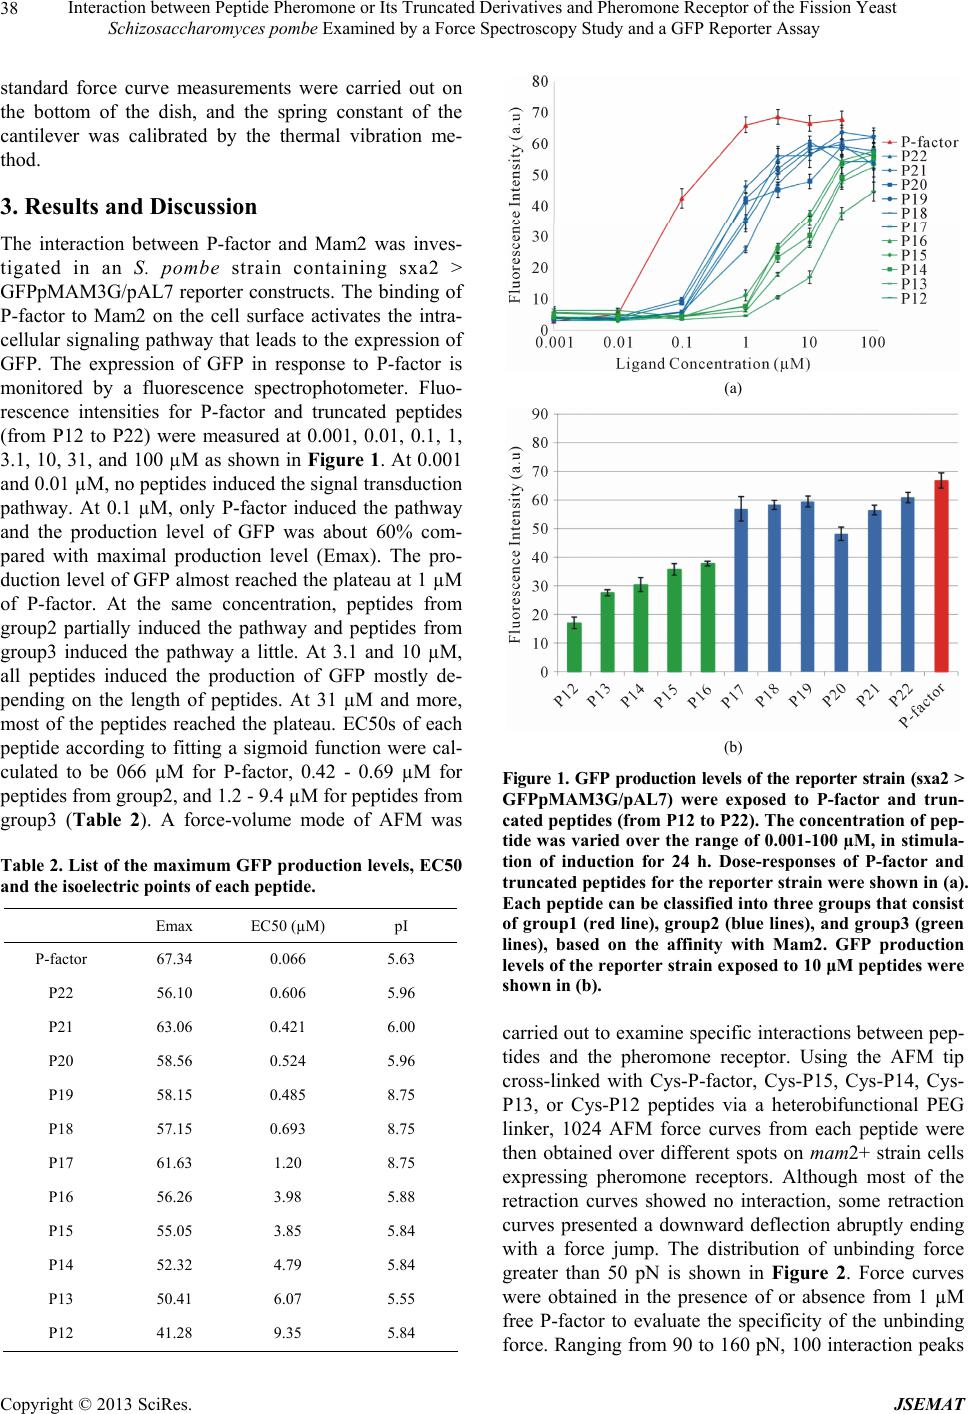 Interaction between Peptide Pheromone or Its Truncated Derivatives and Pheromone Receptor of the Fission Yeast Schizosaccharomyces pombe Examined by a Force Spectroscopy Study and a GFP Reporter Assay Copyright © 2013 SciRes. JSEMAT 38 standard force curve measurements were carried out on the bottom of the dish, and the spring constant of the cantilever was calibrated by the thermal vibration me- thod. 3. Results and Discussion The interaction between P-factor and Mam2 was inves- tigated in an S. pombe strain containing sxa2 > GFPpMAM3G/pAL7 reporter constructs. The binding of P-factor to Mam2 on the cell surface activates the intra- cellular signaling pathway that leads to the expression of GFP. The expression of GFP in response to P-factor is monitored by a fluorescence spectrophotometer. Fluo- rescence intensities for P-factor and truncated peptides (from P12 to P22) were measured at 0.001, 0.01, 0.1, 1, 3.1, 10, 31, and 100 µM as shown in Figure 1. At 0.001 and 0.01 µM, no peptides induced the signal transduction pathway. At 0.1 µM, only P-factor induced the pathway and the production level of GFP was about 60% com- pared with maximal production level (Emax). The pro- duction level of GFP almost reached the plateau at 1 µM of P-factor. At the same concentration, peptides from group2 partially induced the pathway and peptides from group3 induced the pathway a little. At 3.1 and 10 µM, all peptides induced the production of GFP mostly de- pending on the length of peptides. At 31 µM and more, most of the peptides reached the plateau. EC50s of each peptide according to fitting a sigmoid function were cal- culated to be 066 µM for P-factor, 0.42 - 0.69 µM for peptides from group2, and 1.2 - 9.4 µM for peptides from group3 (Table 2). A force-volume mode of AFM was Table 2. List of the maximum GFP production levels, EC50 and the isoelectric points of each peptide. Emax EC50 (µM) pI P-factor 67.34 0.066 5.63 P22 56.10 0.606 5.96 P21 63.06 0.421 6.00 P20 58.56 0.524 5.96 P19 58.15 0.485 8.75 P18 57.15 0.693 8.75 P17 61.63 1.20 8.75 P16 56.26 3.98 5.88 P15 55.05 3.85 5.84 P14 52.32 4.79 5.84 P13 50.41 6.07 5.55 P12 41.28 9.35 5.84 (a) (b) Figure 1. GFP production levels of the reporter strain (sxa2 > GFPpMAM3G/pAL7) were exposed to P-factor and trun- cated peptides (from P12 to P22). The concentration of pep- tide was varied over the range of 0.001-100 µM, in stimula- tion of induction for 24 h. Dose-responses of P-factor and truncated peptides for the reporter strain were shown in (a). Each peptide can be classified into three groups that consist of group1 (red line), group2 (blue lines), and group3 (green lines), based on the affinity with Mam2. GFP production levels of the reporter strain exposed to 10 μM peptides were shown in (b). carried out to examine specific interactions between pep- tides and the pheromone receptor. Using the AFM tip cross-linked with Cys-P-factor, Cys-P15, Cys-P14, Cys- P13, or Cys-P12 peptides via a heterobifunctional PEG linker, 1024 AFM force curves from each peptide were then obtained over different spots on mam2+ strain cells expressing pheromone receptors. Although most of the retraction curves showed no interaction, some retraction curves presented a downward deflection abruptly ending with a force jump. The distribution of unbinding force greater than 50 pN is shown in Figure 2. Force curves were obtained in the presence of or absence from 1 µM free P-factor to evaluate the specificity of the unbinding force. Ranging from 90 to 160 pN, 100 interaction peaks  Interaction between Peptide Pheromone or Its Truncated Derivatives and Pheromone Receptor of the Fission Yeast Schizosaccharomyces pombe Examined by a Force Spectroscopy Study and a GFP Reporter Assay Copyright © 2013 SciRes. JSEMAT 39 Figure 2. Force histogram of unbinding events obtained after analysis of 1024 force curves using the AFM tip cross-linked with Cys-P-factor (a), or Cys-P15 (b) or Cys-P14 (c), or Cys-P13 (d), or Cys-P12 (e) with (red columns) or without (blue col- umns) free 1 µM P-factor. In the presence of or absence from 1 µM free P-factor, the unbinding probability decreased from 9.8% to 4.9% for Cys-P-factor (a), from 10% to 5.2% for Cys-P15 (b), from 9.7% to 4.7% for Cys-P14 (c) from 5.2% to 3.2% for Cys-P13 (d) in the range of 90 to 160 pN. For Cys-P12, the unbinding probabilities were almost the same in the presence of or absence from free P-factor (e). 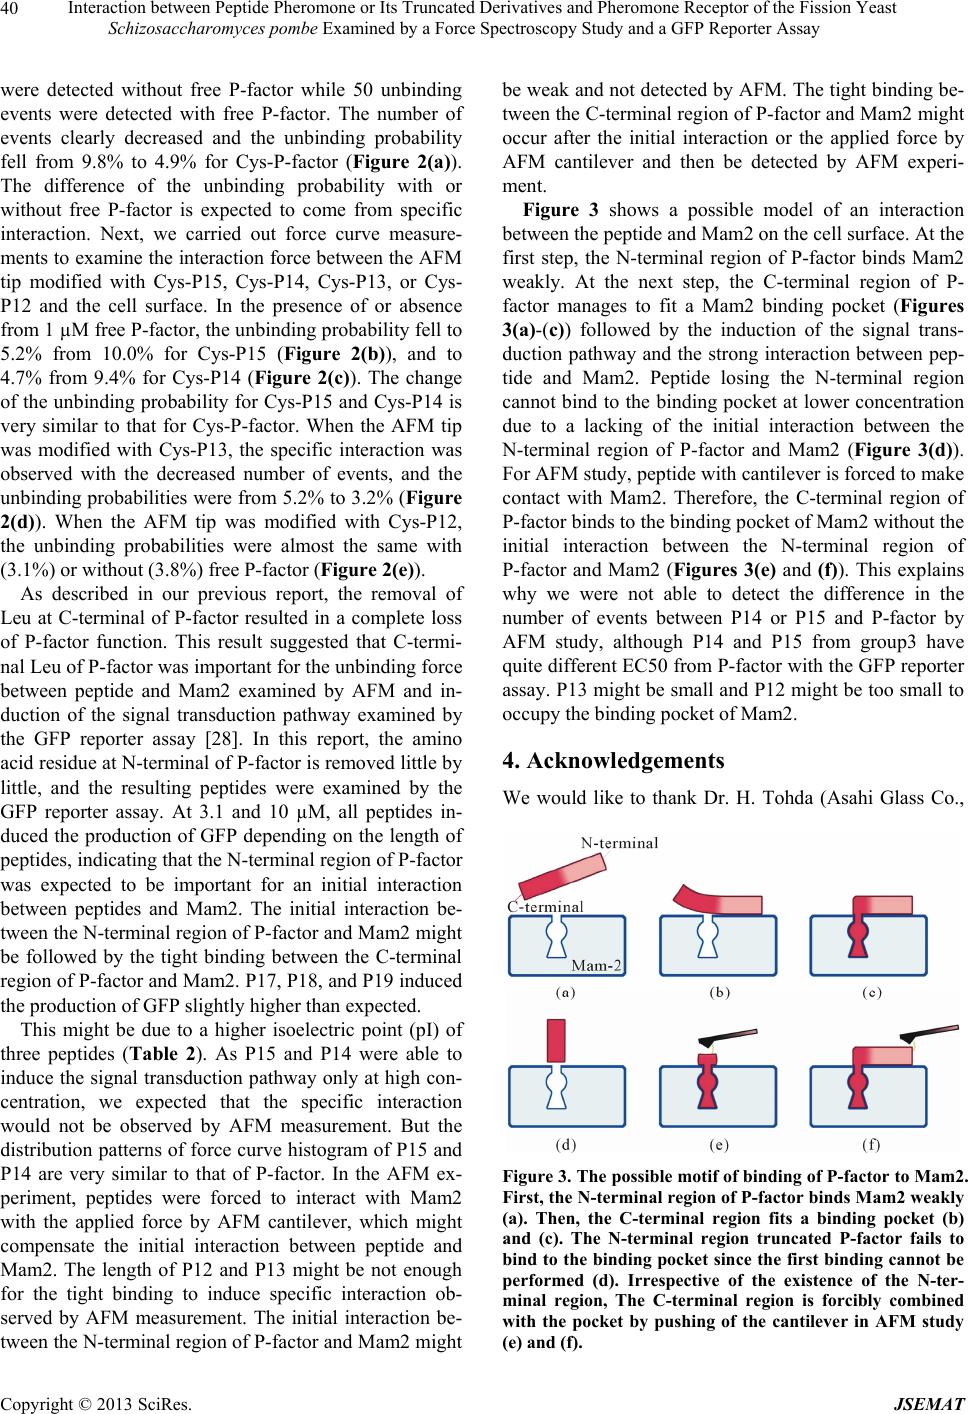 Interaction between Peptide Pheromone or Its Truncated Derivatives and Pheromone Receptor of the Fission Yeast Schizosaccharomyces pombe Examined by a Force Spectroscopy Study and a GFP Reporter Assay Copyright © 2013 SciRes. JSEMAT 40 were detected without free P-factor while 50 unbinding events were detected with free P-factor. The number of events clearly decreased and the unbinding probability fell from 9.8% to 4.9% for Cys-P-factor (Figure 2(a)). The difference of the unbinding probability with or without free P-factor is expected to come from specific interaction. Next, we carried out force curve measure- ments to examine the interaction force between the AFM tip modified with Cys-P15, Cys-P14, Cys-P13, or Cys- P12 and the cell surface. In the presence of or absence from 1 µM free P-factor, the unbinding probability fell to 5.2% from 10.0% for Cys-P15 (Figure 2(b)), and to 4.7% from 9.4% for Cys-P14 (Figure 2(c)). The change of the unbinding probability for Cys-P15 and Cys-P14 is very similar to that for Cys-P-factor. When the AFM tip was modified with Cys-P13, the specific interaction was observed with the decreased number of events, and the unbinding probabilities were from 5.2% to 3.2% (Figure 2(d)). When the AFM tip was modified with Cys-P12, the unbinding probabilities were almost the same with (3.1%) or without (3.8%) free P-factor (Figure 2(e)). As described in our previous report, the removal of Leu at C-terminal of P-factor resulted in a complete loss of P-factor function. This result suggested that C-termi- nal Leu of P-factor was important for the unbinding force between peptide and Mam2 examined by AFM and in- duction of the signal transduction pathway examined by the GFP reporter assay [28]. In this report, the amino acid residue at N-terminal of P-factor is removed little by little, and the resulting peptides were examined by the GFP reporter assay. At 3.1 and 10 µM, all peptides in- duced the production of GFP depending on the length of peptides, indicating that the N-terminal region of P-factor was expected to be important for an initial interaction between peptides and Mam2. The initial interaction be- tween the N-terminal region of P-factor and Mam2 might be followed by the tight binding between the C-terminal region of P-factor and Mam2. P17, P18, and P19 induced the production of GFP slightly higher than expected. This might be due to a higher isoelectric point (pI) of three peptides (Table 2). As P15 and P14 were able to induce the signal transduction pathway only at high con- centration, we expected that the specific interaction would not be observed by AFM measurement. But the distribution patterns of force curve histogram of P15 and P14 are very similar to that of P-factor. In the AFM ex- periment, peptides were forced to interact with Mam2 with the applied force by AFM cantilever, which might compensate the initial interaction between peptide and Mam2. The length of P12 and P13 might be not enough for the tight binding to induce specific interaction ob- served by AFM measurement. The initial interaction be- tween the N-terminal region of P-factor and Mam2 might be weak and not detected by AFM. The tight binding be- tween the C-terminal region of P-factor and Mam2 might occur after the initial interaction or the applied force by AFM cantilever and then be detected by AFM experi- ment. Figure 3 shows a possible model of an interaction between the peptide and Mam2 on the cell surface. At the first step, the N-terminal region of P-factor binds Mam2 weakly. At the next step, the C-terminal region of P- factor manages to fit a Mam2 binding pocket (Figures 3(a)-(c)) followed by the induction of the signal trans- duction pathway and the strong interaction between pep- tide and Mam2. Peptide losing the N-terminal region cannot bind to the binding pocket at lower concentration due to a lacking of the initial interaction between the N-terminal region of P-factor and Mam2 (Figure 3(d)). For AFM study, peptide with cantilever is forced to make contact with Mam2. Therefore, the C-terminal region of P-factor binds to the binding pocket of Mam2 without the initial interaction between the N-terminal region of P-factor and Mam2 (Figures 3(e) and (f)). This explains why we were not able to detect the difference in the number of events between P14 or P15 and P-factor by AFM study, although P14 and P15 from group3 have quite different EC50 from P-factor with the GFP reporter assay. P13 might be small and P12 might be too small to occupy the binding pocket of Mam2. 4. Acknowledgements We would like to thank Dr. H. Tohda (Asahi Glass Co., Figure 3. The possible motif of binding of P-factor to Mam2. First, the N-terminal region of P-factor binds Mam2 weakly (a). Then, the C-terminal region fits a binding pocket (b) and (c). The N-terminal region truncated P-factor fails to bind to the binding pocket since the first binding cannot be performed (d). Irrespective of the existence of the N-ter- minal region, The C-terminal region is forcibly combined with the pocket by pushing of the cantilever in AFM study (e) and (f). 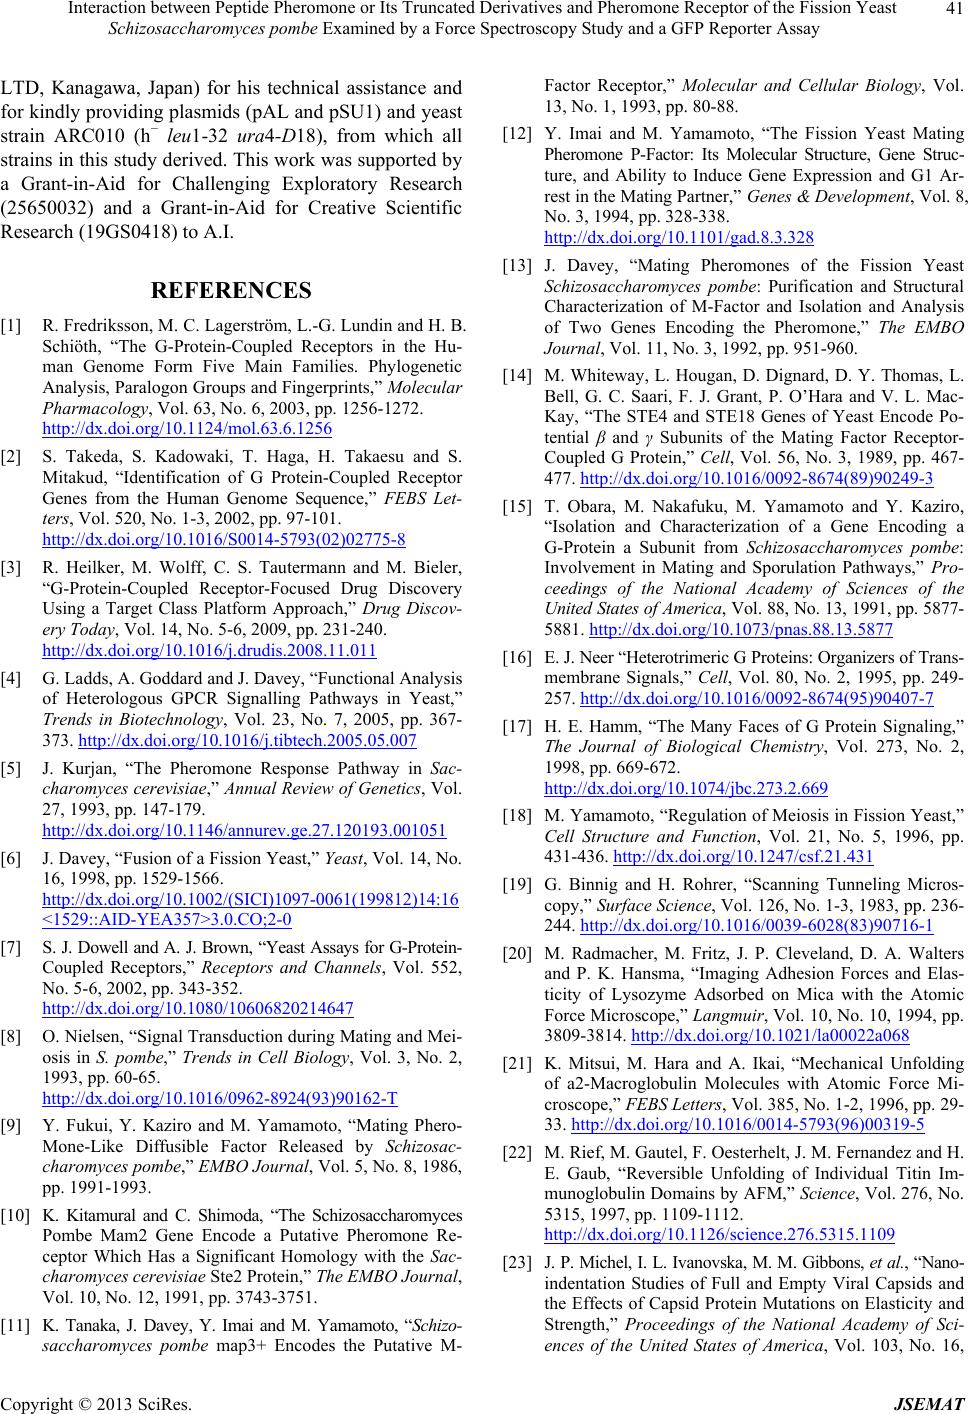 Interaction between Peptide Pheromone or Its Truncated Derivatives and Pheromone Receptor of the Fission Yeast Schizosaccharomyces pombe Examined by a Force Spectroscopy Study and a GFP Reporter Assay Copyright © 2013 SciRes. JSEMAT 41 LTD, Kanagawa, Japan) for his technical assistance and for kindly providing plasmids (pAL and pSU1) and yeast strain ARC010 (h− leu1-32 ura4-D18), from which all strains in this study derived. This work was supported by a Grant-in-Aid for Challenging Exploratory Research (25650032) and a Grant-in-Aid for Creative Scientific Research (19GS0418) to A.I. REFERENCES [1] R. Fredriksson, M. C. Lagerström, L.-G. Lundin and H. B. Schiöth, “The G-Protein-Coupled Receptors in the Hu- man Genome Form Five Main Families. Phylogenetic Analysis, Paralogon Groups and Fingerprints,” Molecular Pharmacology, Vol. 63, No. 6, 2003, pp. 1256-1272. http://dx.doi.org/10.1124/mol.63.6.1256 [2] S. Takeda, S. Kadowaki, T. Haga, H. Takaesu and S. Mitakud, “Identification of G Protein-Coupled Receptor Genes from the Human Genome Sequence,” FEBS Let- ters, Vol. 520, No. 1-3, 2002, pp. 97-101. http://dx.doi.org/10.1016/S0014-5793(02)02775-8 [3] R. Heilker, M. Wolff, C. S. Tautermann and M. Bieler, “G-Protein-Coupled Receptor-Focused Drug Discovery Using a Target Class Platform Approach,” Drug Discov- ery Today, Vol. 14, No. 5-6, 2009, pp. 231-240. http://dx.doi.org/10.1016/j.drudis.2008.11.011 [4] G. Ladds, A. Goddard and J. Davey, “Functional Analysis of Heterologous GPCR Signalling Pathways in Yeast,” Trends in Biotechnology, Vol. 23, No. 7, 2005, pp. 367- 373. http://dx.doi.org/10.1016/j.tibtech.2005.05.007 [5] J. Kurjan, “The Pheromone Response Pathway in Sac- charomyces cerevisiae,” Annual Review of Genetics, Vol. 27, 1993, pp. 147-179. http://dx.doi.org/10.1146/annurev.ge.27.120193.001051 [6] J. Davey, “Fusion of a Fission Yeast,” Yeast, Vol. 14, No. 16, 1998, pp. 1529-1566. http://dx.doi.org/10.1002/(SICI)1097-0061(199812)14:16 <1529::AID-YEA357>3.0.CO;2-0 [7] S. J. Dowell and A. J. Brown, “Yeast Assays for G-Protein- Coupled Receptors,” Receptors and Channels, Vol. 552, No. 5-6, 2002, pp. 343-352. http://dx.doi.org/10.1080/10606820214647 [8] O. Nielsen, “Signal Transduction during Mating and Mei- osis in S. pombe,” Trends in Cell Biology, Vol. 3, No. 2, 1993, pp. 60-65. http://dx.doi.org/10.1016/0962-8924(93)90162-T [9] Y. Fukui, Y. Kaziro and M. Yamamoto, “Mating Phero- Mone-Like Diffusible Factor Released by Schizosac- charomyces pombe,” EMBO Journal, Vol. 5, No. 8, 1986, pp. 1991-1993. [10] K. Kitamural and C. Shimoda, “The Schizosaccharomyces Pombe Mam2 Gene Encode a Putative Pheromone Re- ceptor Which Has a Significant Homology with the Sac- charomyces cerevisiae Ste2 Protein,” The EMBO Journal, Vol. 10, No. 12, 1991, pp. 3743-3751. [11] K. Tanaka, J. Davey, Y. Imai and M. Yamamoto, “Schizo- saccharomyces pombe map3+ Encodes the Putative M- Factor Receptor,” Molecular and Cellular Biology, Vol. 13, No. 1, 1993, pp. 80-88. [12] Y. Imai and M. Yamamoto, “The Fission Yeast Mating Pheromone P-Factor: Its Molecular Structure, Gene Struc- ture, and Ability to Induce Gene Expression and G1 Ar- rest in the Mating Partner,” Genes & Development, Vol. 8, No. 3, 1994, pp. 328-338. http://dx.doi.org/10.1101/gad.8.3.328 [13] J. Davey, “Mating Pheromones of the Fission Yeast Schizosaccharomyces pombe: Purification and Structural Characterization of M-Factor and Isolation and Analysis of Two Genes Encoding the Pheromone,” The EMBO Journal, Vol. 11, No. 3, 1992, pp. 951-960. [14] M. Whiteway, L. Hougan, D. Dignard, D. Y. Thomas, L. Bell, G. C. Saari, F. J. Grant, P. O’Hara and V. L. Mac- Kay, “The STE4 and STE18 Genes of Yeast Encode Po- tential β and γ Subunits of the Mating Factor Receptor- Coupled G Protein,” Cell, Vol. 56, No. 3, 1989, pp. 467- 477. http://dx.doi.org/10.1016/0092-8674(89)90249-3 [15] T. Obara, M. Nakafuku, M. Yamamoto and Y. Kaziro, “Isolation and Characterization of a Gene Encoding a G-Protein a Subunit from Schizosaccharomyces pombe: Involvement in Mating and Sporulation Pathways,” Pro- ceedings of the National Academy of Sciences of the United States of America, Vol. 88, No. 13, 1991, pp. 5877- 5881. http://dx.doi.org/10.1073/pnas.88.13.5877 [16] E. J. Neer “Heterotrimeric G Proteins: Organizers of Trans- membrane Signals,” Cell, Vol. 80, No. 2, 1995, pp. 249- 257. http://dx.doi.org/10.1016/0092-8674(95)90407-7 [17] H. E. Hamm, “The Many Faces of G Protein Signaling,” The Journal of Biological Chemistry, Vol. 273, No. 2, 1998, pp. 669-672. http://dx.doi.org/10.1074/jbc.273.2.669 [18] M. Yamamoto, “Regulation of Meiosis in Fission Yeast,” Cell Structure and Function, Vol. 21, No. 5, 1996, pp. 431-436. http://dx.doi.org/10.1247/csf.21.431 [19] G. Binnig and H. Rohrer, “Scanning Tunneling Micros- copy,” Surface Science, Vol. 126, No. 1-3, 1983, pp. 236- 244. http://dx.doi.org/10.1016/0039-6028(83)90716-1 [20] M. Radmacher, M. Fritz, J. P. Cleveland, D. A. Walters and P. K. Hansma, “Imaging Adhesion Forces and Elas- ticity of Lysozyme Adsorbed on Mica with the Atomic Force Microscope,” Langmuir, Vol. 10, No. 10, 1994, pp. 3809-3814. http://dx.doi.org/10.1021/la00022a068 [21] K. Mitsui, M. Hara and A. Ikai, “Mechanical Unfolding of a2-Macroglobulin Molecules with Atomic Force Mi- croscope,” FEBS Letters, Vol. 385, No. 1-2, 1996, pp. 29- 33. http://dx.doi.org/10.1016/0014-5793(96)00319-5 [22] M. Rief, M. Gautel, F. Oesterhelt, J. M. Fernandez and H. E. Gaub, “Reversible Unfolding of Individual Titin Im- munoglobulin Domains by AFM,” Science, Vol. 276, No. 5315, 1997, pp. 1109-1112. http://dx.doi.org/10.1126/science.276.5315.1109 [23] J. P. Michel, I. L. Ivanovska, M. M. Gibbons, et al., “Nano- indentation Studies of Full and Empty Viral Capsids and the Effects of Capsid Protein Mutations on Elasticity and Strength,” Proceedings of the National Academy of Sci- ences of the United States of America, Vol. 103, No. 16,  Interaction between Peptide Pheromone or Its Truncated Derivatives and Pheromone Receptor of the Fission Yeast Schizosaccharomyces pombe Examined by a Force Spectroscopy Study and a GFP Reporter Assay Copyright © 2013 SciRes. JSEMAT 42 2006, pp. 6184-6189. http://dx.doi.org/10.1073/pnas.0601744103 [24] G. Lee, K. Abdi, Y. Jiang, P. Michaely, V. Bennett and P. E. Marszalek, “Nanospring Behaviour of Ankyrin Re- peats,” Nature, Vol. 440, No. 7081, 2006, pp. 246-249. http://dx.doi.org/10.1038/nature04437 [25] R. Afrin, T. Yamada and A. Ikai, “Analysis of Force Curves Obtained on the Live Cell Membrane Using Che- mically Modified AFM Probes,” Ultramicroscopy, Vol. 100, No. 3-4, 2004, pp. 187-195. http://dx.doi.org/10.1016/j.ultramic.2004.01.013 [26] C. Lesoil, T. Nonaka, H. Sekiguchi, et al., “Molecular Shape and Binding Force of Mycoplasma Mobile’s Leg Protein Gli349 Revealed by an AFM Study,” Biochemi- cal and Biophysical Research Communications, Vol. 391, No. 3, 2010, pp. 1312-1317. http://dx.doi.org/10.1016/j.bbrc.2009.12.023 [27] A. Yersin, T. Osada and A. Ikai, “Exploring Transferrin- Receptor Interactions at the Single-Molecule Level,” Bio- physical Journal, Vol. 94, No. 1, 2008, pp. 230-240. http://dx.doi.org/10.1529/biophysj.107.114637 [28] S. Sasuga, R. Abe, O. Nikaido, S. Kiyosaki, H. Sekiguchi, A. Ikai and T. Osada, “Interaction between Pheromone and Its Receptor of the Fission Yeast Schizosaccharomyces pombe Examined by a Force Spectroscopy Study,” Jour- nal of Biomedicine and Biotechnology, Vol. 2012, 2012, Article ID: 804793. http://dx.doi.org/10.1155/2012/804793 [29] H. Kim, F. Asgari, M. Kato-Negishi, S. Ohkura, H. Oka- mura, H. Arakawa, T. Osada and A. Ikai, “Distribution of Olfactory Marker Protein on a Tissue Section of Vome- ronasal Organ Measured by AFM,” Colloids and Surfaces B: Biointerfaces, Vol. 61, No. 2, 2008, pp. 311-314. http://dx.doi.org/10.1016/j.colsurfb.2007.09.001 [30] H. Kim, H. Arakawa, N. Hatae, Y. Sugimoto, O. Matsu- moto, T. Osada, A. Ichikawa and A. Ikai, “Quantification of the Number of EP3 Receptors on a Living CHO Cell Surface by the AFM,” Ultramicroscopy, Vol. 106, No. 8-9, 2006, pp. 652-662. http://dx.doi.org/10.1016/j.ultramic.2005.12.007 |