

Paper Menu >>
Journal Menu >>
 Open Journal of Geology, 2013, 3, 13-16 doi:10.4236/ojg.2013.32B003 Published Online April 2013 (http://www.scirp.org/journal/ojg) Performing High Resolution Seismic Reflection for Mapping Bauxite Layers A. Qadrouh, A. Alanezi, I. Hafiz, K. Munir, M. Alyousif Seismic Analyses Center, King Abdulaziz City for Science and Technology (KACST), Riyadh, Saudi Arabia Email: [email protected] Received 2013 ABSTRACT The seismic method is able to produce highly accurate images of the Earth's subsurface. Having such detail is not only an important factor in mining, but also in civil engineering. Bauxite exploration attracts both government and industri- alists to invest in it because of the high percentage of aluminum present. The economic importance of extracting alu- minum from bauxite encouraged us to take this challenge; to image bauxite layers by using a high-resolution seismic reflection method at Al Qassim, Saudi Arabia. Since the subsurface structure of the area is complex, this high-resolution reflection method was carried out along a 2D line with geophone and source interv al, with se ttings at 5 m. The result for the seismic section shows that the depth and thickness of the bauxite layer varied from 20 to 34 m, and 3 to 7 m respec- tively. In addition, the bauxite layer was sandwiched between clay layers. In order to achieve an even more precise depth than presen ted by seismic section alone, we tied the dr illed wells to the seismic data and we accomplished a well match with an approximation error of 1 - 2 m, which may have been caused by the upper clay layer or by very shallow loose subsurface material. The seismic method thus applied shows the ab ility to detect sign ificant details within th e n ear surface of the earth, and considers more cost-effective than only drilled wells. Keywords: High-resolution Seismic Reflection Method; Depth Conversion; Bauxite 1. Introduction The high-resolution seismic reflection method has per- formed effectively to delineate the subsurface structures of the earth. Many geophysicists such as [6], [12], [10] and [7] have detected coal using this method. Other in- vestigators have utilized the high-resolution seismic re- flection method for a variety of applications. For exam- ple, [8] applied it to determine unconsolidated sedimen- tary structures in the Netherlands. [5] applied the method to detect unconsolidated aquifers in Australia. [4] used it to assist in mine planning and future horizontal drilling for coal-seam methane extraction. [13] applied it to im- age a thin, diamondiferous kimberlite dyke. Clement et al. (2010) used it to d elin eate g row th fold ing and sh allow faults beneath the southern Puget Lowland, Washington state. Approximately 85% of bauxite are considered to be aluminum, where aluminum has specific physical and chemical characteristics such as light weight, low density, great strength and resistant to oxidation [9]. Such high percentages have attracted government and industrialists to invest in bauxite extraction for the revenue provided. Many researchers have applied various geophysical methods to detect bauxite layers, such as [11] who ap- plied a seismoelectric method, [14] who performed the electrical tomography technique, as well as GPR and [2] who applied induced polarization sounding and resistiv- ity methods. The ultimate objective of our research was to apply the high-resolution seismic reflection method to delineate the bauxite layer at the Al Qassim site in Saudi Arabia. Once accomplished, the seismic result was tested with both drilled wells and lithological data to confirm the depth and thickness of the bauxite layer. The results show that this layer generally varied in depth and thickness, from 20 to 35 m and 3 to 7 m respectively, sandwiched be- tween clay layers. The wells were tied to the seismic re- flection section and we achieved a good match, with an error of approximately 1 - 2 m, which may have been caused by the upper clay layer or very shallow loose subsurface material. 2. Field Procedures and Data Processing When acquiring high-resolution seismic reflection data, it is essential to avoid aliasing problems, which can be avoided by collecting signals with sufficient spatial and temporal sampling. The high-resolution reflection method was carried out along a 2D seismic line. Our geometry Copyright © 2013 SciRes. OJG 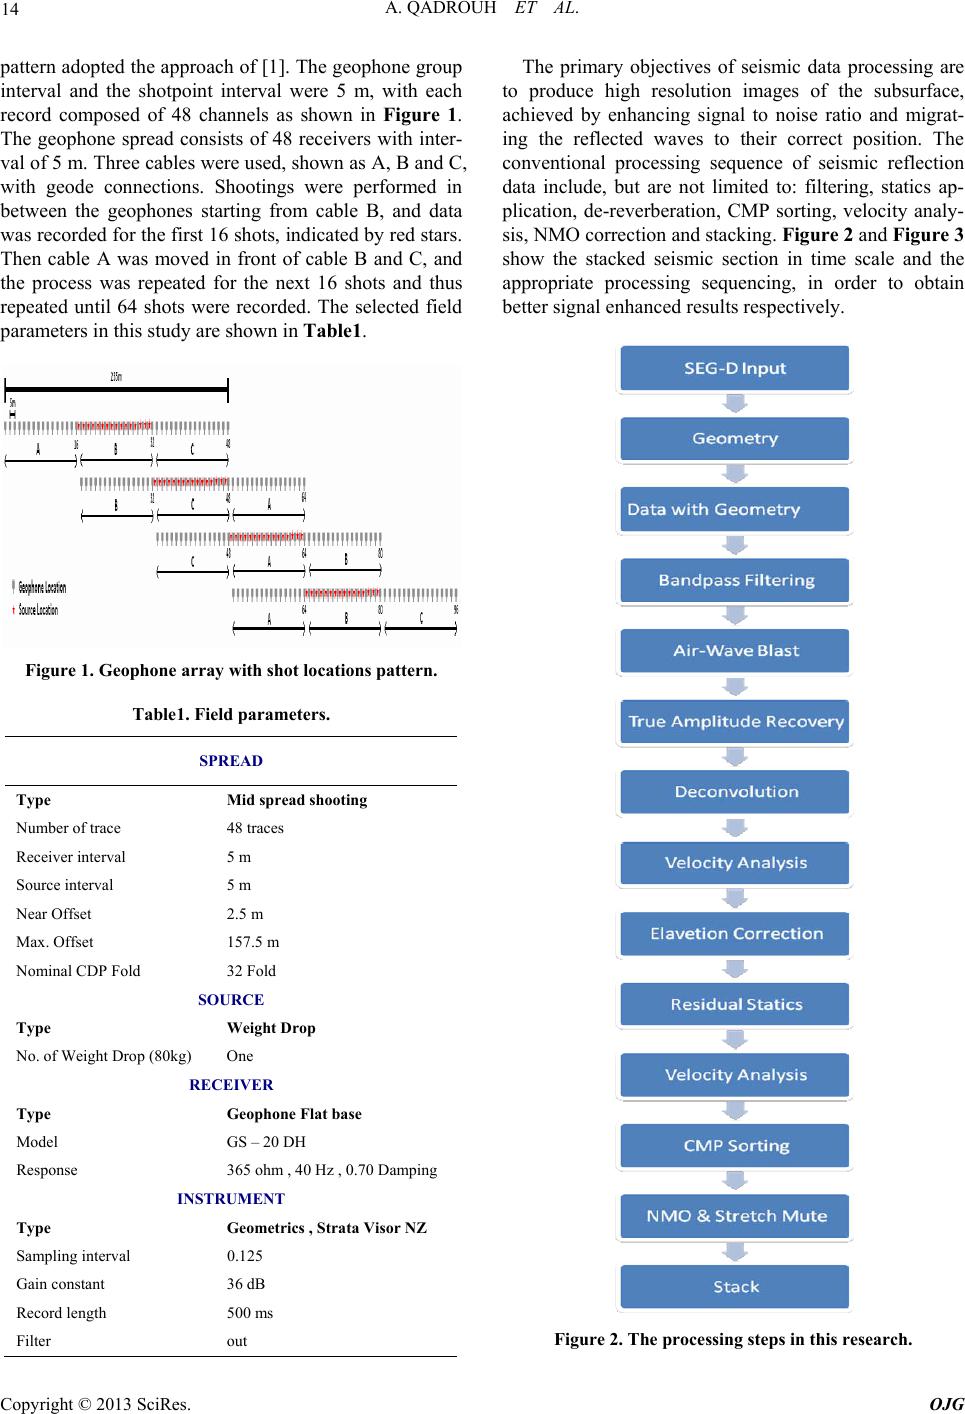 A. QADROUH ET AL. 14 pattern adopted the approach of [1]. The geophone group interval and the shotpoint interval were 5 m, with each record composed of 48 channels as shown in Figure 1. The geophone spread consists of 48 receivers with inter- val of 5 m. Three cables were used, shown as A, B and C, with geode connections. Shootings were performed in between the geophones starting from cable B, and data was recorded for the first 16 shots, indicated by red stars. Then cable A was moved in front of cable B and C, and the process was repeated for the next 16 shots and thus repeated until 64 shots were recorded. The selected field parameters in this study are shown in Table1. Figure 1. Geophone array with shot locations pattern. Table1. Field parameters. SPREAD Type Mid spread shooting Number of trace 48 traces Receiver interval 5 m Source interval 5 m Near Offset 2.5 m Max. Offset 157.5 m Nominal CDP Fold 32 Fold SOURCE Type Weight Drop No. of Weight Drop (80kg) One RECEIVER Type Geophone Flat base Model GS – 20 DH Response 365 ohm , 40 Hz , 0.70 Damping INSTRUMENT Type Geometrics , Strata Visor NZ Sampling interval 0.125 Gain constant 36 dB Record length 500 ms Filter out The primary objectives of seismic data processing are to produce high resolution images of the subsurface, achieved by enhancing signal to noise ratio and migrat- ing the reflected waves to their correct position. The conventional processing sequence of seismic reflection data include, but are not limited to: filtering, statics ap- plication, de-reverberation, CMP sorting, velocity analy- sis, NMO correction and stacking. Figure 2 and Figure 3 show the stacked seismic section in time scale and the appropriate processing sequencing, in order to obtain better signal enhanced results respectively. Figure 2. The processing steps in this research. Copyright © 2013 SciRes. OJG 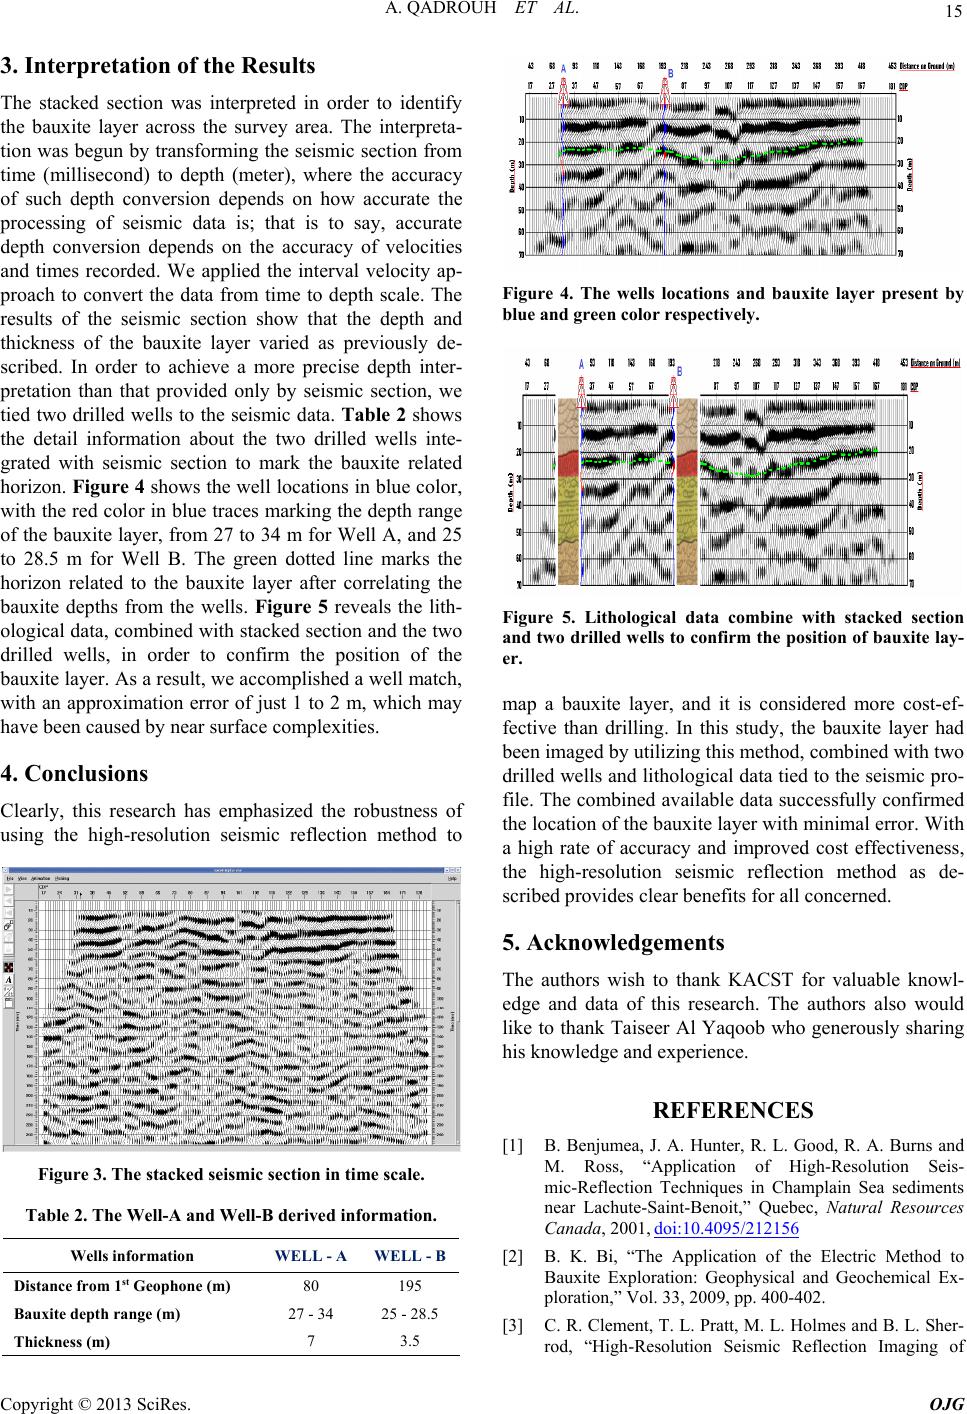 A. QADROUH ET AL. 15 3. Interpretation of the Results The stacked section was interpreted in order to identify the bauxite layer across the survey area. The interpreta- tion was begun by transforming the seismic section from time (millisecond) to depth (meter), where the accuracy of such depth conversion depends on how accurate the processing of seismic data is; that is to say, accurate depth conversion depends on the accuracy of velocities and times recorded. We applied the interval velocity ap- proach to convert the data from time to depth scale. The results of the seismic section show that the depth and thickness of the bauxite layer varied as previously de- scribed. In order to achieve a more precise depth inter- pretation than that provided only by seismic section, we tied two drilled wells to the seismic data. Table 2 shows the detail information about the two drilled wells inte- grated with seismic section to mark the bauxite related horizon. Figure 4 shows the well locations in blu e color, with the red color in blue traces marking the depth range of the bauxite layer, from 27 to 34 m for Well A, and 25 to 28.5 m for Well B. The green dotted line marks the horizon related to the bauxite layer after correlating the bauxite depths from the wells. Figure 5 reveals the lith- ological data, combined with stacked section and the two drilled wells, in order to confirm the position of the bauxite layer. As a result, we accomplished a well match, with an approximation error of just 1 to 2 m, which may have been caused by near surface complexities. 4. Conclusions Clearly, this research has emphasized the robustness of using the high-resolution seismic reflection method to Figure 3. The stacked seismic section in time scale. Table 2. The Well-A and Well-B derived information. Wells information WELL - A WELL - B Distance from 1st Geophone (m) 80 195 Bauxite depth range (m) 27 - 34 25 - 28.5 Thickness (m) 7 3.5 Figure 4. The wells locations and bauxite layer present by blue and green color respectively. Figure 5. Lithological data combine with stacked section and two drilled wells to confirm the position of bauxite lay - er. map a bauxite layer, and it is considered more cost-ef- fective than drilling. In this study, the bauxite layer had been imaged by utilizing this method, combined with two drilled wells and litho logical data tied to the seis mic pro- file. The combined available data successfully confirmed the location of th e baux ite layer with minimal error. With a high rate of accuracy and improved cost effectiveness, the high-resolution seismic reflection method as de- scribed provides clear benefits for all concerned. 5. Acknowledgements The authors wish to thank KACST for valuable knowl- edge and data of this research. The authors also would like to thank Taiseer Al Yaqoob who generously sharing his knowledge and experience. REFERENCES [1] B. Benjumea, J. A. Hunter, R. L. Good, R. A. Burns and M. Ross, “Application of High-Resolution Seis- mic-Reflection Techniques in Champlain Sea sediments near Lachute-Saint-Benoit,” Quebec, Natural Resources Canada, 2001, doi:10.4095/212156 [2] B. K. Bi, “The Application of the Electric Method to Bauxite Exploration: Geophysical and Geochemical Ex- ploration,” Vol. 33, 2009, pp. 400-402. [3] C. R. Clement, T. L. Pratt, M. L. Holmes and B. L. Sher- rod, “High-Resolution Seismic Reflection Imaging of Copyright © 2013 SciRes. OJG 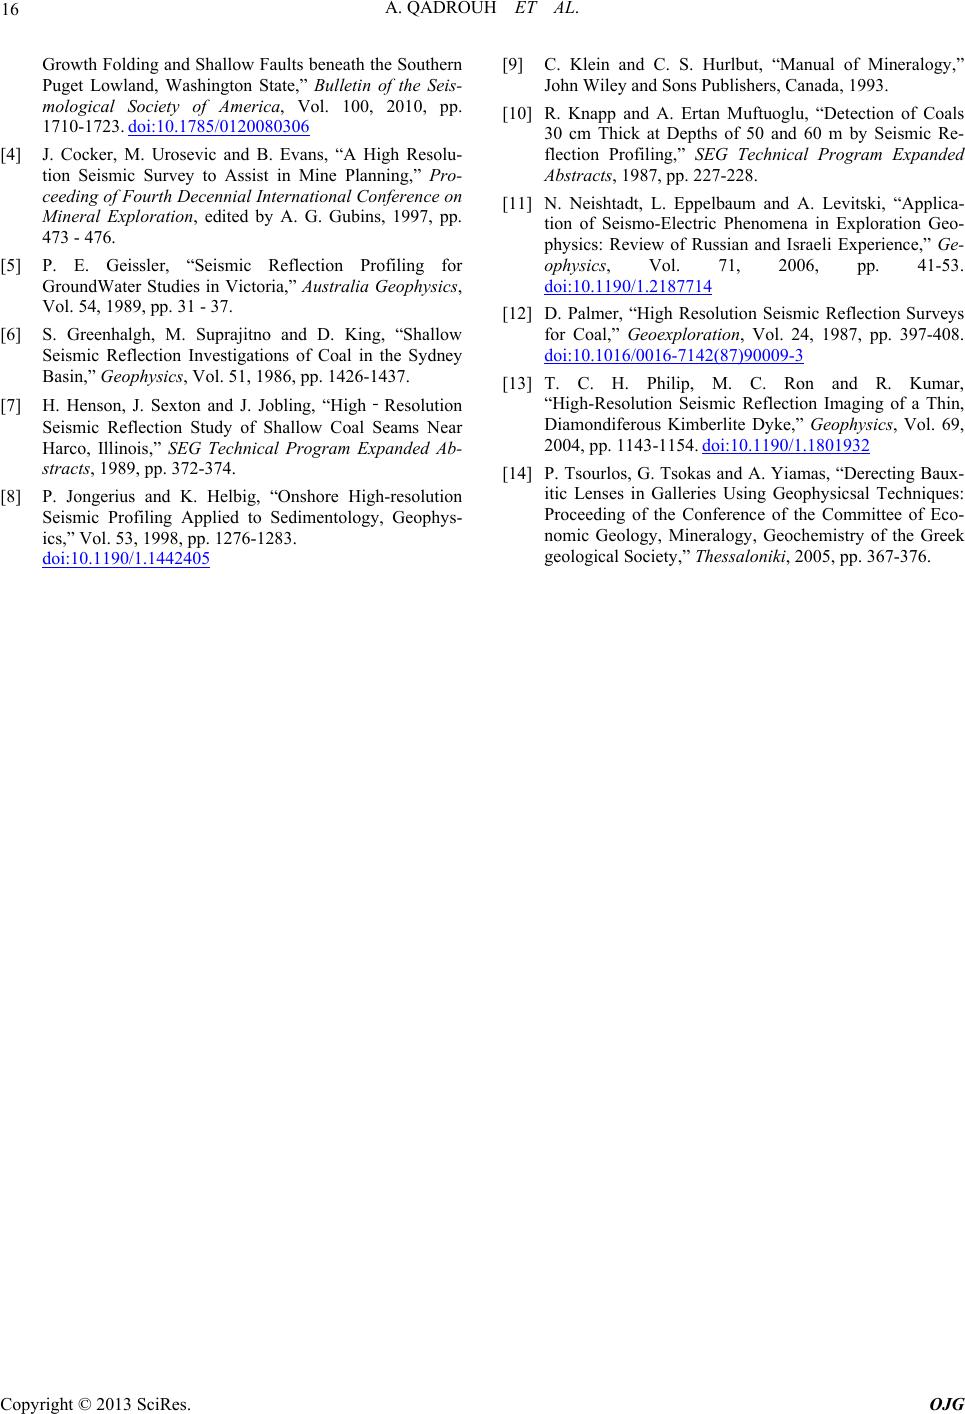 A. QADROUH ET AL. Copyright © 2013 SciRes. OJG 16 Growth Folding and Shallow Faults beneath the Southern Puget Lowland, Washington State,” Bulletin of the Seis- mological Society of America, Vol. 100, 2010, pp. 1710-1723. doi:10.1785/0120080306 [4] J. Cocker, M. Urosevic and B. Evans, “A High Resolu- tion Seismic Survey to Assist in Mine Planning,” Pro- ceeding of Fourth Decennial International Conference on Mineral Exploration, edited by A. G. Gubins, 1997, pp. 473 - 476. [5] P. E. Geissler, “Seismic Reflection Profiling for GroundWater Studies in Victoria,” Australia Geophysics, Vol. 54, 1989, pp. 31 - 37. [6] S. Greenhalgh, M. Suprajitno and D. King, “Shallow Seismic Reflection Investigations of Coal in the Sydney Basin,” Geophysics, Vol. 51, 1986, pp. 1426-1437. [7] H. Henson, J. Sexton and J. Jobling, “High‐Resolution Seismic Reflection Study of Shallow Coal Seams Near Harco, Illinois,” SEG Technical Program Expanded Ab- stracts, 1989, pp. 372-374. [8] P. Jongerius and K. Helbig, “Onshore High-resolution Seismic Profiling Applied to Sedimentology, Geophys- ics,” Vol. 53, 1998, pp. 1276-1283. doi:10.1190/1.1442405 [9] C. Klein and C. S. Hurlbut, “Manual of Mineralogy,” John Wiley and Sons Publishers, Canada, 1993. [10] R. Knapp and A. Ertan Muftuoglu, “Detection of Coals 30 cm Thick at Depths of 50 and 60 m by Seismic Re- flection Profiling,” SEG Technical Program Expanded Abstracts, 1987, pp. 227-228. [11] N. Neishtadt, L. Eppelbaum and A. Levitski, “Applica- tion of Seismo-Electric Phenomena in Exploration Geo- physics: Review of Russian and Israeli Experience,” Ge- ophysics, Vol. 71, 2006, pp. 41-53. doi:10.1190/1.2187714 [12] D. Palmer, “High Resolution Seismic Reflection Surveys for Coal,” Geoexploration, Vol. 24, 1987, pp. 397-408. doi:10.1016/0016-7142(87)90009-3 [13] T. C. H. Philip, M. C. Ron and R. Kumar, “High-Resolution Seismic Reflection Imaging of a Thin, Diamondiferous Kimberlite Dyke,” Geophysics, Vol. 69, 2004, pp. 1143-1154. doi:10.1190/1.1801932 [14] P. Tsourlos, G. Tsokas and A. Yiamas, “Derecting Baux- itic Lenses in Galleries Using Geophysicsal Techniques: Proceeding of the Conference of the Committee of Eco- nomic Geology, Mineralogy, Geochemistry of the Greek geological Society,” Thessaloniki, 2005, pp. 367-376. |