

Paper Menu >>
Journal Menu >>
 Journal of Crystallization Process and Technology, 2013, 3, 119-122 http://dx.doi.org/10.4236/jcpt.2013.34019 Published Online October 2013 (http://www.scirp.org/journal/jcpt) Copyright © 2013 SciRes. JCPT 119 Thermodinamic Interpretaion of the Morphology Individuality of Natural and Synthesized Apatite Single Crystals Takaomi Suzuki, Haruka Takemae, Mika Yoshida Department of Environmental Science and Technol ogy, Fac ulty of E ngineering, Shinshu University , Nagano, Japan. Email: [email protected] Received July 24th, 2013; revised August 23rd, 2013; accepted September 5th, 2013 Copyright © 2013 Takaomi Suzuki et al. This is an open access article distributed under the Creative Commons Attribution License, which permits unrestricted use, distribution, and reproduction in any medium, provided the original work is properly cited. ABSTRACT Specific surface free energy (SSFE) of natural calcium fluorapatite from the same mother rock and synthesized barium chlorapatite from the same lot was determined using contact angle of water and formamide droplets, compared with grown length of crystal face (h). The experimentally obtained SSFEs have different values even for the same index faces of the different crystals. The SSFEs also have wide distribution for each face of crystals. Observed SSFE is con- sidered to be not only the SSFE of ideally flat terrace face, but also includes the contribution of strep free energy. Though the crystals we experimentally obtained were growth form, the relationship between SSFE and h was almost proportional, which looks like satisfying Wulff’s relationship qualitatively. The slope of SSFE versus h line shows the driving force of crystal growth, and the line for larger crystal has less steep slope. The driving force of crystal growth for larger crystal is smaller, which also means that the chemical potential is larger for larger crystal. Th e ind ividu ality of crystals for the same lot can be explained by the difference of the chemical potential of each crystal. Keywords: Crystal Morphology; Single Crystal Growth; Apatite Crystal 1. Introduction Measurement of specific surface free energy (SSFE) of solid using contact angle of liquid is very popular and well accepted in the field of polymer science. Especially, automatic contact angle meter with software for the analysis of SSFE can be obtained commercially (for ex- ample, CA-V Series, Kyowa Interface Science). How- ever, in the field of crystal science, the measurement of SSFE of crystals is believed to be difficult. In fact, ex- perimental determination of SSFE of crystal is very few, even though the significance of SSFE for crystal growth is well discussed. Only a few trials to determine the sur- face energy of crystals were reported. For example, bond- ing energy of quartz was measured by introducing a crack into the crystal, and the energy of breaking was determined as the surface energy of the quartz crystal [1]. Determination of SSFE of polymer surface is not diffi- cult because we can easily determine the contact angle with a good reproducibility. However, the con tact angles of liquid on inorganic crystal face have very wide distri- bution, and we need to take a lot of photographs to de- termine the average of contact angle. We determined SSFE of barium chlorapatite single crystals from contact angle of liquids [2] for the first time. At that time we used more than 4000 photographs in order to determine the average contact angle of liquids. We also determined the SSFE of ruby crystals from the contact angle of liq- uid droplet and discussed the relationship between the grown length of the crystal face [3]. Although the ruby crystals were growth shape, the relationship between the SSFE and h were almost proportional, which looks satis- fying Wulff’s relationship. However, Wulff’s relationship should be satisfied for ideal equilibrium system, and the crystal face should be ideally flat. At this time, we ex- tended our experimental technique for natural mineral crystals in order to study the relationship between SSFE and h for the less ideal but more real system. 2. Experimental Procedure Natural calcium fluorapatite crystals (Cerro del Mercado Cd. Durango, Mexico) were produced from a cluster of crystals with mother rock using a hammer and a chisel. 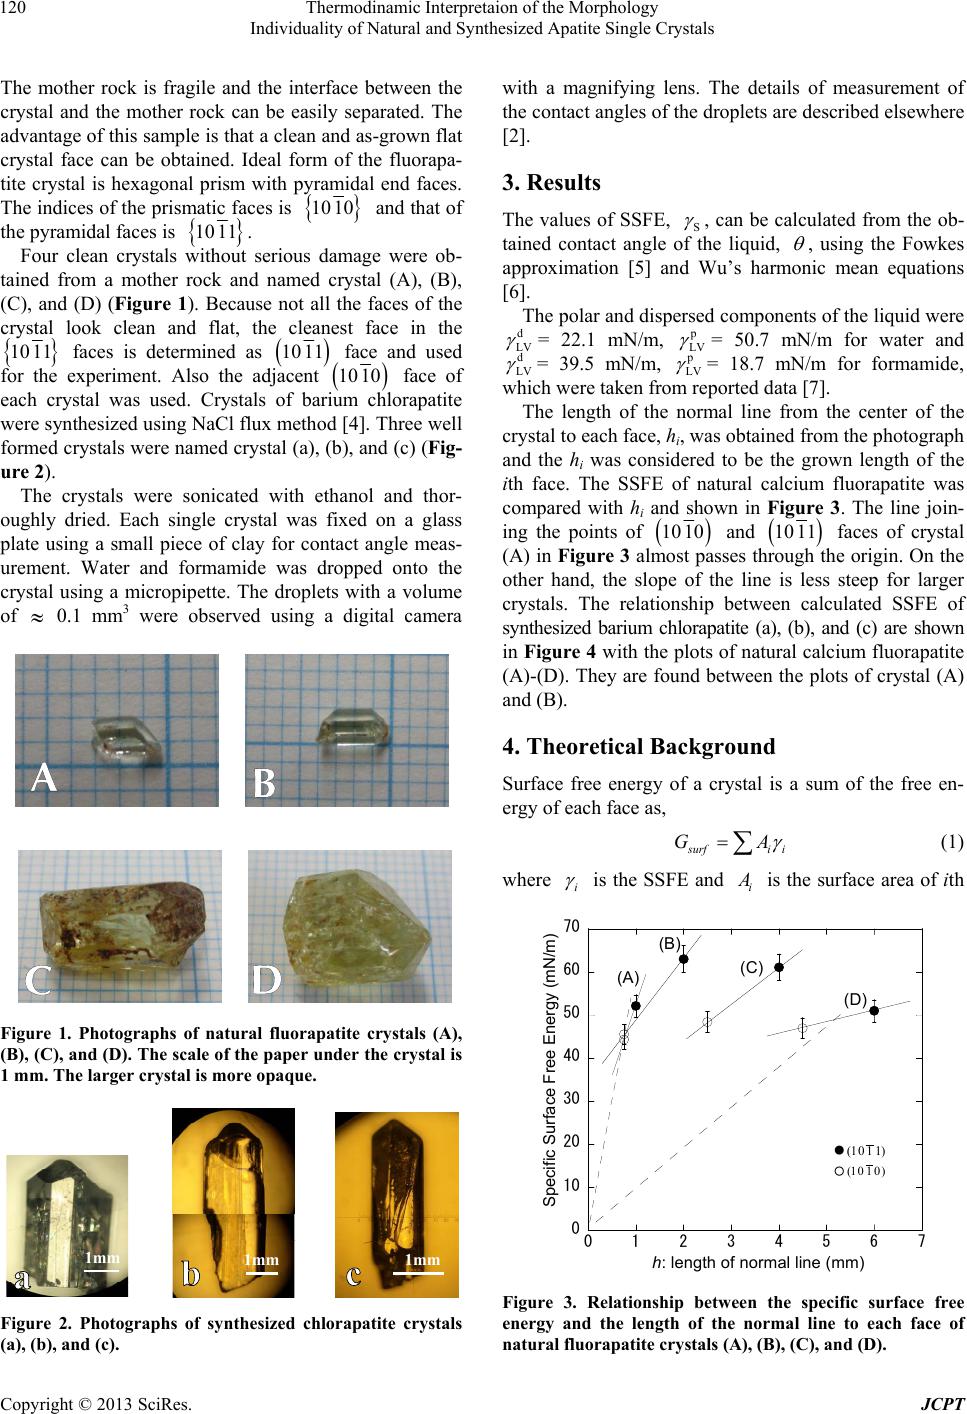 Thermodinamic Interpretaion of the Morphology Individuality of Natural and Synthesized Apatite Single Crystals Copyright © 2013 SciRes. JCPT 120 The mother rock is fragile and the interface between the crystal and the mother rock can be easily separated. The advantage of this sample is that a clean and as-grown flat crystal face can be obtained. Ideal form of the fluorapa- tite crystal is hexagonal prism with pyramidal end faces. The indices of the prismatic faces is 1010 and that of the pyramidal faces is 1011 . Four clean crystals without serious damage were ob- tained from a mother rock and named crystal (A), (B), (C), and (D) (Figure 1). Because not all the faces of the crystal look clean and flat, the cleanest face in the 1011 faces is determined as 1011 face and used for the experiment. Also the adjacent 1010 face of each crystal was used. Crystals of barium chlorapatite were synthesized using NaCl flux method [4]. Three well formed crystals were named crystal (a), (b), and (c) (Fig- ure 2). The crystals were sonicated with ethanol and thor- oughly dried. Each single crystal was fixed on a glass plate using a small piece of clay for contact angle meas- urement. Water and formamide was dropped onto the crystal using a micropipette. The droplets with a volume of 0.1 mm3 were observed using a digital camera Figure 1. Photographs of natural fluorapatite crystals (A), (B), (C), and (D). The scale of the paper under the crystal is 1 mm. The larger crystal is more opaque. 1mm 1mm 1mm Figure 2. Photographs of synthesized chlorapatite crystals (a), (b), and (c). with a magnifying lens. The details of measurement of the contact angles of the droplets are described elsewhere [2]. 3. Results The values of SSFE, S , can be calculated from the ob- tained contact angle of the liquid, , using the Fowkes approximation [5] and Wu’s harmonic mean equations [6]. The polar and dispersed components of the liquid were d LV = 22.1 mN/m, p LV = 50.7 mN/m for water and d LV = 39.5 mN/m, p LV = 18.7 mN/m for formamide, which were taken from reported data [7]. The length of the normal line from the center of the crystal to each face, hi, was obtained from the photograph and the hi was considered to be the grown length of the ith face. The SSFE of natural calcium fluorapatite was compared with hi and shown in Figure 3. The line join- ing the points of 1010 and 1011 faces of crystal (A) in Figure 3 almost passes through the origin. On the other hand, the slope of the line is less steep for larger crystals. The relationship between calculated SSFE of synthesized barium chlorapatite (a), (b), and (c) are shown in Figure 4 with the p lots of natural calcium fluorapatite (A)-(D). They are found between the plots of crystal (A) and (B). 4. Theoretical Background Surface free energy of a crystal is a sum of the free en- ergy of each face as, s urfi i GA (1) where i is the SSFE and i A is the surface area of ith 0 10 20 30 40 50 60 70 01234567 h: length of normal line (mm) Specific Surface Free Energy (mN/m) (A) (B) (C) (D) ● ○ )0110( )1110( Figure 3. Relationship between the specific surface free energy and the length of the normal line to each face of natural fluorapatite crystals (A), (B), (C), and (D). 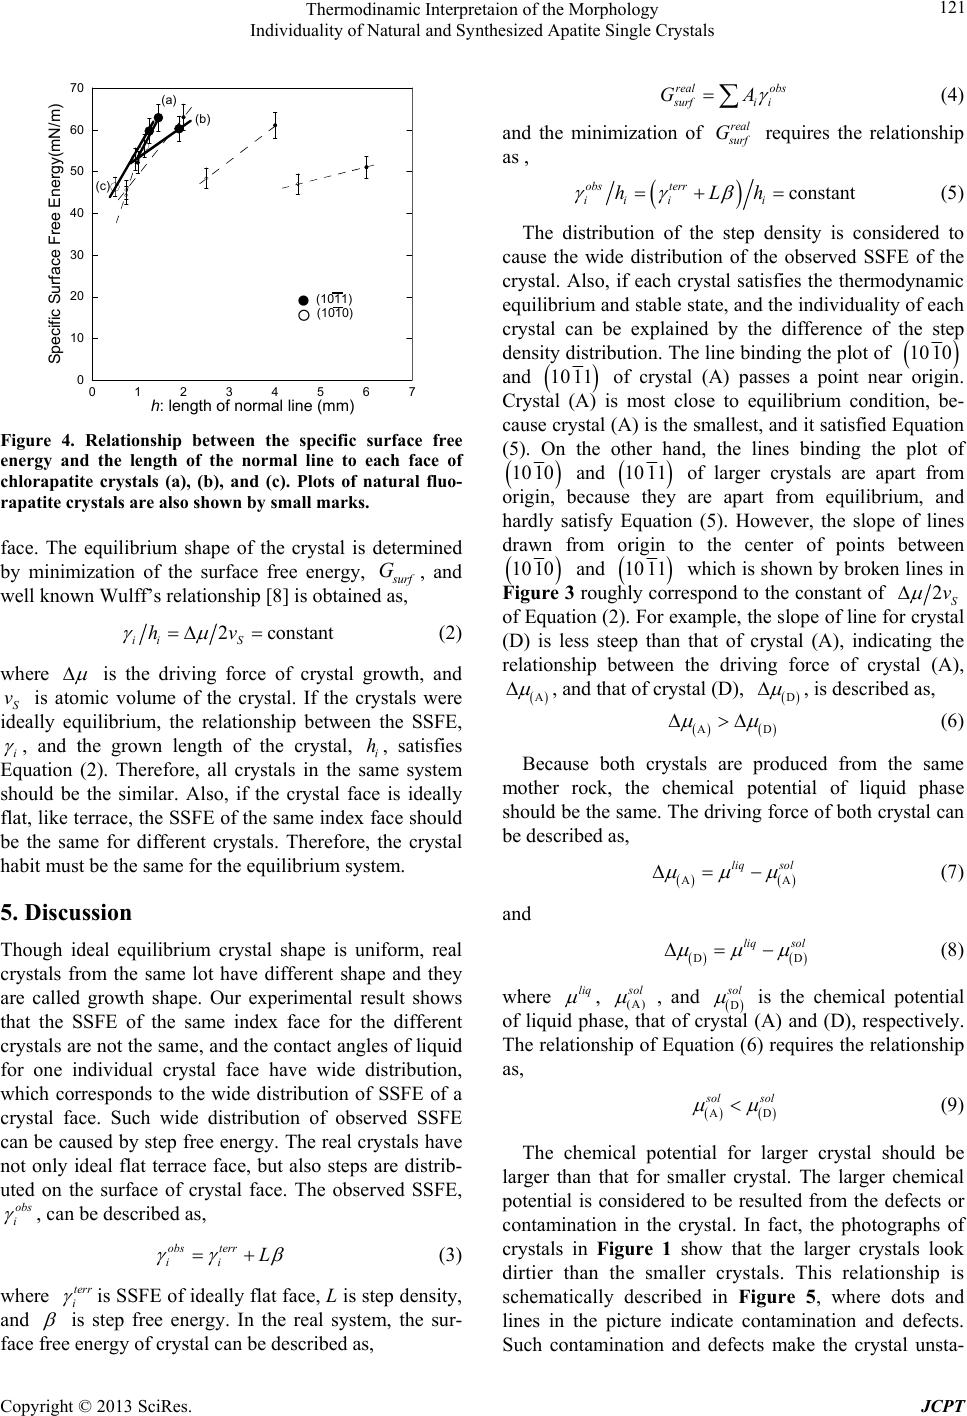 Thermodinamic Interpretaion of the Morphology Individuality of Natural and Synthesized Apatite Single Crystals Copyright © 2013 SciRes. JCPT 121 0 10 20 30 40 50 60 70 01234567 (b) (a) (c) (1010) (1011) ● ○ Specific Surface Free Energy(mN/m) h: length of normal line (mm) Figure 4. Relationship between the specific surface free energy and the length of the normal line to each face of chlorapatite crystals (a), (b), and (c). Plots of natural fluo- rapatite crystals are also shown by small marks. face. The equilibrium shape of the crystal is determined by minimization of the surface free energy, s urf G, and well known Wulff’s relationship [8] is obtained as, 2constant ii S hv (2) where is the driving force of crystal growth, and S v is atomic volume of the crystal. If the crystals were ideally equilibrium, the relationship between the SSFE, i , and the grown length of the crystal, i h, satisfies Equation (2). Therefore, all crystals in the same system should be the similar. Also, if the crystal face is ideally flat, like terrace, the SSFE of the same index face should be the same for different crystals. Therefore, the crystal habit must be the same for the equilibrium system. 5. Discussion Though ideal equilibrium crystal shape is uniform, real crystals from the same lot have different shape and they are called growth shape. Our experimental result shows that the SSFE of the same index face for the different crystals are not the same, and the contact angles of liquid for one individual crystal face have wide distribution, which corresponds to the wide distribution of SSFE of a crystal face. Such wide distribution of observed SSFE can be caused by step free energy. The real crystals have not only ideal flat terrace face, but also steps are distrib- uted on the surface of crystal face. The observed SSFE, obs i , can be described as, obs terr ii L (3) where terr i is SSFE of ideally flat face, L is step density, and is step free energy. In the real system, the sur- face free energy of crystal can be described as, real obs s urfi i GA (4) and the minimization of real s urf G requires the relationship as , constant obs terr ii ii hLh (5) The distribution of the step density is considered to cause the wide distribution of the observed SSFE of the crystal. Also, if each crystal satisfies the thermodynamic equilibrium and stable state, and the ind ividuality of each crystal can be explained by the difference of the step density distribution. Th e line binding th e plot of 1010 and 1011 of crystal (A) passes a point near origin. Crystal (A) is most close to equilibrium condition, be- cause crystal (A) is the smallest, and it satisfied Equation (5). On the other hand, the lines binding the plot of 1010 and 1011 of larger crystals are apart from origin, because they are apart from equilibrium, and hardly satisfy Equation (5). However, the slope of lines drawn from origin to the center of points between 1010 and 1011 which is shown by broken lines in Figure 3 roughly correspo nd to the constant of 2S v of Equation (2). For example, the slope of line for crystal (D) is less steep than that of crystal (A), indicating the relationship between the driving force of crystal (A), A , and that of crystal (D), D , is described as, AD (6) Because both crystals are produced from the same mother rock, the chemical potential of liquid phase should be th e same. The driving for ce of both crystal can be described as, AA liq sol (7) and DD liq sol (8) where liq , (A) s ol , and D s ol is the chemical potential of liquid phase, that of crystal (A) and (D), respectively. The relationship of Equation (6) requires the relationship as, AD s ol sol (9) The chemical potential for larger crystal should be larger than that for smaller crystal. The larger chemical potential is considered to be resulted from the defects or contamination in the crystal. In fact, the photographs of crystals in Figure 1 show that the larger crystals look dirtier than the smaller crystals. This relationship is schematically described in Figure 5, where dots and lines in the picture indicate contamination and defects. Such contamination and defects make the crystal unsta- 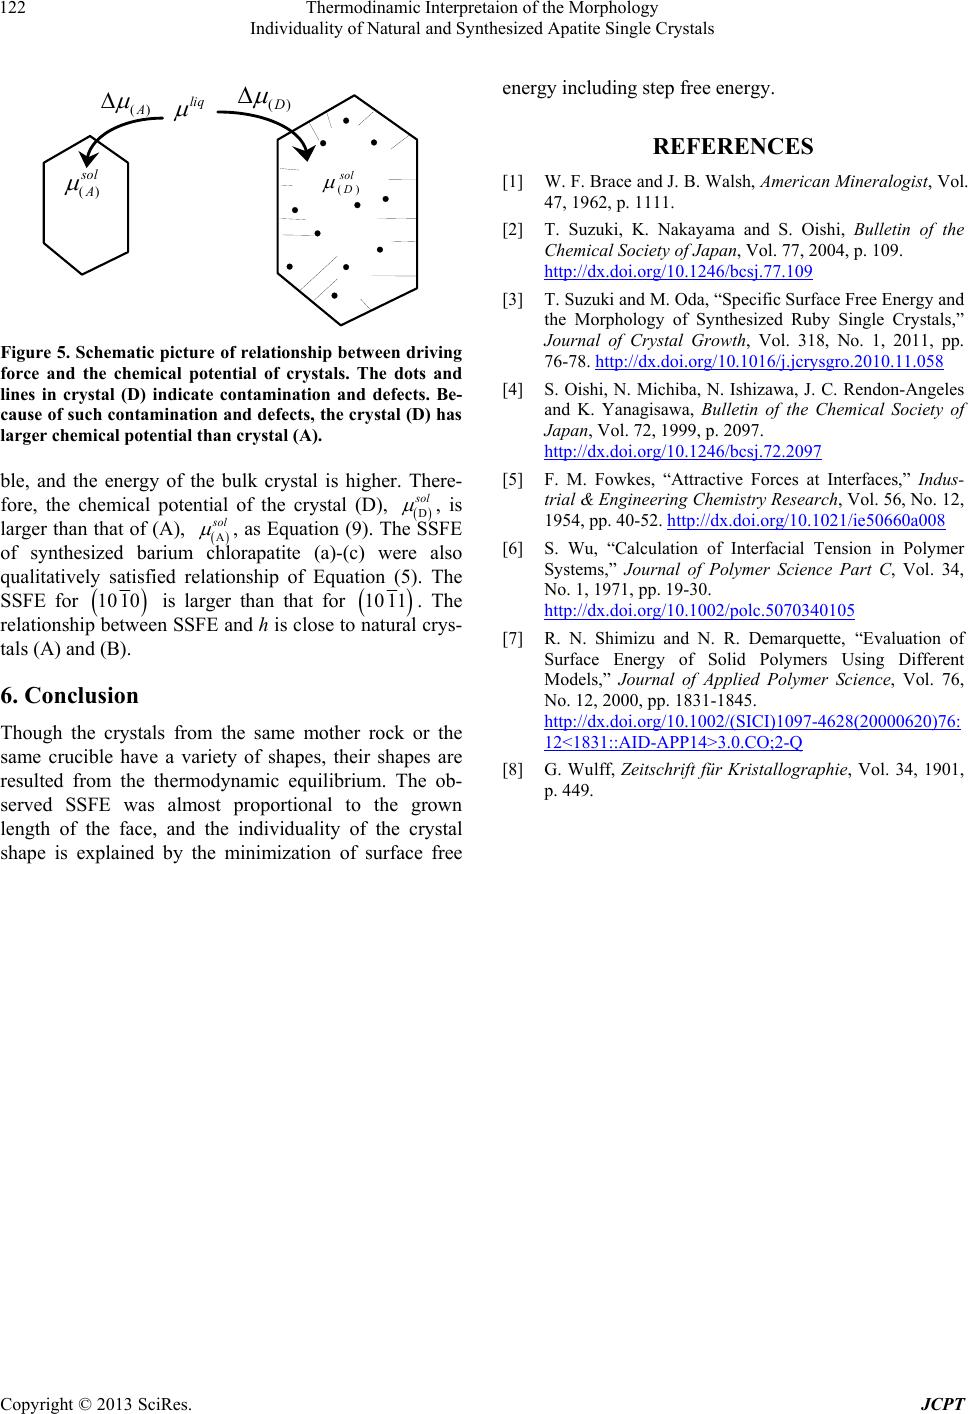 Thermodinamic Interpretaion of the Morphology Individuality of Natural and Synthesized Apatite Single Crystals Copyright © 2013 SciRes. JCPT 122 sol A)( sol D)( liq )(A )(D Figure 5. Schematic pict ure of relationship between driving force and the chemical potential of crystals. The dots and lines in crystal (D) indicate contamination and defects. Be- cause of such contamination and defects, the cry stal (D) has larger chemical potential than crystal (A). ble, and the energy of the bulk crystal is higher. There- fore, the chemical potential of the crystal (D), D s ol , is larger than that of (A), A s ol , as Equation (9). The SSFE of synthesized barium chlorapatite (a)-(c) were also qualitatively satisfied relationship of Equation (5). The SSFE for 1010 is larger than that for 1011 . The relationship between SSFE and h is close to natural crys- tals (A) and (B). 6. Conclusion Though the crystals from the same mother rock or the same crucible have a variety of shapes, their shapes are resulted from the thermodynamic equilibrium. The ob- served SSFE was almost proportional to the grown length of the face, and the individuality of the crystal shape is explained by the minimization of surface free energy including step free energy. REFERENCES [1] W. F. Brace and J. B. Walsh, American Mineralogist, Vol. 47, 1962, p. 1111. [2] T. Suzuki, K. Nakayama and S. Oishi, Bulletin of the Chemical Society of Japan, Vol. 77, 2004, p. 109. http://dx.doi.org/10.1246/bcsj.77.109 [3] T. Suzuki and M. Oda, “Specific Surface Free Energy and the Morphology of Synthesized Ruby Single Crystals,” Journal of Crystal Growth, Vol. 318, No. 1, 2011, pp. 76-78. http://dx.doi.org/10.1016/j.jcrysgro.2010.11.058 [4] S. Oishi, N. Michiba, N. Ishizawa, J. C. Rendon-Angeles and K. Yanagisawa, Bulletin of the Chemical Society of Japan, Vol. 72, 1999, p. 2097. http://dx.doi.org/10.1246/bcsj.72.2097 [5] F. M. Fowkes, “Attractive Forces at Interfaces,” Indus- trial & Engineering Chemistry Research, Vol. 56, No. 12, 1954, pp. 40-52. http://dx.doi.org/10.1021/ie50660a008 [6] S. Wu, “Calculation of Interfacial Tension in Polymer Systems,” Journal of Polymer Science Part C, Vol. 34, No. 1, 1971, pp. 19-30. http://dx.doi.org/10.1002/polc.5070340105 [7] R. N. Shimizu and N. R. Demarquette, “Evaluation of Surface Energy of Solid Polymers Using Different Models,” Journal of Applied Polymer Science, Vol. 76, No. 12, 2000, pp. 1831-1845. http://dx.doi.org/10.1002/(SICI)1097-4628(20000620)76: 12<1831::AID-APP14>3.0.CO;2-Q [8] G. Wulff, Zeitschrift für Kristallographie, Vol. 34, 1901, p. 449. |