

Paper Menu >>
Journal Menu >>
 Energy and Power Engineering, 2013, 5, 423-428 doi:10.4236/epe.2013.54B082 Published Online July 2013 (http://www.scirp.org/journal/epe) Performance analysis of 20 Pole 1.5 KW Three Phase Permanent Magnet Synchronous Generator for low Speed Vertical Axis Wind Turbine* Shahrukh Adnan Khan1, Rajprasad K. Rajkumar1, Rajparthiban K. Rajkumar1, Aravind CV2 1Faculty of Engineering, University of Nottingham Malaysia Campus, Jalan Broga, Semenyih, Malaysia 2School of Engineering, Taylor’s University, Selangor, Malaysia Email: kecx1msa@nottingham.edu.my, Rajprasad.Raj[email protected], Rajparthiban.Rajkumar@nottingham.edu.my [email protected] Received April, 2013 ABSTRACT This paper gives performance analysis of a three phase Permanent Magnet Synchronous Generator (PMSG) connected to a Vertical Axis Wind Turbine (VAWT). Low speed wind condition (less than 5 m/s) is taken in consideration and the entire simulation is carried in Matlab/Simulink environment. The rated power for the generator is fixed at 1.5 KW and number of pole at 20. It is observed under low wind speed of 6 m/s, a turbine having approximately 1 m of radius and 2.6 m of height develops 150 Nm mechanical torque that can generate power up to 1.5 KW. The generator is designed using modeling tool and is fabricated. The fabricated generator is tested in the laboratory with the simulation result for the error analysis. The range of error is about 5%-27% for the same output power value. The limitations and possible causes for error are presented and discussed. Keywords: Vertical Axis Wind Turbine; Three Phase Multi-pole permanent Magnet Synchronous Generator; Low Wind Speed; Modeling; Performance Analysis 1. Introduction Various countries worldwide are aware of the fact that the past and current trends of energy system are not sus- tainable and a solution needs to be drawn to secure the world energy from a drastic falling. One of the sources that can replace the current trend is surely wind energy which greatly depends on the availability of the wind resource. Areas found around the equatorial regions tend to have low wind speeds. For example, Malaysia cur- rently has an average wind speed of 2-3 m/s, with higher wind velocity in the east coast of west Malaysia [1]. For a typical horizontal axis wind turbine to run and generate power, a wind speed of at least 5 m/s is required [2]. A speed that is less than 5 m/s is not sufficient to turn the turbine. Another predicament is that these regions face unsteady multi-directional winds making HAWT totally incompatible in such areas. The vertical axis wind tur- bine (VAWT) on the other hand is appropriate for such regions due to its ability to capture wind energy at any direction. Also, the use neodymium magnets for suspen- sion at the bottom surface assist attaining zero friction, which helps counter the low wind speed problem [2]. Conventional generators can be replaced with Perma- nent Magnet Synchronous Generator (PMSG) using multi- pole stator arrangement. The multi-pole stator arrange- ment can be configured to generate high voltage at low revolution, and high current at faster speeds. The stator is designed to produce negligible cogging torque therefore causing the generator to start up and cut-in at low speeds to produce high current [3]. One significant advantage of PMSG, is that it is much lighter, smaller in size, and uses less constructional material so lowering cost and hub size [2][3]. Although a number of researches in the area of VAWT and PMSG are carried through separately, few attempts were taken to build a system together that work more efficiently at low wind speed. Moreover, there is a significant lack of research to find an optimal multi-pole PMSG for a VAWT with a fixed swept area which is realistic to work in those low wind speed countries. The main objective of this paper is to simulate and inves- tigate the response of a permanent synchronous generator of a vertical wind turbine under different operating sce- nario through in Matlab/ Simulink environment. 2. Methodology The equations of VAWT and PMSG are implemented in SIMULINK and a graphical user interface is developed to aid users in designing the VAWT. For the modeling Copyright © 2013 SciRes. EPE 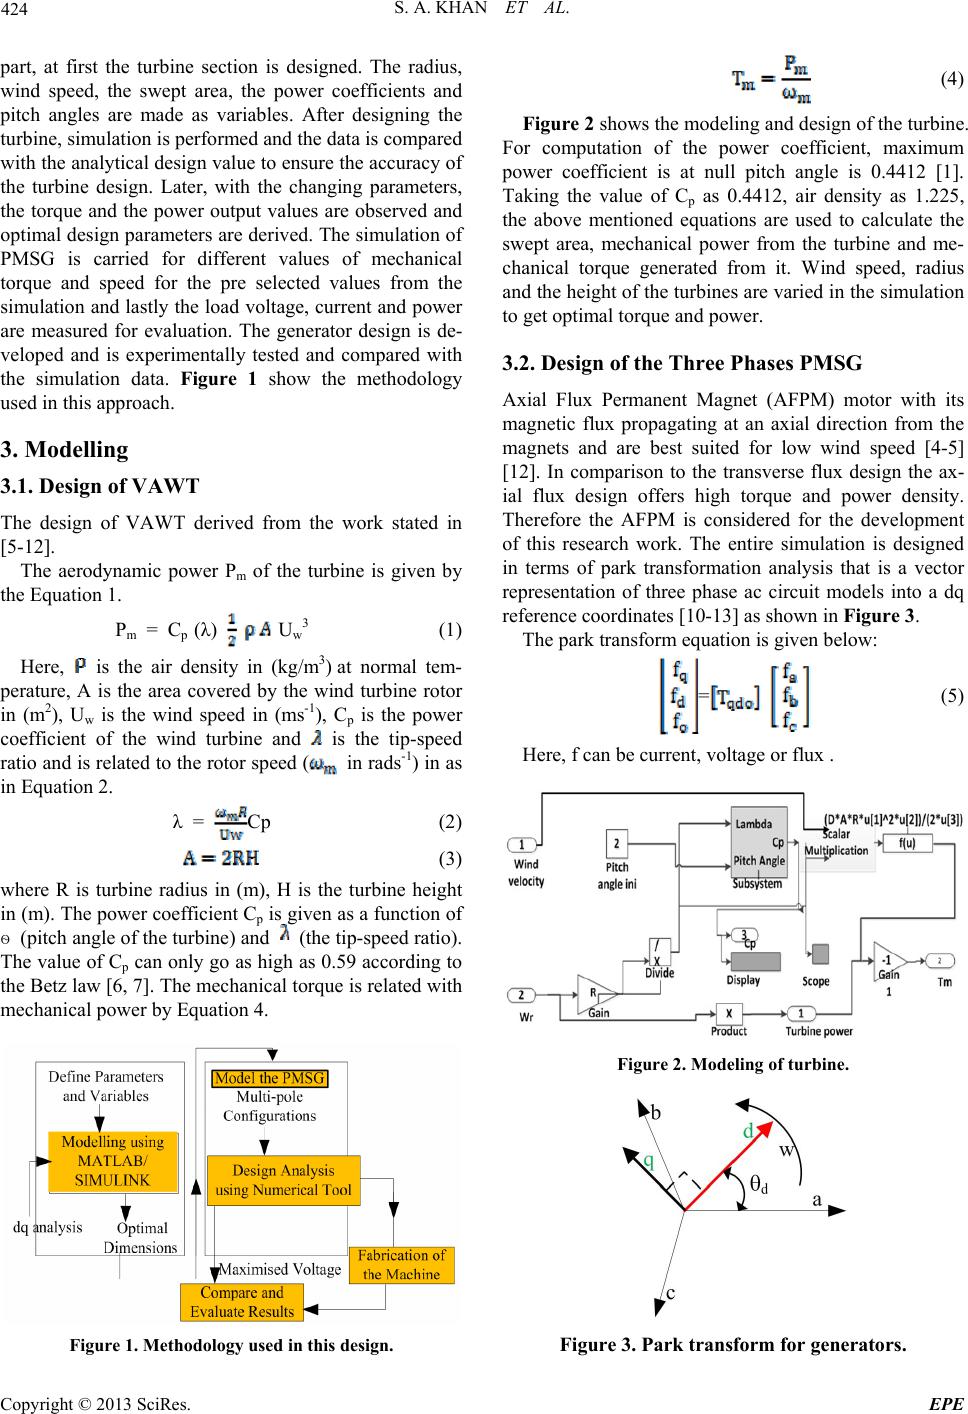 S. A. KHAN ET AL. 424 part, at first the turbine section is designed. The radius, wind speed, the swept area, the power coefficients and pitch angles are made as variables. After designing the turbine, simulation is performed and the data is compared with the analytical design value to ensure the accuracy of the turbine design. Later, with the changing parameters, the torque and the power output values are observed and optimal design parameters are derived. The simulation of PMSG is carried for different values of mechanical torque and speed for the pre selected values from the simulation and lastly the load voltage, current and power are measured for evaluation. The generator design is de- veloped and is experimentally tested and compared with the simulation data. Figure 1 show the methodology used in this approach. 3. Modelling 3.1. Design of VAWT The design of VAWT derived from the work stated in [5-12]. The aerodynamic power Pm of the turbine is given by the Equation 1. Pm = Cp (λ) U w 3 (1) Here, is the air density in (kg/m3) at normal tem- perature, A is the area covered by the wind turbine rotor in (m2), Uw is the wind speed in (ms-1), Cp is the power coefficient of the wind turbine and is the tip-speed ratio and is related to the rotor speed ( in rads-1) in as in Equation 2. λ = Cp (2) (3) where R is turbine radius in (m), H is the turbine height in (m). The power coefficient Cp is given as a function of ѳ (pitch angle of the turbine) and (the tip-speed ratio). The value of Cp can only go as high as 0.59 according to the Betz law [6, 7]. The mechanical torque is related with mechanical power by Equation 4. Figure 1. Methodology used in this design. (4) Figure 2 shows the modeling and design of the turbine. For computation of the power coefficient, maximum power coefficient is at null pitch angle is 0.4412 [1]. Taking the value of Cp as 0.4412, air density as 1.225, the above mentioned equations are used to calculate the swept area, mechanical power from the turbine and me- chanical torque generated from it. Wind speed, radius and the height of the turbines are varied in the simulation to get optimal torque and power. 3.2. Design of the Three Phases PMSG Axial Flux Permanent Magnet (AFPM) motor with its magnetic flux propagating at an axial direction from the magnets and are best suited for low wind speed [4-5] [12]. In comparison to the transverse flux design the ax- ial flux design offers high torque and power density. Therefore the AFPM is considered for the development of this research work. The entire simulation is designed in terms of park transformation analysis that is a vector representation of three phase ac circuit models into a dq reference coordinates [10-13] as shown in Figure 3. The park transform equation is given below: = (5) Here, f can be current, voltage or flux . Figure 2. Modeling of turbine. Figure 3. Park transform for generators. Copyright © 2013 SciRes. EPE 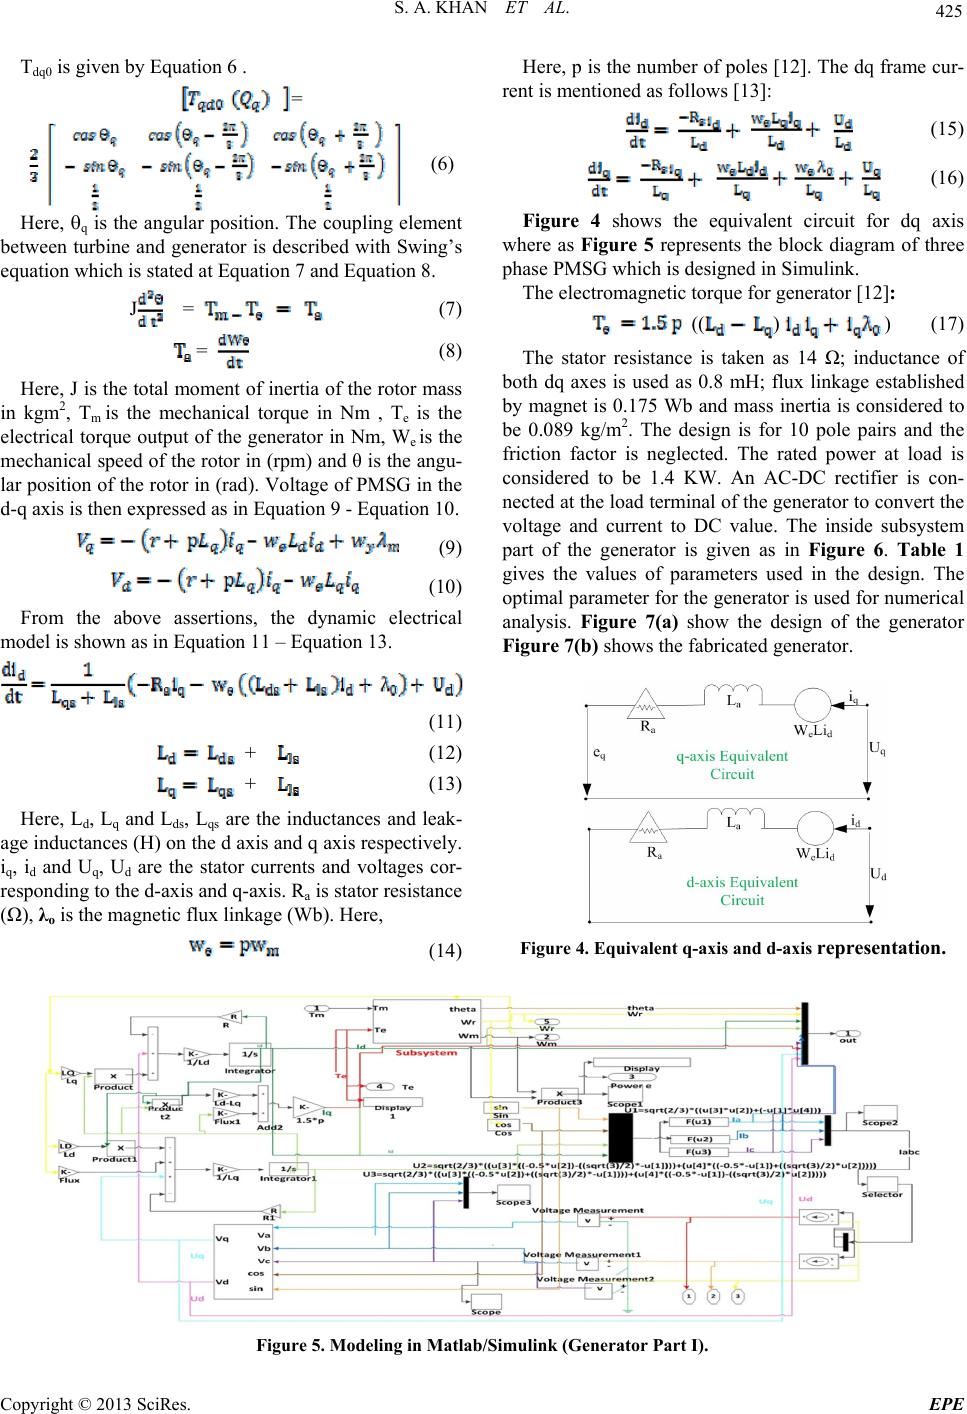 S. A. KHAN ET AL. Copyright © 2013 SciRes. EPE 425 Tdq0 is given by Equation 6 . Here, p is the number of poles [12]. The dq frame cur- rent is mentioned as follows [13]: = (15) (6) (16) Figure 4 shows the equivalent circuit for dq axis where as Figure 5 represents the block diagram of three phase PMSG which is designed in Simulink. Here, q is the angular position. The coupling element between turbine and generator is described with Swing’s equation which is stated at Equation 7 and Equation 8. The electromagnetic torque for generator [12]: J = (7) (()) (17) = (8) The stator resistance is taken as 14 Ω; inductance of both dq axes is used as 0.8 mH; flux linkage established by magnet is 0.175 Wb and mass inertia is considered to be 0.089 kg/m2. The design is for 10 pole pairs and the friction factor is neglected. The rated power at load is considered to be 1.4 KW. An AC-DC rectifier is con- nected at the load terminal of the generator to convert the voltage and current to DC value. The inside subsystem part of the generator is given as in Figure 6. Table 1 gives the values of parameters used in the design. The optimal parameter for the generator is used for numerical analysis. Figure 7(a) show the design of the generator Figure 7(b) shows the fabricated generator. Here, J is the total moment of inertia of the rotor mass in kgm2, Tm is the mechanical torque in Nm , Te is the electrical torque output of the generator in Nm, We is the mechanical speed of the rotor in (rpm) and θ is the angu- lar position of the rotor in (rad). Voltage of PMSG in the d-q axis is then expressed as in Equation 9 - Equation 10. (9) (10) From the above assertions, the dynamic electrical model is shown as in Equation 11 – Equation 13. (11) + (12) + (13) Here, Ld, Lq and Lds, Lqs are the inductances and leak- age inductances (H) on the d axis and q axis respectively. iq, id and Uq, Ud are the stator currents and voltages cor- responding to the d-axis and q-axis. Ra is stator resistance (Ω), λo is the magnetic flux linkage (Wb). Here, Figure 4. Equivalent q-axis and d-axis representation. (14) Figure 5. Modeling in Matlab/Simulink (Generator Part I). 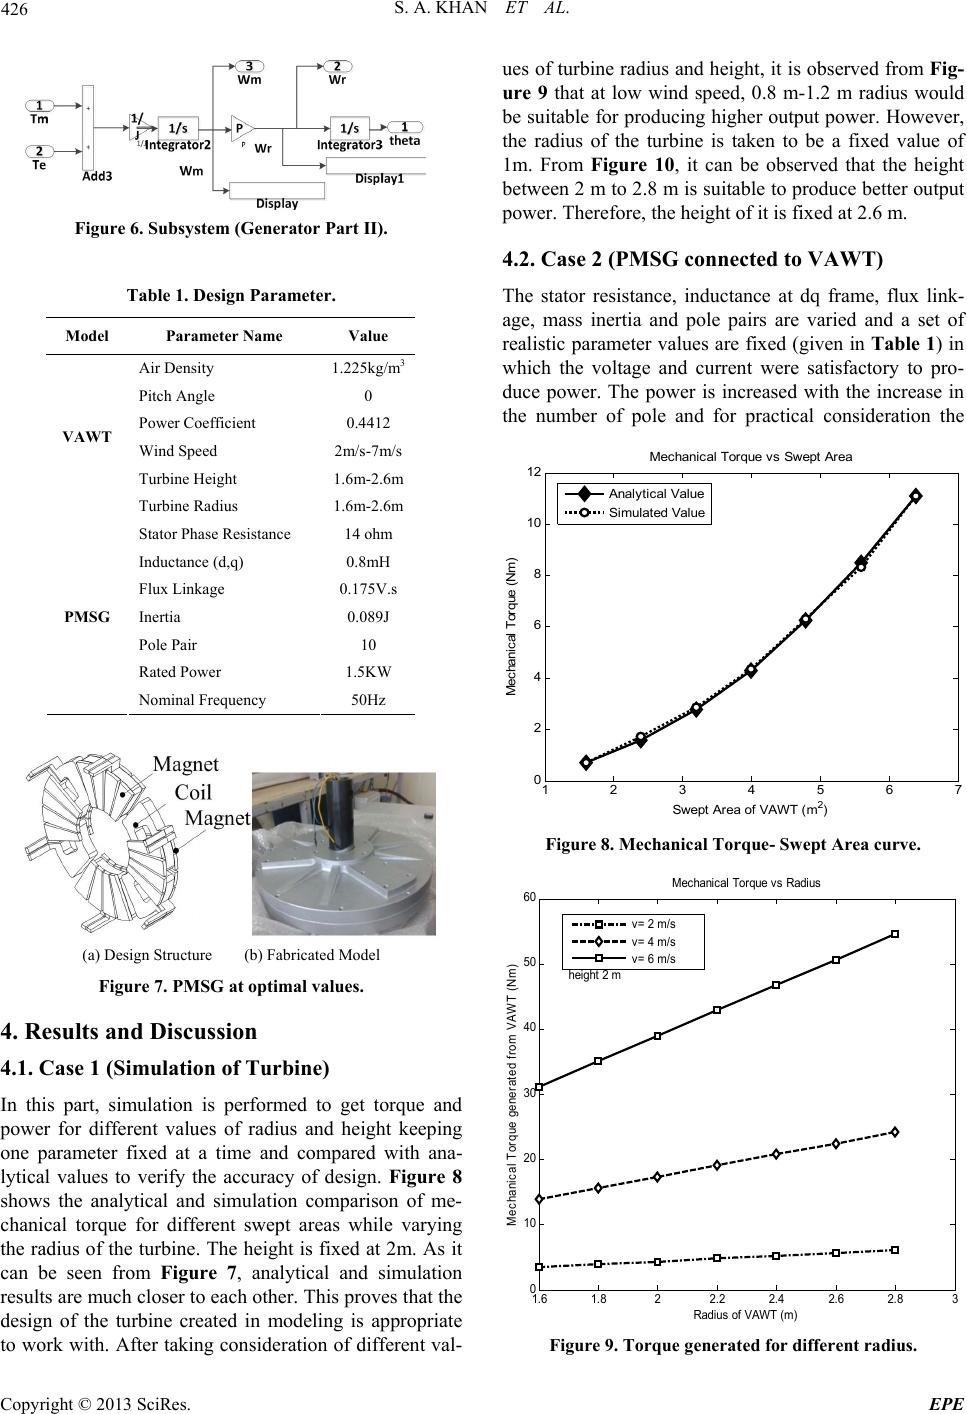 S. A. KHAN ET AL. 426 Figure 6. Subsystem (Generator Part II). Table 1. Design Parameter. Model Parameter Name Value Air Density 1.225kg/m3 Pitch Angle 0 Power Coefficient 0.4412 Wind Speed 2m/s-7m/s Turbine Height 1.6m-2.6m VAWT Turbine Radius 1.6m-2.6m Stator Phase Resistance 14 ohm Inductance (d,q) 0.8mH Flux Linkage 0.175V.s Inertia 0.089J Pole Pair 10 Rated Power 1.5KW PMSG Nominal Frequency 50Hz (a) Design Structure (b) Fabricated Model Figure 7. PMSG at optimal values. 4. Results and Discussion 4.1. Case 1 (Simulation of Turbine) In this part, simulation is performed to get torque and power for different values of radius and height keeping one parameter fixed at a time and compared with ana- lytical values to verify the accuracy of design. Figure 8 shows the analytical and simulation comparison of me- chanical torque for different swept areas while varying the radius of the turbine. The height is fixed at 2m. As it can be seen from Figure 7, analytical and simulation results are much closer to each other. This proves that the design of the turbine created in modeling is appropriate to work with. After taking consideration of different val- ues of turbine radius and height, it is observed from Fig- ure 9 that at low wind speed, 0.8 m-1.2 m radius would be suitable for producing higher output power. However, the radius of the turbine is taken to be a fixed value of 1m. From Figure 10, it can be observed that the height between 2 m to 2.8 m is suitable to produce better output power. Therefore, the height of it is fixed at 2.6 m. 4.2. Case 2 (PMSG connected to VAWT) The stator resistance, inductance at dq frame, flux link- age, mass inertia and pole pairs are varied and a set of realistic parameter values are fixed (given in Table 1) in which the voltage and current were satisfactory to pro- duce power. The power is increased with the increase in the number of pole and for practical consideration the 12 3 4 5 6 7 0 2 4 6 8 10 12 Swept Area of VAW T (m 2 ) Mechanical Torque (Nm) Mechanical T orque v s Swept Area Analytical Value Si mulated Val ue Figure 8. Mechanical Torque- Swept Area curve. 1.6 1.8 22.2 2.4 2.6 2.83 0 10 20 30 40 50 60 Radius of VAW T ( m ) Mec hanic al Tor que generated fr om V AW T (N m ) Mechani cal Torque vs Ra dius v= 2 m/s v= 4 m/s v= 6 m/s hei g ht 2 m Figure 9. Torque generated for different radius. Copyright © 2013 SciRes. EPE  S. A. KHAN ET AL. 427 number of pole pair is fixed at 10. Figure 11 evolved by changing the mechanical torque for different wind speed and keeping the generator parameter fixed at optimal value. The load power is measured to make sure that the generator is able to produce adequate output power for a range of torque at low wind speed. 4.3. Case 3 (Hardware Testing) The developed generator is experimentally tested at la- boratory and the results are compared with that of the simulation value. Figure 12 - Figure 14 shows theoreti- cal and experimental comparisons for a fixed wind speed of 6 m/s. Wind speed is taken as high value in order to investigate the difference in value accurately. The experimental values are quite identical with simu- lation indicating the accuracy of the simulation design. The simulation power values for different speed and mechanical torque are higher than experimental values. This is due to power loss for friction factor as it is ne- glected in the simulation. 1.6 1.8 22.22.42.6 2.83 0 10 20 30 40 50 60 70 80 90 100 Hei ght of VAWT (m) M ec hanic al Tor que generat ed fr om V AW T (N m ) Mechanical Torque vs Height v= 2 m/s v= 4 m/s v= 6 m/s radius 1m Figure 10. Torque generated for different heights. 020 40 6080100 120 140 160 180 0 500 1000 1500 2000 2500 Mechanical Tor que (Nm) Load Power (W) Power vs Torque v= 7m/s v= 6m/s v= 5m/s v= 4m/s v= 3m/s Figure 11. Graph of Power values at the load for different mechanical torque. 020 40 60 80 100 0 50 100 150 200 250 300 350 400 Rot ational Speed (RPM ) Load Voltage (V=RM S) Vol tage v s RPM Si m ul ated Data Generator Testing Data Figure 12. Voltage- Rotational Speed (RPM) curve. 020 4060 80100 0 200 400 600 800 1000 1200 1400 1600 1800 2000 Rot ational Sp eed (RPM) Load Power (W) Power v s RPM Simul at ed Value Generated Value Figure 13. Power- Rotational Speed (RPM) curve. 020406080100 120 140 160 18 0 0 200 400 600 800 1000 1200 1400 1600 1800 2000 Mechanical Torque (N m ) Load Pow er (W ) Power vs Torque Simulated Data Gener ator Tes ting Dat a Figure 14. Power- Torque curve. 5. Conclusions An optimal system is built for low level wind speed. The VAWT simulation produces torque and power with an estimated error of ion ranging from 0.05%-10% accord- ing to Table 2. After running several stages of simulation, Copyright © 2013 SciRes. EPE  S. A. KHAN ET AL. Copyright © 2013 SciRes. EPE 428 the swept area is Table 2. Error Estimation of VAWT. Mechanical Torque [Nm] Swept Area [m2] Theoretical Simulation Error [%] 1.6 0.68 0.7 2.9 2.4 1.557 1.7 9.18 3.2 2.76 2.84 2.9 4 4.29 4.324 0.8 4.8 6.226 6.3 1.18 5.6 8.474 8.3 2.05 6.4 11.069 11.074 0.05 Table 3. Error Estimation of PMSG. Load Power MechanicalTorque(Nm) Simulation Experimental Error (%) 52 148 126 14.90 68.6 284 240 15.49 83.4 416 367 11.81 100.2 586 534 8.81 116.9 817 733 10.23 132.9 1004 956 4.79 149.2 1262 1209 4.19 165.8 1878 1500 20.13 fixed at 5.2 m2 having fixed the radius and height of the turbine to 1 m and 2.6 m respectively. For the generator part, the simulation data is gathered for different values of torque from the turbine; the design is built in CFD and sent to a manufacturing company. Upon arrival, the gen- erator is tested and load voltage and power were meas- ured for different set of values of RPM and Torque. As it can be seen in Table 3, there were differences while cal- culating the error (5%- 27%) for load power. It is due to the friction factor and stator inductance difference. This VAWT with PMSG can make a significant impact for low level wind situation in which Malaysia and so many other countries stand. 6. Acknowledgements The project is funded by the Ministry of Higher Educa- tion (MOHE) of Malaysia under the ERGS grant. REFERENCES [1] Zaharim, S. K. Najid, A. M. Razali and K. Sopian “Wind Speed Analysis in the East Coast of Malaysia,” European Journal of Scientific Research, Vol. 32, No. 2, 2009, pp. 208-215. [2] R. Bharanikumar, A. C. Yazhini and N. Kumar, “Model- ling and Simulation of Wind Turbine Driven Permanent magnet Generator with New MPPT Algorithm,” Asian Power electronics journal, Vol. 4, 2012. [3] W. Fei and P. I. Luk, “A New Technique of Cogging Torque Suppression in Direct-Drive Permanent-Magnet Brushless Machines,” IEEE Transactions on Industry Applications, Vol. 46, No.4, 2010, pp. 1332-1340. doi:10.1109/TIA.2010.2049551 [4] P. C. Krause, O. Wasynczuk and S. D. Sudho. “Analysis of Electric Machinery and Drive Systems,” Wiley & Sons, 2002. doi:10.1109/9780470544167 [5] C. V. Aravind, Rajparthiban, Rajprasad and Y. V. Wong “A Novel Magnetic Levitation Assisted Vertical Axis Wind Turbine- design and Procedure,” IEEE Colloquium on Signal Processing and its Applications , Melacca, Ma- laysia CSPA 2012 [6] J A.M. De Broe, S. Drouilllet and V. Oevorglan, “A Peak power Tracker for Small Wind Turbines in Battery Charging Applications,” IEEE Transactions on Energy Conv., Vol. 14, No. 4, Dec. 1999, pp. 1630-1635. doi:10.1109/60.815116 [7] J. D. M. Whaley, W. L. Soongand and N. Ertugrul, "In- vestigation of Switched-Mode Rectifier for Control of Small-Scale Wind Turbines," Intl’ Conference Proceed. of IEEE-IAS Annual Meeting, Vol. 4, 2005, pp. 2849-2856. [8] S. Belakehal, H. Benalla and A. Bentounsi, “Power Maximization of Small Wind System using Permanent magnet Synchronous Generator” Revue des energies Re- nouvelables, Vol. 12, No. 2 ,2009, pp. 307-319. [9] J. G. SIootweg, H. Pollnder and W. L. Kling, “Repre- senting Wind Turbine Electrical Generating Systems in Fundamental Frequency Simulations," IEEE Trans. En- ergy Convr, Vol. 18, No. 4, Dec. 2003, pp. 516-524. [10] A. G. Westlake, J. R. Bumby and E. Spooner, "Damping the Power-angle Oscillations of a Permanent Magnet Synchronous Generator with Particular to Wind Applica- tions," Proc. Ekct. Power Appl., Vol. 143, No. 3, May1996, pp. 269-280. doi:10.1049/ip-epa:19960285 [11] C. Busca, A. Stan, T. Stanciu and D. I. Stroe “Control of Permanent Magnet Synchronous of Large Wind Tur- bines,” Denmark : Departament of Energy Technology: Aalborg University, November 2010, Industrial Elec- tronics (ISIE), pp. 3871-3876. [12] M. Yin, G. Y. Li, M. Zhou and C. Y. Zhao, "Modeling of the Wind Turbine with a Permanent Magnet Synchro- nous Generator for Integration," Power Engineering So- ciety General Meeting, 2007, pp.1-6. [13] K. Tan and S. Islam, "Optimum Control Strategies in Energy Conversion of PMSG Wind Turbine System without Mechanical Sensors," Energy Conversion, IEEE Transactions on, Vol. 19, No. 2, June 2007, pp. 392- 399. doi:10.1109/TEC.2004.827038 |