

Paper Menu >>
Journal Menu >>
 Journal of Signal and Information Processing, 2013, 4, 164-167 doi:10.4236/jsip.2013.43B029 Published Online August 2013 (http://www.scirp.org/journal/jsip) Comparison of Wavelet Types and Thresholding Methods on Wavelet Based Denoising of Heart Sounds Burhan Ergen Department of Computer Engineering, Firat University, Elazig, Turkey. Email: [email protected] Received April, 2013. ABSTRACT This paper focuses on the denoising of phonocardiogram (PCG) signals by means of discrete wavelet transform (DWT) using different wavelets and noise level estimation methods. The signal obtained by denoising from PCG signal con- taminated white noise and the original PCG signal is compared to determine the appropriate parameters for denoising. The comparison is evaluated in terms of signal to noise ratio (SNR) before and after denoising . The results showed that the decomposition lev el is the most important parameter determining the denoising quality. Keywords: Discrete Wavelet Transform; Denoising; PCG 1. Introduction The structural defects of the heart are often reflected on the acoustical vibrations produced as a result of the me- chanical action of the heart. The proper analysis of heart sound allows non-invasive detection of coronary artery stenosis, and valve disorders causing the heart murmurs [1]. It is possible a computer aided detection of the ab- normalities by means of processing and analyzing of the acoustical vibration [2]. A record of the acoustical vibra- tions acquired by means of microphones, called phono- cardiogram (PCG), consist of the heart sounds and the murmurs. While the heart sounds are produced opening and closing of the heart valves, the murmurs are pro- duced by the turbulence of blood flow. The heart sounds have low frequency components, and the murmurs are high frequency signals occurring gener- ally between heart sounds. The murmurs can be com- monly heard in abnormal cardiovascular cases. The fre- quency components of a PCG signal may achieve around 1 KHz, which seen particularly in abnormal patient due to the murmurs. On contrary healthy person, the fre- quency components can exist above 300 Hz in diseased patients. In normal patients, the spectral energy exists in the interval of 100 and 200Hz, and rarely reaches up 300Hz [3]. This noise decreases the performance of visual and computerized analysis. The respiration sounds by lung mechanical actions, patient movement, and improper contacts of microphone to the skin, and external noises from the environments are also added as noise signal into PCG records. The traditional method to remove the noise from a PCG signal is to use a low or band pass filter with cut off frequencies. However the filtering techniques are able to remove a relevant of the noise, they are incapable if the noise in the band of the signal to be analyzed. In the present study, we performed the discrete wave- let transform (DWT) to overcome the limitations of the traditional methods. The denoising based on DWT is consist of three steps; decomposition of the signal, thre- sholding and reconstruction of the signal. Hard and soft thresholding approaches are usually applied to eliminate of small coefficient in denoi sing process. In the hard thresholding, the wavelet coefficient below a give value are stetted to zero, while in soft thresholding the wavelet coefficient are reduced be a quantity to the thresh value. The thresh old value is the estimation of th e noise level, which is generally calculated from the stan- dard derivation of the detail coefficient. The given signal is decomposed on to a set of orthonormal wavelet func- tion that constitutes a wavelet basis. The most known wavelets providing the ortogonality properties are Du- bechies, Symlets, Coiflets and Discrete Meyer to provide reconstruction using the fast algorithms. The result of the DWT is a multilevel decomposition, in which the signal is decomposed in ‘approximation’ and ‘detail’ coefficients at each level. This is made through a process that is equivalent to low-pass and high passes filtering, respectively [4]. DWT decomposition leads to a tree structure as shown in Figure 1, where ap- proximation and detail coefficients are presented. Here, it is studied on the effects of wavelet types, de- Copyright © 2013 SciRes. JSIP 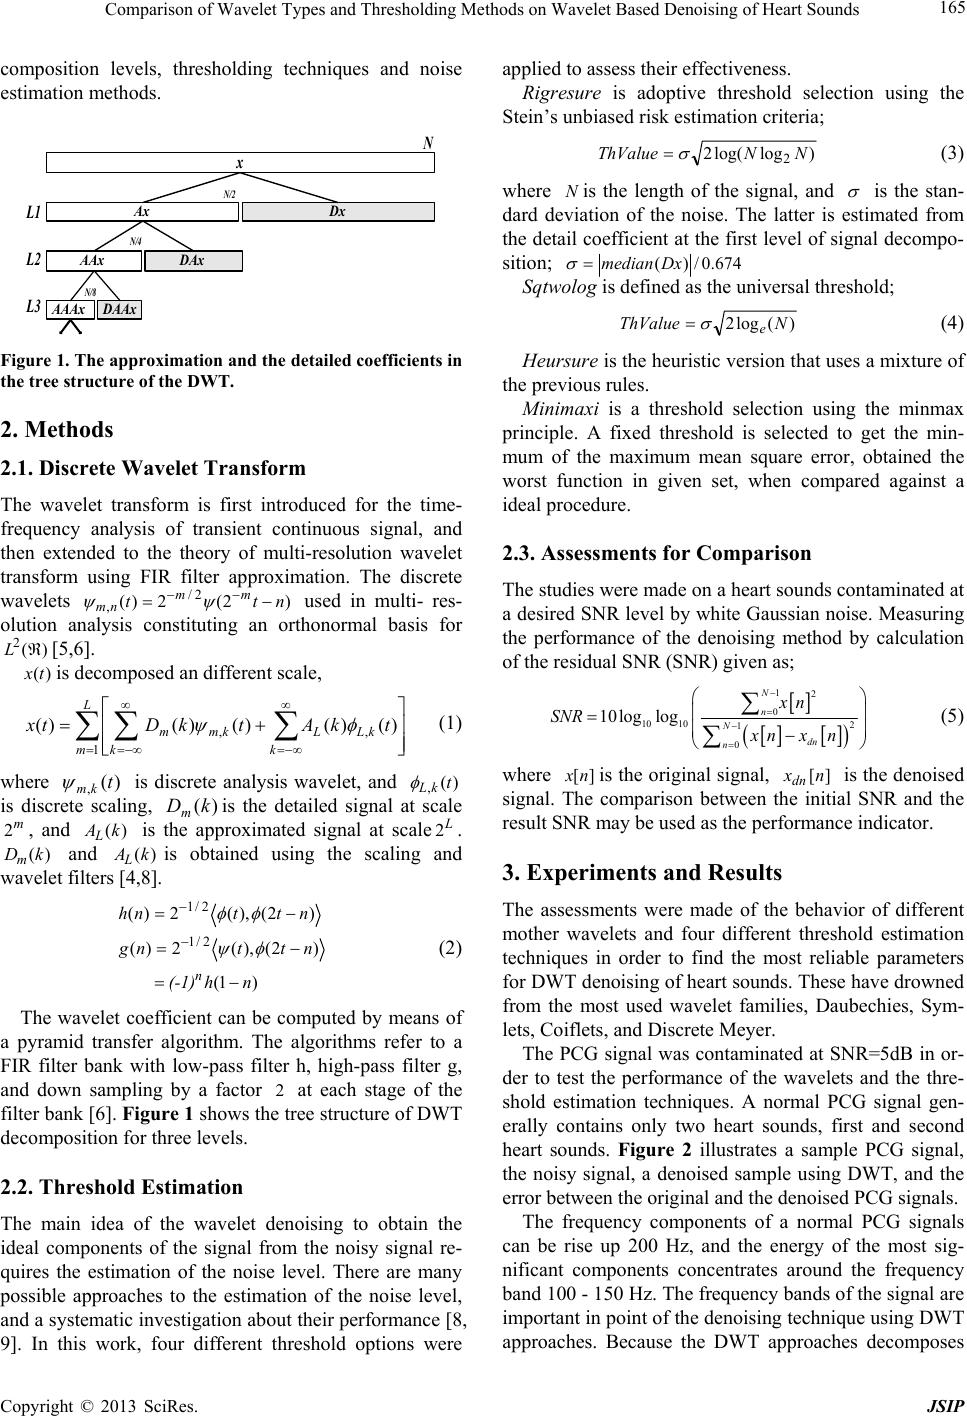 Comparison of Wavelet Types and Thresholding Methods on Wavelet Based Denoising of Heart Sounds 165 composition levels, thresholding techniques and noise estimation method s. x Ax AAx AAAx DAAx DAx Dx L1 L2 L3 N N/2 N/4 N/8 Figure 1. The approximation and the detailed coefficients in the tree structure of the DWT. 2. Methods 2.1. Discrete Wavelet Transform The wavelet transform is first introduced for the time- frequency analysis of transient continuous signal, and then extended to the theory of multi-resolution wavelet transform using FIR filter approximation. The discrete wavelets used in multi- res- olution analysis constituting an orthonormal basis for [5,6]. )2(2)( 2/ ,ntt mm nm )( 2L)(txis decomposed an different scale, L mk k kLLkmm tkAtkDtx 1,, )()()()()( (1) where )( ,t km is discrete analysis wavelet, and )( ,t kL is discrete scaling, is the detailed signal at scale , and is the approximated signal at scale. and is obtained using the scaling and wavelet filters [4,8]. )(kDm m 2(Dm )(kALAL L 2 )k)k( )1( )2(),(2)( )2(),(2)( 2/1 2/1 nh(-1) nttng nttnh n (2) The wavelet coefficient can be computed by means of a pyramid transfer algorithm. The algorithms refer to a FIR filter bank with low-pass filter h, high-pass filter g, and down sampling by a factor at each stage of the filter bank [6]. Figure 1 shows the tree structure of DWT decomposition for three levels. 2 2.2. Threshold Estimation The main idea of the wavelet denoising to obtain the ideal components of the signal from the noisy signal re- quires the estimation of the noise level. There are many possible approaches to the estimation of the noise level, and a systematic investigation about their performance [8, 9]. In this work, four different threshold options were applied to assess their effectiveness. Rigresure is adoptive threshold selection using the Stein’s unbiase d ri sk estimation criteria; )loglog(2 2NNThValue (3) where is the length of the signal, and N is the stan- dard deviation of the noise. The latter is estimated from the detail coefficient at the first level of signal decompo- sition; 674.0/)(Dxmedian Sqtwolog is defined as the universal threshold; )(log2 NThValue e (4) Heursure is the heuristic version that uses a mixture of the previous rules. Minimaxi is a threshold selection using the minmax principle. A fixed threshold is selected to get the min- mum of the maximum mean square error, obtained the worst function in given set, when compared against a ideal procedure. 2.3. Assessments for Comparison The studies were made on a heart sounds contaminated at a desired SNR level by white Gaussian noise. Measuring the performance of the denoising method by calculation of the residual SNR (SNR) gi ven as; 0 12 10 12 0 01 10log logn N N dn n xn SNR xnx n (5) where is the original sign al, is the denoised signal. The comparison between the initial SNR and the result SNR may be used as the performance indicator. ][nx ][nxdn 3. Experiments and Results The assessments were made of the behavior of different mother wavelets and four different threshold estimation techniques in order to find the most reliable parameters for DWT denoising of heart so unds. These hav e drowned from the most used wavelet families, Daubechies, Sym- lets, Coiflets, and Discrete Meyer. The PCG signal was contaminated at SNR=5dB in or- der to test the performance of the wavelets and the thre- shold estimation techniques. A normal PCG signal gen- erally contains only two heart sounds, first and second heart sounds. Figure 2 illustrates a sample PCG signal, the noisy signal, a denoised sample using DWT, and the error between the original and the denoised PCG signals. The frequency components of a normal PCG signals can be rise up 200 Hz, and the energy of the most sig- nificant components concentrates around the frequency band 100 - 150 Hz. The frequency ban ds of the signal are important in point of the denoising technique using DWT approaches. Because the DWT approaches decomposes Copyright © 2013 SciRes. JSIP 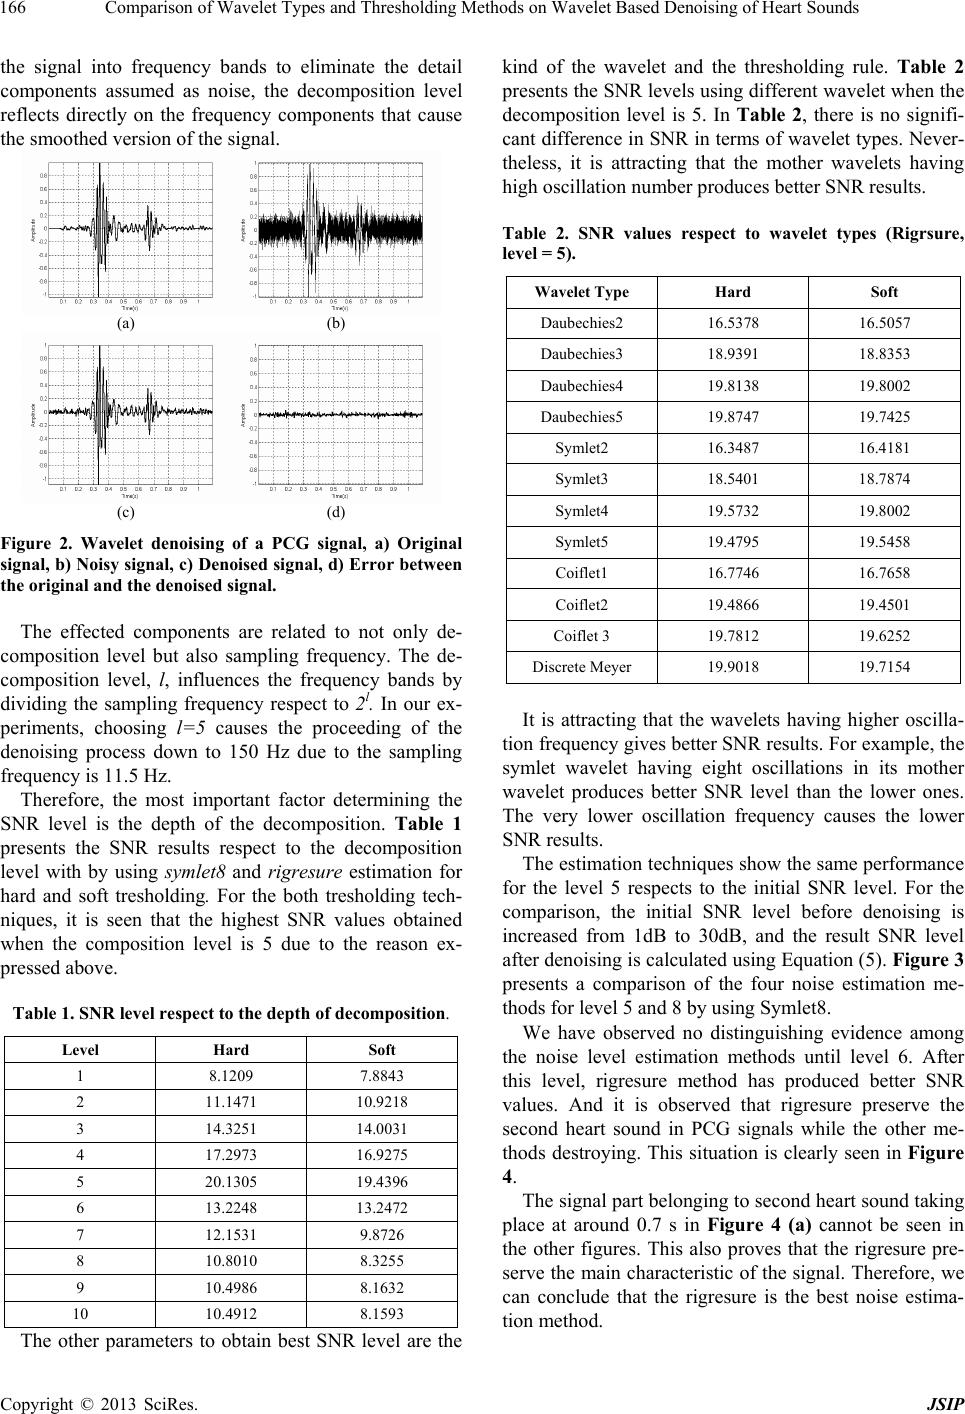 Comparison of Wavelet Types and Thresholding Methods on Wavelet Based Denoising of Heart Sounds 166 the signal into frequency bands to eliminate the detail components assumed as noise, the decomposition level reflects directly on the frequency components that cause the smoothed version of the signal. (a) (b) (c) (d) Figure 2. Wavelet denoising of a PCG signal, a) Original signal, b) Noisy signal, c) Denoised signal, d) Error between the original and the denoised signal. The effected components are related to not only de- composition level but also sampling frequency. The de- composition level, l, influences the frequency bands by dividing the sampling frequency respect to 2l. In our ex- periments, choosing l=5 causes the proceeding of the denoising process down to 150 Hz due to the sampling frequency is 11.5 Hz. Therefore, the most important factor determining the SNR level is the depth of the decomposition. Table 1 presents the SNR results respect to the decomposition level with by using symlet8 and rigresure estimation for hard and soft tresholding. For the both tresholding tech- niques, it is seen that the highest SNR values obtained when the composition level is 5 due to the reason ex- pressed above. Table 1. SNR level respect to the depth of decomposition. Level Hard Soft 1 8.1209 7.8843 2 11.1471 10.9218 3 14.3251 14.0031 4 17.2973 16.9275 5 20.1305 19.4396 6 13.2248 13.2472 7 12.1531 9.8726 8 10.8010 8.3255 9 10.4986 8.1632 10 10.4912 8.1593 The other parameters to obtain best SNR level are the kind of the wavelet and the thresholding rule. Table 2 presents the SNR leve ls using different wavelet when the decomposition level is 5. In Table 2, there is no signifi- cant difference in SNR in terms of wavelet type s. Never- theless, it is attracting that the mother wavelets having high oscillation number produces better SNR results. Table 2. SNR values respect to wavelet types (Rigrsure, level = 5). Wavelet Type Hard Soft Daubechies2 16.5378 16.5057 Daubechies3 18.9391 18.8353 Daubechies4 19.8138 19.8002 Daubechies5 19.8747 19.7425 Symlet2 16.3487 16.4181 Symlet3 18.5401 18.7874 Symlet4 19.5732 19.8002 Symlet5 19.4795 19.5458 Coiflet1 16.7746 16.7658 Coiflet2 19.4866 19.4501 Coiflet 3 19.7812 19.6252 Discrete Meyer 19.9018 19.7154 It is attracting that the wavelets having higher oscilla- tion frequency gives better SNR results. For example, the symlet wavelet having eight oscillations in its mother wavelet produces better SNR level than the lower ones. The very lower oscillation frequency causes the lower SNR results. The estimation techniques show the same performance for the level 5 respects to the initial SNR level. For the comparison, the initial SNR level before denoising is increased from 1dB to 30dB, and the result SNR level after denoising is calculated using Equation (5). Figure 3 presents a comparison of the four noise estimation me- thods for level 5 and 8 by using Symlet8. We have observed no distinguishing evidence among the noise level estimation methods until level 6. After this level, rigresure method has produced better SNR values. And it is observed that rigresure preserve the second heart sound in PCG signals while the other me- thods destroying. This situation is clearly seen in Figure 4. The signal part belonging to second heart sound taking place at around 0.7 s in Figure 4 (a) cannot be seen in the other figures. This also proves that the rigresure pre- serve the main characteristic of the signal. Therefore, we can conclude that the rigresure is the best noise estima- tion method. Copyright © 2013 SciRes. JSIP 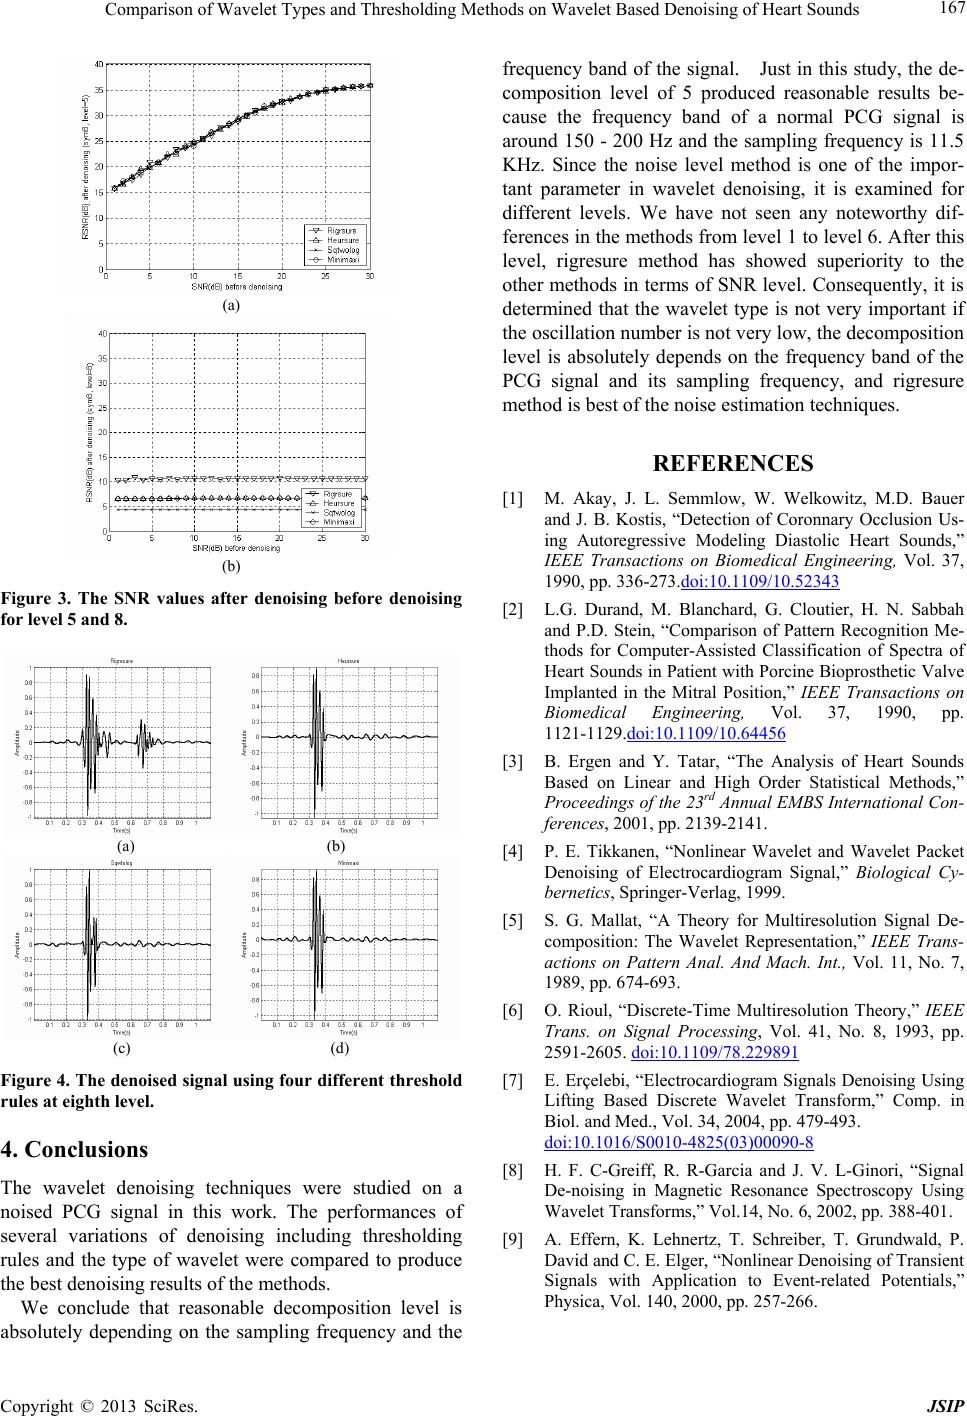 Comparison of Wavelet Types and Thresholding Methods on Wavelet Based Denoising of Heart Sounds Copyright © 2013 SciRes. JSIP 167 (a) (b) Figure 3. The SNR values after denoising before denoising for level 5 and 8. (a) (b) (c) (d) Figure 4. The denoised signal using four different threshold rules at eighth level. 4. Conclusions The wavelet denoising techniques were studied on a noised PCG signal in this work. The performances of several variations of denoising including thresholding rules and the type of wavelet were compared to produce the best denoising results of the methods. We conclude that reasonable decomposition level is bsolutely depending on the sampling frequency and the frequency band of the signal. Just in this study, the de- composition level of 5 produced reasonable results be- cause the frequency band of a normal PCG signal is around 150 - 200 Hz and the sampling frequency is 11.5 KHz. Since the noise level method is one of the impor- tant parameter in wavelet denoising, it is examined for different levels. We have not seen any noteworthy dif- ferences in the methods from level 1 to level 6. After this level, rigresure method has showed superiority to the other methods in terms of SNR level. Consequently, it is determined that the wavelet type is not very important if the oscillation number is not very low, th e decomposition level is absolutely depends on the frequency band of the PCG signal and its sampling frequency, and rigresure method is best of the noise estimation techniques. REFERENCES [1] M. Akay, J. L. Semmlow, W. Welkowitz, M.D. Bauer and J. B. Kostis, “Detection of Coronnary Occlusion Us- ing Autoregressive Modeling Diastolic Heart Sounds,” IEEE Transactions on Biomedical Engineering, Vol. 37, 1990, pp. 336-273.doi:10.1109/10.52343 [2] L.G. Durand, M. Blanchard, G. Cloutier, H. N. Sabbah and P.D. Stein, “Comparison of Pattern Recognition Me- thods for Computer-Assisted Classification of Spectra of Heart Sounds in Patient with Porcine Bioprosthetic Valve Implanted in the Mitral Position,” IEEE Transactions on Biomedical Engineering, Vol. 37, 1990, pp. 1121-1129.doi:10.1109/10.64456 [3] B. Ergen and Y. Tatar, “The Analysis of Heart Sounds Based on Linear and High Order Statistical Methods,” Proceedings of the 23rd Annual EMBS International Con- ferences, 2001, pp. 2139-2141. [4] P. E. Tikkanen, “Nonlinear Wavelet and Wavelet Packet Denoising of Electrocardiogram Signal,” Biological Cy- bernetics, Springer-Verlag, 1999. [5] S. G. Mallat, “A Theory for Multiresolution Signal De- composition: The Wavelet Representation,” IEEE Trans- actions on Pattern Anal. And Mach. Int., Vol. 11, No. 7, 1989, pp. 674-693. [6] O. Rioul, “Discrete-Time Multiresolution Theory,” IEEE Trans. on Signal Processing, Vol. 41, No. 8, 1993, pp. 2591-2605. doi:10.1109/78.229891 [7] E. Erçelebi, “Electrocardiogram Signals Denoising Using Lifting Based Discrete Wavelet Transform,” Comp. in Biol. and Med., Vol. 34, 2004, pp. 479-493. doi:10.1016/S0010-4825(03)00090-8 [8] H. F. C-Greiff, R. R-Garcia and J. V. L-Ginori, “Signal De-noising in Magnetic Resonance Spectroscopy Using Wavelet Transforms,” Vol.14, No. 6, 2002, pp. 388-401. [9] A. Effern, K. Lehnertz, T. Schreiber, T. Grundwald, P. David and C. E. Elger, “Nonlinear Denoising of Transient Signals with Application to Event-related Potentials,” Physica, Vol. 140, 2000, pp. 257-266. a |