

Paper Menu >>
Journal Menu >>
 Journal of Signal and Information Processing, 2013, 4, 36-42 doi:10.4236/jsip.2013.43B007 Published Online August 2013 (http://www.scirp.org/journal/jsip) Liver Segmentation from CT Image Using Fuzzy Clustering and Level Set Xuechen Li1, Suhuai Luo1, Jiaming Li2 1The University of Newcastle, Australia; 2The CSIRO ICT Centre, Australia. Email: [email protected] Received April, 2013. ABSTRACT This paper presents a fully automatic segmentation method of liver CT scans using fuzzy c-mean clustering and level set. First, the contrast of original image is enhanced to make boundaries clearer; second, a spatial fuzzy c-mean cluster- ing combining with anatomical prior knowledge is employed to extract liver region automatically; thirdly, a distance regularized level set is used for refinement; finally, morphological operations are used as post-processing. The experi- ment result shows that the method can achieve high accuracy (0.9986) and specificity (0.9989). Comparing with stan- dard level set method, our method is more effective in dealing with over-segmentation problem. Keywords: Liver Segmentation; Fuzzy c-Mean Clustering; Level Set 1. Introduction Liver segmentation from CT images is the key prepara- tion work for the establishment of three dimension model of liver, which has great significance on the diagnosis of liver disease. A variety of liver CT image segmentation methods have been proposed. These methods include region growing [1-3], level set [4-6], clustering [7, 8], statistic shape model [9], neural network [7] and support vector machine (SVM) [10-12], etc. The following briefs these progresses. Ruskó et al. [1] presented an adaptive region growing method. First, the seed region was determined based on the intensity of gray level; second, the liver and heart were separated based on the anatomical feature; thirdly, an improved region growing was used to segment the image; finally, a post-processing was employed to deal with the under-segmentation. Their method can deal with most cases well, but in some difficult cases (e.g. when the gray level intensity of live is inhomogeneous), it will cause under-segmentation. Li et al. [4] presented a dis- tance regularized level set method. The main advantage is that it allows the use of more general and efficient ini- tialization of the level set function. Therefore, relatively large time steps can be used in the finite difference scheme to reduce the number of iterations. However, the method needs user to select seed points, which makes it a semi-automatic method. In [7] the initial image was seg- mented by fuzzy c-means clustering (FCM) and smoothed by morphological processing; then the candidate regions were classified by neural network; finally, the regions which belong to liver or node were extracted. However, only gray level information was used in the original FCM method, which may cause over-segment when other tis- sues have similar gray level with liver. In [9], the author presented an approach for automatic liver segmentation which was based on statistic shape model (SSM) inte- grated with an optimal-surface-detection strategy. First the generalized Hough transform was used to build the average shape model of liver; then the subspace of SSM wasinitialize; finally, deform the shape model to adapt to liver contour through an optimal-surface detection ap- proach based on graph theory. The method achieves higher accuracy compare with previous model based methods. However, all model based methods suffer the same problem. They need large number of training data which must cover all shape cases. In [10, 11] wavelet transform was used to achieve texture feature extraction; then SVM was employed to make the classification; fi- nally, region growing [10] ormorphological operations [11] was utilized as the post-processing. However, region growing may lead to over-segment when the gray level intensity of liver and around tissues is similar; when us- ing morphological operation as post-processing alone, the parameters should be adjusted carefully, and the ro- bustness may be a problem. Li et al. [5] presented a new fuzzy level set algorithm. It begins with spatial fuzzy clustering which presented by Chuang et al. [8] in 2006. There salt was utilized to initialize level set segmentation and estimated the parameters of level set evolution. Copyright © 2013 SciRes. JSIP  Liver Segmentation from CT Image Using Fuzzy Clustering and Level Set 37 Moreover, the fuzzy level set algorithm was enhanced with locally regularize devolution which can facilitate level set manipulation and lead tomorero bust segmenta- tion. It is efficient when the background is simple and the boundary between background and object is clear. In this paper, we present a fully automatic segment- tion method using fuzzy c-mean clustering combining with level set. Sections 2 and 3 give introductions of fuzzy c-mean clustering and level set method; Section 4 is the proposed segmentation method for liver CT scans; Section 5 gives the result of segmentation and discussion; Section 6 is conclusion and future work. 2. Fuzzy c-Mean Clustering The FCM algorithm assigns pixels to each category by using fuzzy memberships. Let (1,2,, j) x jn denotes an image with n pixels to be partitioned into c clusters, where j x represents features data. The algorithm isan iterative optimization that minimizes the cost function isdefined as: 2 11 cn m ij ij ij J ud (1) iji j dcx (2) where presents the membership of ij u j x in the ith cluster, .i is the ith cluster centre, and m is a constant. The parameter m controls the fuzziness of the resulting partition. [0,1] ij uc The cost function is minimized when pixels close to the centroid of their clusters are assigned high member- ship values, and low membership values are assigned to pixels with data far from the centroid. The membership function represents the probability that a pixel belongs to a specific cluster. In the FCM algorithm, the probability is dependent solely on the distance between the pixel and each individual cluster centre in the feature domain. The membership functions and cluster centres are updated by the following: 2( 1) 1 1 ij m cij kkj ud d (3) and 1 1 nm ij j j inm ij j ux cu (4) The standard FCM algorithm is optimized when the feature data of pixels close to their cluster centre are as- signed high membership values, while those that are far away areas signed low values. One of the disadvantages of standard FCM used in image segmentation is that it only uses the gray level intensity information for clustering rather than spatial information of pixels. In fact, the probability that those neighboring pixels share similar gray level intensity be- long to the same cluster is great. Chuang et al. [8] pre- sented a spatial FCM algorithm in which spatial informa- tion can be incorporated into fuzzy membership func- tions. The spatial function is defined as: () j ij ik kNBx hu (5) where () j NB x represents a square window centred on pixel j x in the spatial domain. Just like the membership function, the spatial function ij represents the probabil- ity that pixel h j x belongs to ith cluster. The spatial func- tion of a pixel for a cluster is large if the majority of its neighborhood belongs to the same clusters. The spatial function is incorporated into membership function as follows: 1 pq ij ij ij c p q kj kj k uh uuh (6) where p and q are two parameters to control the rela- tiveimportance of and . ij uij h 3. Level Set Level set is a continuous deformable model method with implicit representation. Its main idea is to embed the de- formable model in a d+1 dimensional space, to segment iteratively an object in a d dimensional space, using par- tial differential equations. The main advantage of level sets is that it allows changes of surface topology implic- itly. The standard level set function is defined as: 0 0 0, ,, F t x yx y (7) where denotes the normal direction,0(, ) x y is the initial contour and F represents the comprehensive- forces. 0(, ) x y isusually defined as 00 0 0 , ,Cifxyisinside xy Cotherwise (8) here is a constant. 0 The original level set method needs reinitialization because the level set function (LSF) typically develops irregularities during its evolution which cause numerical errors and eventually destroy the stability of the level set evolution. Although reinitialization as a numerical rem- edy is able to maintain the regularity of the LSF, it may incorrectly move the zero level set away from the ex- pected position Liver segmentation process. Moreover it is time consuming for its large computation. 0C Copyright © 2013 SciRes. JSIP 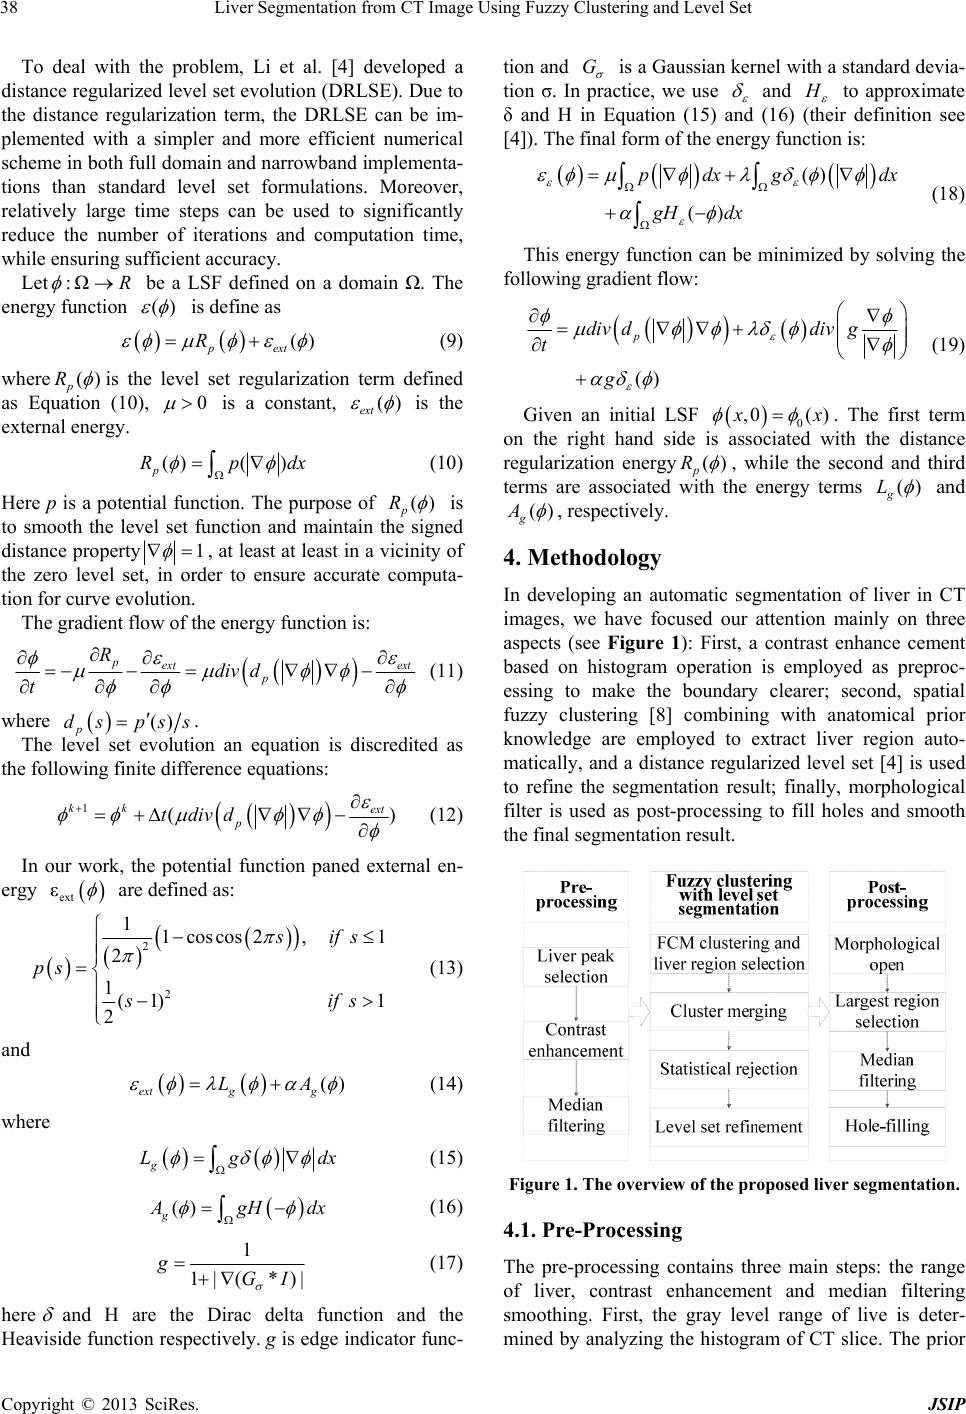 Liver Segmentation from CT Image Using Fuzzy Clustering and Level Set 38 To deal with the problem, Li et al. [4] developed a distance regularized level set evolution (DRLSE). Due to the distance regularization term, the DRLSE can be im- plemented with a simpler and more efficient numerical scheme in both full domain and narrowband implementa- tions than standard level set formulations. Moreover, relatively large time steps can be used to significantly reduce the number of iterations and computation time, while ensuring sufficient accuracy. Let :ΩR be a LSF defined on a domain Ω. The energy function () is define as () pext R (9) where () p R is the level set regularization term defined as Equation (10), 0 is a constant, () ext is the external energy. ()( ) p Rp dx (10) Here p is a potential function. The purpose of () p R is to smooth the level set function and maintain the signed distance property1 , at least at least in a vicinity of the zero level set, in order to ensure accurate computa- tion for curve evolution. The gradient flow of the energy function is: pext ext p Rdiv d t (11) where () p ds pss . The level set evolution an equation is discredited as the following finite difference equations: 1( kk ext p tdivd ) (12) In our work, the potential function paned external en- ergy ext ε are defined as: 2 2 11coscos2, 1 2 1(1) 1 2 s if s ps si fs (13) and () ext g g LA (14) where g Lg dx (15) () g A gH dx (16) 1 1| (*)| gGI (17) here and H are the Dirac delta function and the Heaviside function respectively. g is edge indicator func- tion and G is a Gaussian kernel with a standard devia- tion σ. In practice, we use and H to approximate δ and H in Equation (15) and (16) (their definition see [4]). The final form of the energy function is: () p () dx gdx gH dx (18) This energy function can be minimized by solving the following gradient flow: () p d g t div g div (19) Given an initial LSF 0( ),0 x x ) ( . The first term on the right hand side is associated with the distance regularization energyp R , while the second and third terms are associated with the energy terms () g L and () g A , respectively. 4. Methodology In developing an automatic segmentation of liver in CT images, we have focused our attention mainly on three aspects (see Figure 1): First, a contrast enhance cement based on histogram operation is employed as preproc- essing to make the boundary clearer; second, spatial fuzzy clustering [8] combining with anatomical prior knowledge are employed to extract liver region auto- matically, and a distance regularized level set [4] is used to refine the segmentation result; finally, morphological filter is used as post-processing to fill holes and smooth the final segmentation result. Figure 1. The overview of the proposed liver segmentation. 4.1. Pre-Processing The pre-processing contains three main steps: the range of liver, contrast enhancement and median filtering smoothing. First, the gray level range of live is deter- mined by analyzing the histogram of CT slice. The prior Copyright © 2013 SciRes. JSIP 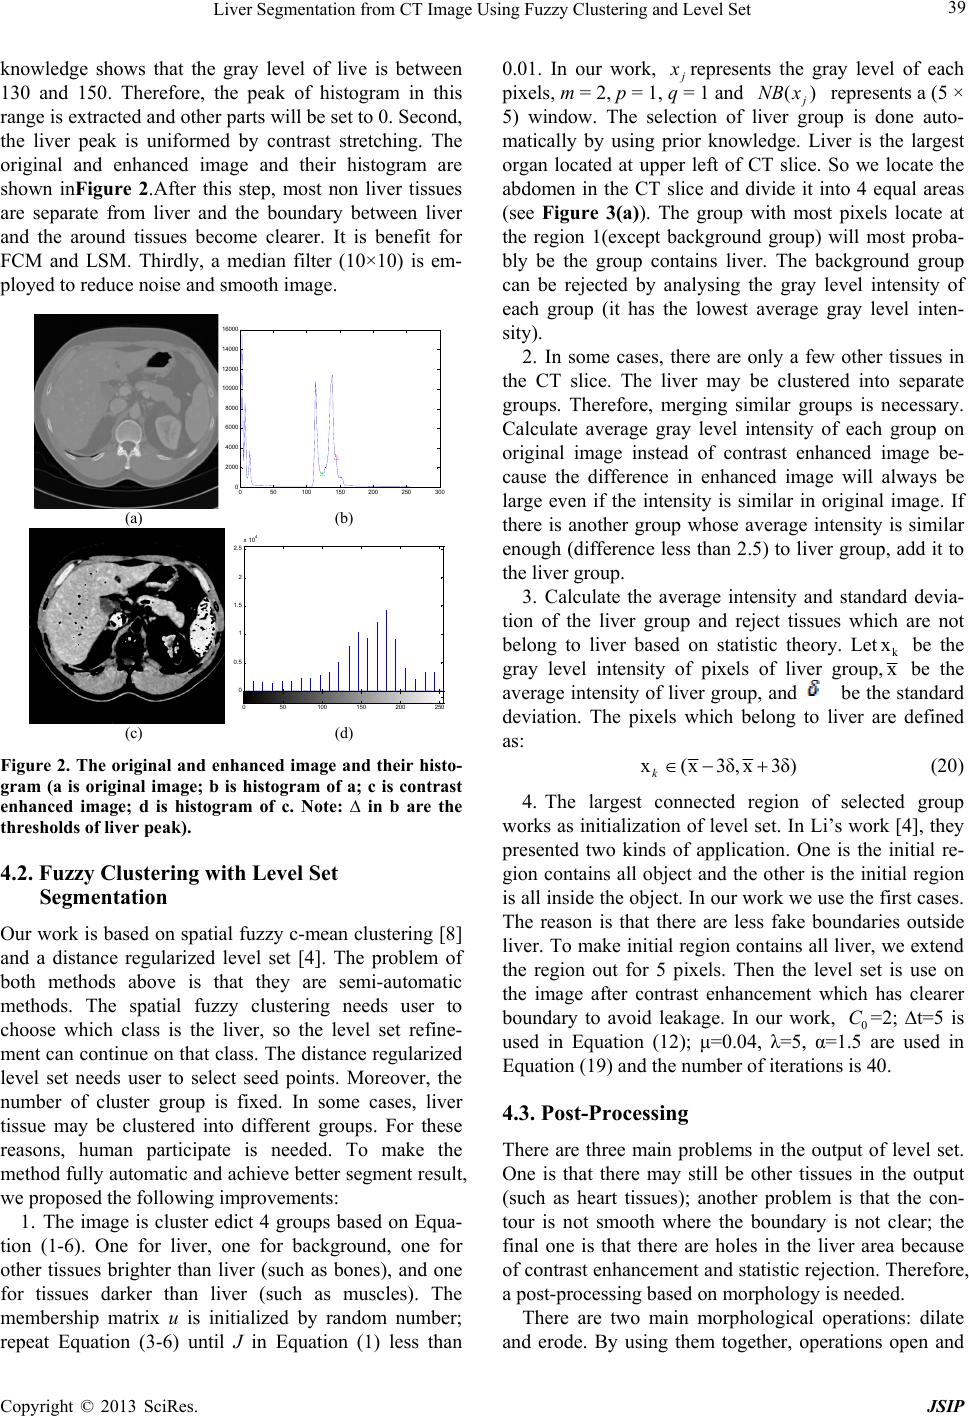 Liver Segmentation from CT Image Using Fuzzy Clustering and Level Set 39 knowledge shows that the gray level of live is between 130 and 150. Therefore, the peak of histogram in this range is extracted and other parts will be set to 0. Second, the liver peak is uniformed by contrast stretching. The original and enhanced image and their histogram are shown inFigure 2.After this step, most non liver tissues are separate from liver and the boundary between liver and the around tissues become clearer. It is benefit for FCM and LSM. Thirdly, a median filter (10×10) is em- ployed to reduce noise and smooth image. 050100 150 200 25030 0 0 2000 4000 6000 8000 10000 12000 14000 16000 (a) (b) 0 0.5 1 1.5 2 2.5 x 10 4 050100 150 200 250 (c) (d) Figure 2. The original and enhanced image and their histo- gram (a is original image; b is histogram of a; c is contrast enhanced image; d is histogram of c. Note: ∆ in b are the thresholds of liver peak). 4.2. Fuzzy Clustering with Level Set Segmentation Our work is based on spatial fuzzy c-mean clustering [8] and a distance regularized level set [4]. The problem of both methods above is that they are semi-automatic methods. The spatial fuzzy clustering needs user to choose which class is the liver, so the level set refine- ment can continue on that class. The distance regularized level set needs user to select seed points. Moreover, the number of cluster group is fixed. In some cases, liver tissue may be clustered into different groups. For these reasons, human participate is needed. To make the method fully automatic and achieve better segment result, we proposed the following improvements: 1. The image is cluster edict 4 groups based on Equa- tion (1-6). One for liver, one for background, one for other tissues brighter than liver (such as bones), and one for tissues darker than liver (such as muscles). The membership matrix u is initialized by random number; repeat Equation (3-6) until J in Equation (1) less than 0.01. In our work, j x represents the gray level of each pixels, m = 2, p = 1, q = 1 and () j NB x represents a (5 × 5) window. The selection of liver group is done auto- matically by using prior knowledge. Liver is the largest organ located at upper left of CT slice. So we locate the abdomen in the CT slice and divide it into 4 equal areas (see Figure 3(a)). The group with most pixels locate at the region 1(except background group) will most proba- bly be the group contains liver. The background group can be rejected by analysing the gray level intensity of each group (it has the lowest average gray level inten- sity). 2. In some cases, there are only a few other tissues in the CT slice. The liver may be clustered into separate groups. Therefore, merging similar groups is necessary. Calculate average gray level intensity of each group on original image instead of contrast enhanced image be- cause the difference in enhanced image will always be large even if the intensity is similar in original image. If there is another group whose average intensity is similar enough (difference less than 2.5) to liver group, add it to the liver group. 3. Calculate the average intensity and standard devia- tion of the liver group and reject tissues which are not belong to liver based on statistic theory. Letk x be the gray level intensity of pixels of liver group,x be the average intensity of liver group, and be the standard deviation. The pixels which belong to liver are defined as: x(x3δ,x 3δ) k (20) 4. The largest connected region of selected group works as initialization of level set. In Li’s work [4], they presented two kinds of application. One is the initial re- gion contains all object and the other is the initial region is all inside the object. In our work we use the first cases. The reason is that there are less fake boundaries outside liver. To make initial region contains all liver, we extend the region out for 5 pixels. Then the level set is use on the image after contrast enhancement which has clearer boundary to avoid leakage. In our work, 0 C=2; ∆t=5 is used in Equation (12); μ=0.04, λ=5, α=1.5 are used in Equation (19) and the number of iterations is 40. 4.3. Post-Processing There are three main problems in the output of level set. One is that there may still be other tissues in the output (such as heart tissues); another problem is that the con- tour is not smooth where the boundary is not clear; the final one is that there are holes in the liver area because of contrast enhancement and statistic rejection. Therefore, a post-processing based on morphology is needed. There are two main morphological operations: dilate and erode. By using them together, operations open and Copyright © 2013 SciRes. JSIP 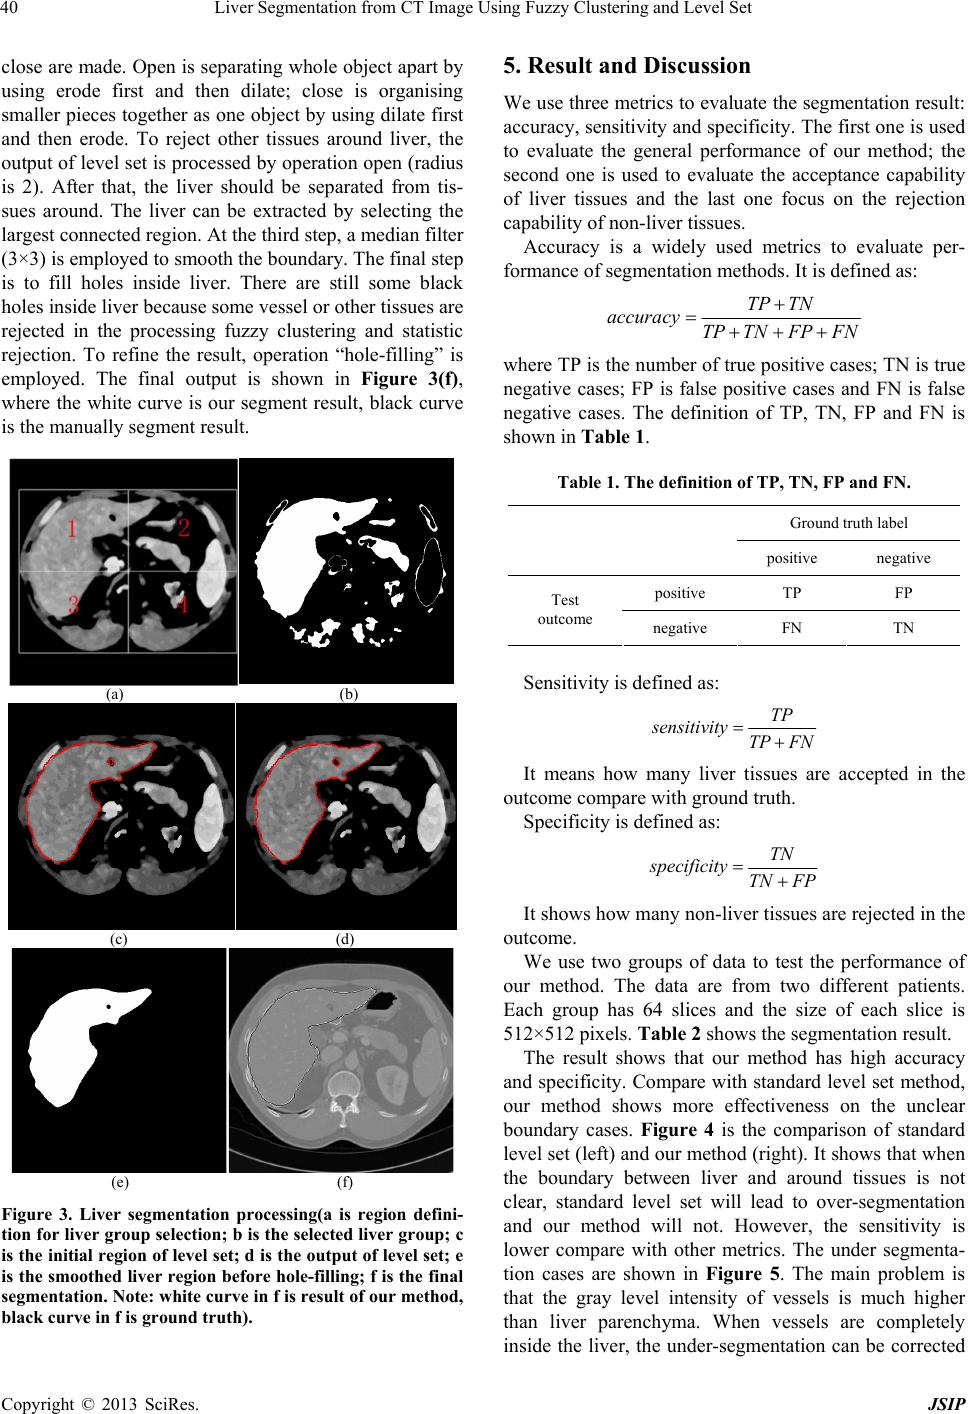 Liver Segmentation from CT Image Using Fuzzy Clustering and Level Set 40 close are made. Open is separating whole object apart by using erode first and then dilate; close is organising smaller pieces together as one object by using dilate first and then erode. To reject other tissues around liver, the output of level set is processed by operation open (radius is 2). After that, the liver should be separated from tis- sues around. The liver can be extracted by selecting the largest connected region. At the third step, a median filter (3×3) is employed to smooth the boundary. The final step is to fill holes inside liver. There are still some black holes inside liver because some vessel or other tissues are rejected in the processing fuzzy clustering and statistic rejection. To refine the result, operation “hole-filling” is employed. The final output is shown in Figure 3(f), where the white curve is our segment result, black curve is the manually segment result. (a) (b) (c) (d) (e) (f) Figure 3. Liver segmentation processing(a is region defini- tion for liver group selection; b is the selected liver group; c is the initial region of level set; d is the output of level set; e is the smoothed liver region before hole-filling; f is the final segmentation. Note: white curve in f is result of our method, black curve in f is ground truth). 5. Result and Discussion We use three metrics to evaluate the segmentation result: accuracy, sensitivity and specificity. The first one is used to evaluate the general performance of our method; the second one is used to evaluate the acceptance capability of liver tissues and the last one focus on the rejection capability of non-liver tissues. Accuracy is a widely used metrics to evaluate per- formance of segmentation methods. It is defined as: TP TN accuracy TP TNFPFN where TP is the number of true positive cases; TN is true negative cases; FP is false positive cases and FN is false negative cases. The definition of TP, TN, FP and FN is shown in Table 1. Table 1. The definition of TP, TN, FP and FN. Ground truth label positive negative positive TP FP Test outcome negative FN TN Sensitivity is defined as: TP sensitivity TP FN It means how many liver tissues are accepted in the outcome compare with ground truth. Specificity is defined as: TN specificity TN FP It shows how many non-liver tissues are rejected in the outcome. We use two groups of data to test the performance of our method. The data are from two different patients. Each group has 64 slices and the size of each slice is 512×512 pixels. Table 2 shows the segmentation result. The result shows that our method has high accuracy and specificity. Compare with standard level set method, our method shows more effectiveness on the unclear boundary cases. Figure 4 is the comparison of standard level set (left) and our method (right). It shows that when the boundary between liver and around tissues is not clear, standard level set will lead to over-segmentation and our method will not. However, the sensitivity is lower compare with other metrics. The under segmenta- tion cases are shown in Figure 5. The main problem is that the gray level intensity of vessels is much higher than liver parenchyma. When vessels are completely inside the liver, the under-segmentation can be corrected Copyright © 2013 SciRes. JSIP 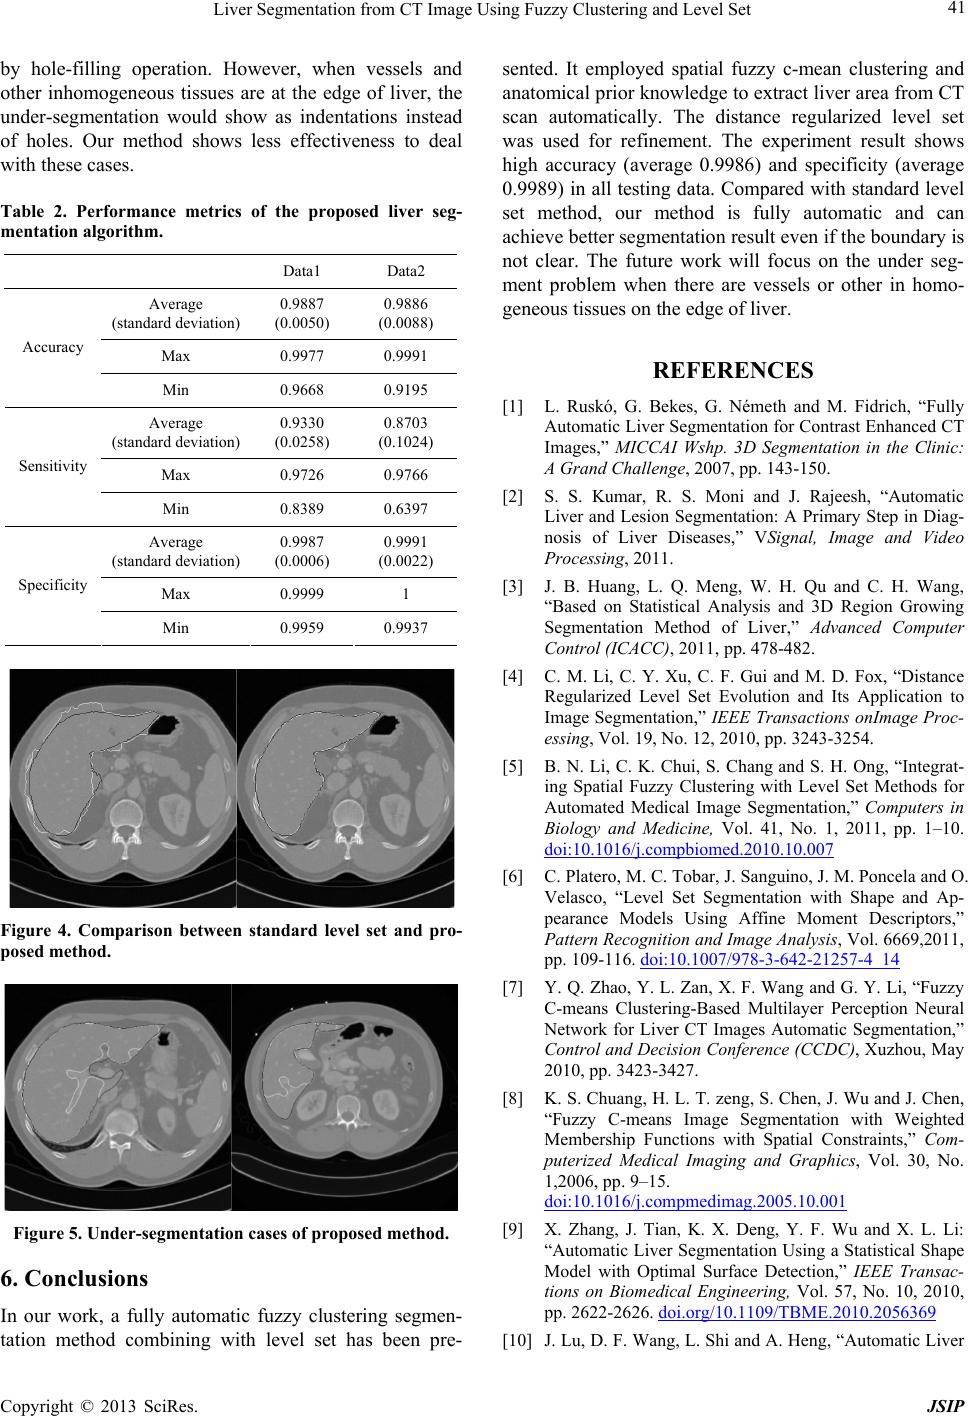 Liver Segmentation from CT Image Using Fuzzy Clustering and Level Set 41 by hole-filling operation. However, when vessels and other inhomogeneous tissues are at the edge of liver, the under-segmentation would show as indentations instead of holes. Our method shows less effectiveness to deal with these cases. Table 2. Performance metrics of the proposed liver seg- mentation algorithm. Data1 Data2 Average (standard deviation) 0.9887 (0.0050) 0.9886 (0.0088) Max 0.9977 0.9991 Accuracy Min 0.9668 0.9195 Average (standard deviation) 0.9330 (0.0258) 0.8703 (0.1024) Max 0.9726 0.9766 Sensitivity Min 0.8389 0.6397 Average (standard deviation) 0.9987 (0.0006) 0.9991 (0.0022) Max 0.9999 1 Specificity Min 0.9959 0.9937 Figure 4. Comparison between standard level set and pro- posed method. Figure 5. Under-segmentation cases of proposed method. 6. Conclusions In our work, a fully automatic fuzzy clustering segmen- tation method combining with level set has been pre- sented. It employed spatial fuzzy c-mean clustering and anatomical prior knowledge to extract liver area from CT scan automatically. The distance regularized level set was used for refinement. The experiment result shows high accuracy (average 0.9986) and specificity (average 0.9989) in all testing data. Compared with standard level set method, our method is fully automatic and can achieve better segmentation result even if the boundary is not clear. The future work will focus on the under seg- ment problem when there are vessels or other in homo- geneous tissues on the edge of liver. REFERENCES [1] L. Ruskó, G. Bekes, G. Németh and M. Fidrich, “Fully Automatic Liver Segmentation for Contrast Enhanced CT Images,” MICCAI Wshp. 3D Segmentation in the Clinic: A Grand Challenge, 2007, pp. 143-150. [2] S. S. Kumar, R. S. Moni and J. Rajeesh, “Automatic Liver and Lesion Segmentation: A Primary Step in Diag- nosis of Liver Diseases,” VSignal, Image and Video Processing, 2011. [3] J. B. Huang, L. Q. Meng, W. H. Qu and C. H. Wang, “Based on Statistical Analysis and 3D Region Growing Segmentation Method of Liver,” Advanced Computer Control (ICACC), 2011, pp. 478-482. [4] C. M. Li, C. Y. Xu, C. F. Gui and M. D. Fox, “Distance Regularized Level Set Evolution and Its Application to Image Segmentation,” IEEE Transactions onImage Proc- essing, Vol. 19, No. 12, 2010, pp. 3243-3254. [5] B. N. Li, C. K. Chui, S. Chang and S. H. Ong, “Integrat- ing Spatial Fuzzy Clustering with Level Set Methods for Automated Medical Image Segmentation,” Computers in Biology and Medicine, Vol. 41, No. 1, 2011, pp. 1–10. doi:10.1016/j.compbiomed.2010.10.007 [6] C. Platero, M. C. Tobar, J. Sanguino, J. M. Poncela and O. Velasco, “Level Set Segmentation with Shape and Ap- pearance Models Using Affine Moment Descriptors,” Pattern Recognition and Image Analysis, Vol. 6669,2011, pp. 109-116. doi:10.1007/978-3-642-21257-4_14 [7] Y. Q. Zhao, Y. L. Zan, X. F. Wang and G. Y. Li, “Fuzzy C-means Clustering-Based Multilayer Perception Neural Network for Liver CT Images Automatic Segmentation,” Control and Decision Conference (CCDC), Xuzhou, May 2010, pp. 3423-3427. [8] K. S. Chuang, H. L. T. zeng, S. Chen, J. Wu and J. Chen, “Fuzzy C-means Image Segmentation with Weighted Membership Functions with Spatial Constraints,” Com- puterized Medical Imaging and Graphics, Vol. 30, No. 1,2006, pp. 9–15. doi:10.1016/j.compmedimag.2005.10.001 [9] X. Zhang, J. Tian, K. X. Deng, Y. F. Wu and X. L. Li: “Automatic Liver Segmentation Using a Statistical Shape Model with Optimal Surface Detection,” IEEE Transac- tions on Biomedical Engineering, Vol. 57, No. 10, 2010, pp. 2622-2626. doi.org/10.1109/TBME.2010.2056369 [10] J. Lu, D. F. Wang, L. Shi and A. Heng, “Automatic Liver Copyright © 2013 SciRes. JSIP 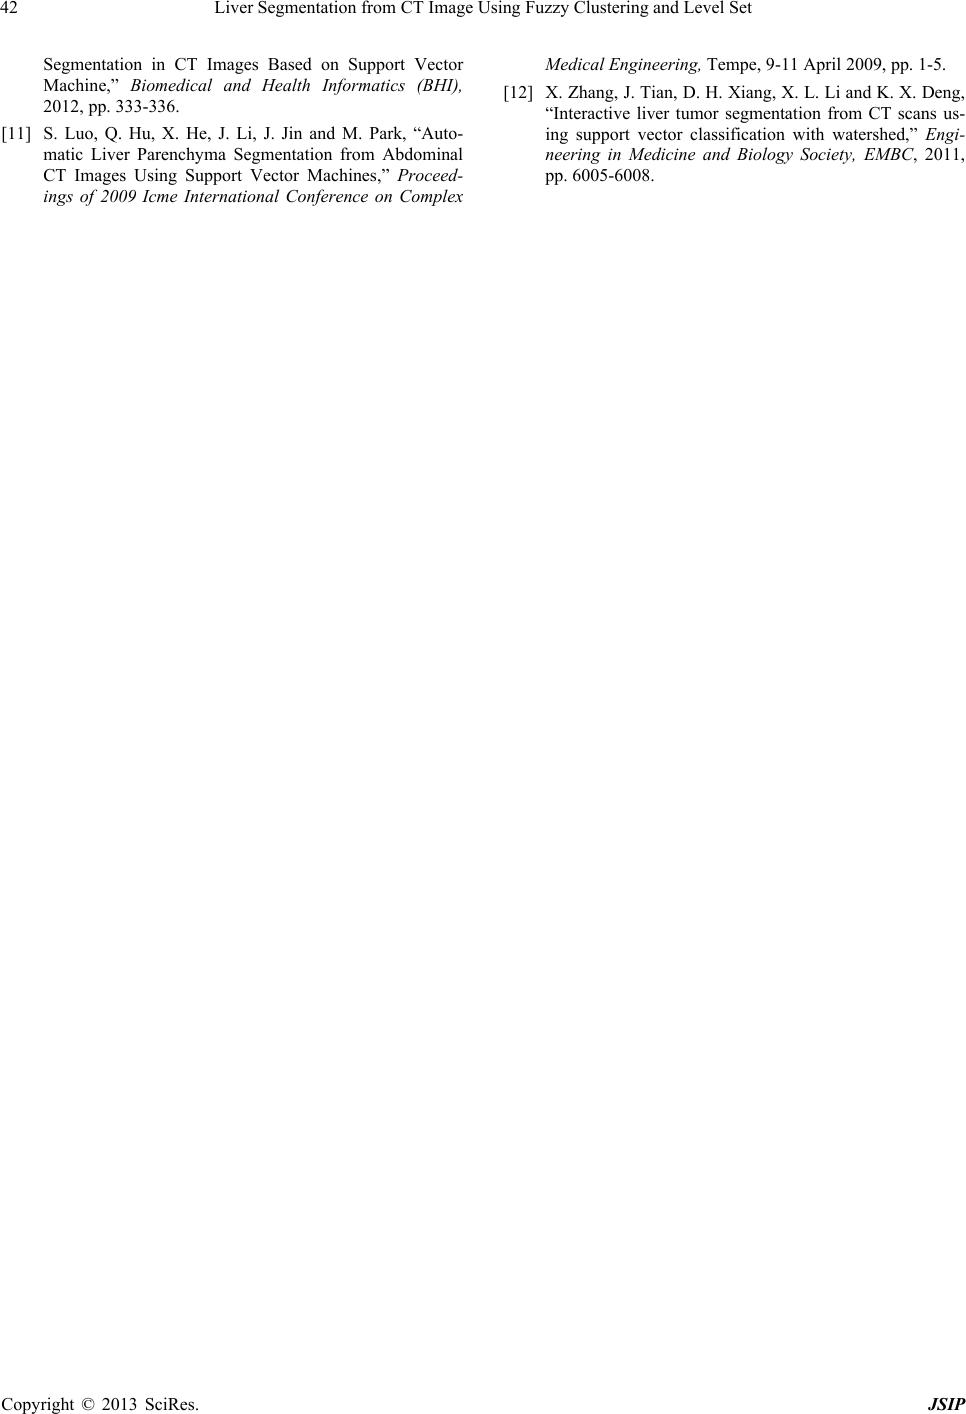 Liver Segmentation from CT Image Using Fuzzy Clustering and Level Set Copyright © 2013 SciRes. JSIP 42 Segmentation in CT Images Based on Support Vector Machine,” Biomedical and Health Informatics (BHI), 2012, pp. 333-336. [11] S. Luo, Q. Hu, X. He, J. Li, J. Jin and M. Park, “Auto- matic Liver Parenchyma Segmentation from Abdominal CT Images Using Support Vector Machines,” Proceed- ings of 2009 Icme International Conference on Complex Medical Engineering, Tempe, 9-11 April 2009, pp. 1-5. [12] X. Zhang, J. Tian, D. H. Xiang, X. L. Li and K. X. Deng, “Interactive liver tumor segmentation from CT scans us- ing support vector classification with watershed,” Engi- neering in Medicine and Biology Society, EMBC, 2011, pp. 6005-6008. |