

Paper Menu >>
Journal Menu >>
 Energy and Power Engineering, 2013, 5, 368-372 doi:10.4236/epe.2013.54B071 Published Online July 2013 (http://www.scirp.org/journal/epe) A Survey of Wind Power Ramp Forecasting* Tinghui Ouyang, Xiaoming Zha, Liang Qin# School of Electrical Engineering, Wuhan University, Wuhan, China Email: #[email protected] Received January, 2013 ABSTRACT At home and broad, more wind power is being installed in electricity markets, the influence brought by wind power become more important on power system stability, especially the fluctuation, the uncertainty in wind power production and multi-time scale of the wind. In order to forecast ramp events before the power system encountering failure, so that the operator can adopt some limited controlling strategy. This paper introduces the present status of the wind power ramp prediction at home and abroad. And it gives out four kinds of definitions of ramp events, which are used by many scholars, then provides various forecasting error algorithm. In the aspect of prediction models, it comes up with physi- cal models and statistical models, and enumerates various examples of different models. Finally, it prospects the ten- dency of the model improvement about the wind power ramp events forecasting, which would be significant for ramp research. Keywords: Ramp Events; Forecasting; Physical Models; Statistical Models 1. Introduction It brings both opportunities and challenges after the wind power accessing the grid. The use of fossil fuel has been increasing for many years in the world and it generates lots of greenhouse g ases. As a result, environmental p ol- lution brought us a serious weather problem. In order to reduce the environmental pollution, we should use re- newable energy that does not pollute the environment any more, such as wind power. Recently, wind power energy, which is eco-friendly, is in the spotlight as the potential energy [1]. However, wind power brought great threaten to the system stability because of fluctuation and uncertainty of the wind. Especially, a typical long term trend with large positive or negative change in a short period, we call it a ramp. In order to get a reasonable and efficient prediction model to forecast ramp events, each country has done a lot of research, but so far, few can achieve very good prediction effect. Ramp events bring much stress to countries all over the word. More and more countries have wind farm to provide power output and face the ramp events at the same time. In Europe, Denmark offers 22%, Spain sup- plies 6%, and Germany provides 5%. In Asia, Korea an d Japan also has wind farm, and Korea provides 83%of total wind power generation in there [2]. In America, according to statistics, Texas has happened 59 ramp events, including 35 up-ramp events and 24 down-ramp events just in 20 05-2006, wh ich bring s great challen ge to the regional power system's safety. Though many coun- tries are on the wind power generation, but wind power output is still caught short in the world. However, with increasing wind penetration, the size of the ramp events has also increased. For example, the installed wind ca- pacity in the Bonneville Power Administration (BPA) is currently over 2000 MW and is expected to increase to over 3000 MW. At this capacity, the wind ramps can be quite large changing by nearly 1000 MW in an hour [3]. So many countries studied the ramp prediction to help the system operators make well informed scheduling decisions and keep the generation and the load balanced. In Australia, The Wind Power Prediction Tool (WPPT) has been installed for th e first time, to forecast the power output from the 65 MW Roaring 40s Renewable Energy P/L Woolnorth Bluff Point wind farm [4]. In China, the wind ramp problem also exists. Since the wind power became the world’s fastest growing energy, China adopts the “mass (tens of KW to tens of millions of KW) shall focus development”, “far distance high voltage delivery” as the way of wind power development. In 2010, the capacity of Chinese installed wind power was 41.827 million KW, and the new installed capacity is 16 million KW. These two both rank the first in the world [5]. Unfortunately, because of the high concentra- *Project supported by the State Key Development Program for Basic Research of China (Grant No.2012CB215101) #Corresponding Author. Copyright © 2013 SciRes. EPE 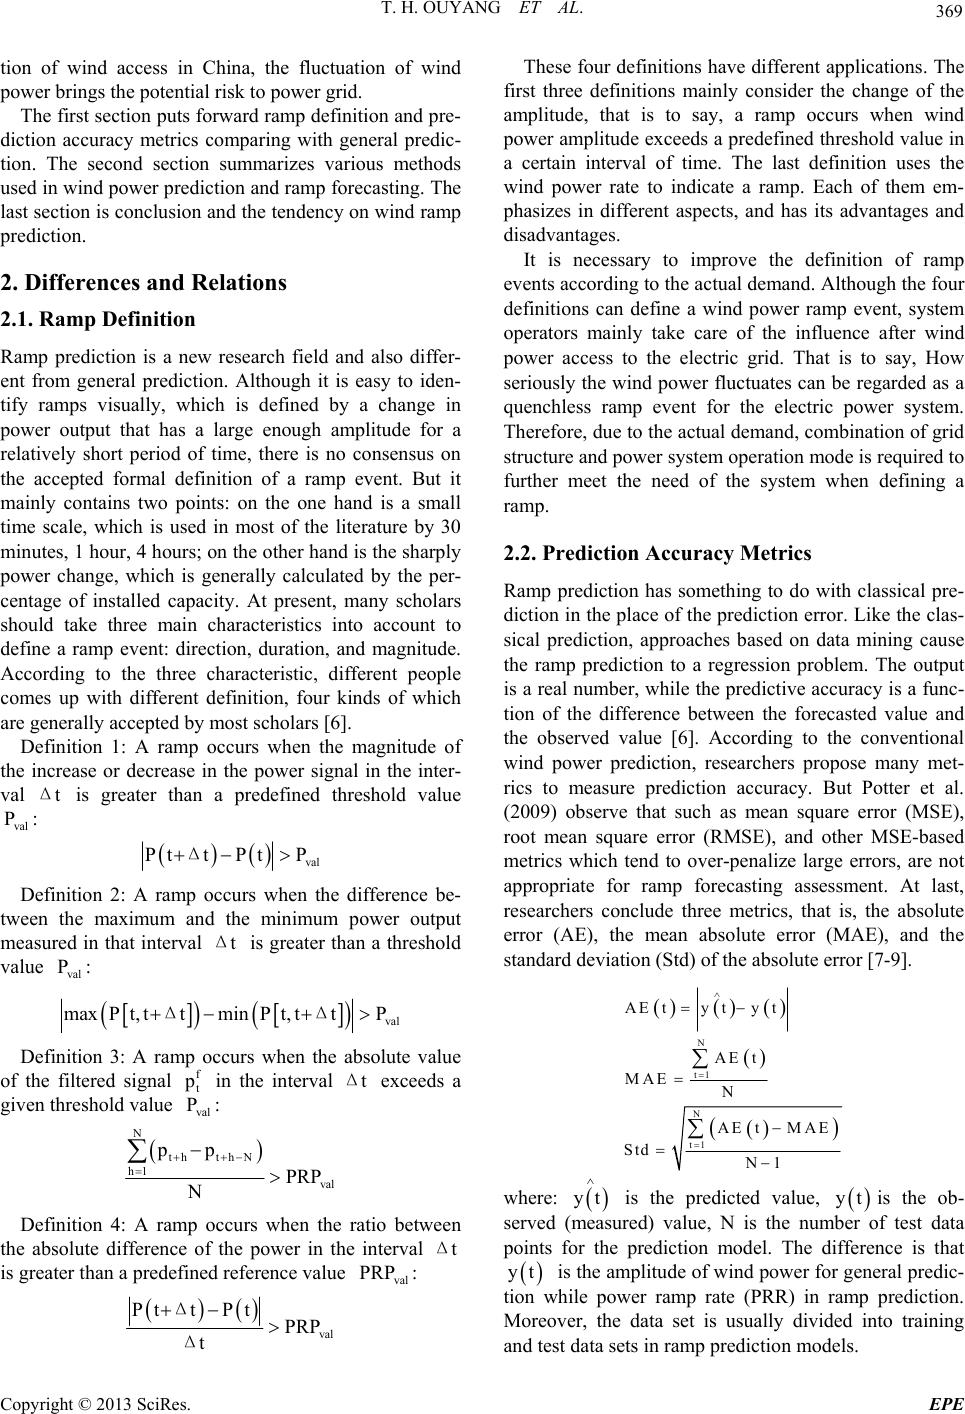 T. H. OUYANG ET AL. 369 tion of wind access in China, the fluctuation of wind power brings the potential risk to power grid. The first section puts forward ramp definition and pre- diction accuracy metrics comparing with general predic- tion. The second section summarizes various methods used in wind power prediction and ramp forecasting. The last section is conclusion and the tendency on wind ramp prediction. 2. Differences and Relations 2.1. Ramp Definition Ramp prediction is a new research field and also differ- ent from general prediction. Although it is easy to iden- tify ramps visually, which is defined by a change in power output that has a large enough amplitude for a relatively short period of time, there is no consensus on the accepted formal definition of a ramp event. But it mainly contains two points: on the one hand is a small time scale, which is used in most of the literature by 30 minutes, 1 hour, 4 hours; on the o ther hand is the sh arply power change, which is generally calculated by the per- centage of installed capacity. At present, many scholars should take three main characteristics into account to define a ramp event: direction, duration, and magnitude. According to the three characteristic, different people comes up with different definition, four kinds of which are generally accepted by most scholars [6]. Definition 1: A ramp occurs when the magnitude of the increase or decrease in the power signal in the inter- val is greater than a predefined threshold value : tΔ val P val Ptt PtP Δ Definition 2: A ramp occurs when the difference be- tween the maximum and the minimum power output measured in that interval is greater than a threshold value : tΔ val P val maxPt,ttminP t,ttP ΔΔ Definition 3: A ramp occurs when the absolute value of the filtered signal f t p in the interval exceeds a given threshold value : tΔ val P N th thN h1 val pp PRP N Definition 4: A ramp occurs when the ratio between the absolute difference of the power in the interval is greater than a predefined reference value : tΔ val PRP val Ptt PtPRP t Δ Δ These four definitions have different applications. The first three definitions mainly consider the change of the amplitude, that is to say, a ramp occurs when wind power amplitude exceeds a predefined threshold value in a certain interval of time. The last definition uses the wind power rate to indicate a ramp. Each of them em- phasizes in different aspects, and has its advantages and disadvantages. It is necessary to improve the definition of ramp events according to the actual demand. Although the four definitions can define a wind power ramp event, system operators mainly take care of the influence after wind power access to the electric grid. That is to say, How seriously the wind power fluctuates can be regarded as a quenchless ramp event for the electric power system. Therefore, due to the actual demand, combination of grid structure and power system operation mode is required to further meet the need of the system when defining a ramp. 2.2. Prediction Accuracy Metrics Ramp prediction has something to do with classical pre- diction in the place of the prediction error. Like the clas- sical prediction, approaches based on data mining cause the ramp prediction to a regression problem. The output is a real number, while the predictive accuracy is a func- tion of the difference between the forecasted value and the observed value [6]. According to the conventional wind power prediction, researchers propose many met- rics to measure prediction accuracy. But Potter et al. (2009) observe that such as mean square error (MSE), root mean square error (RMSE), and other MSE-based metrics which tend to over-penalize large errors, are not appropriate for ramp forecasting assessment. At last, researchers conclude three metrics, that is, the absolute error (AE), the mean absolute error (MAE), and the standard deviation (Std) of the absolute error [7-9]. N t1 N t1 AEty ty t AE t MAE N AE tMAE Std N1 where: is the predicted value, is the ob- served (measured) value, N is the number of test data points for the prediction model. The difference is that yt yt yt is the amplitude of wind power for general predic- tion while power ramp rate (PRR) in ramp prediction. Moreover, the data set is usually divided into training and test data sets in ramp prediction models. Copyright © 2013 SciRes. EPE 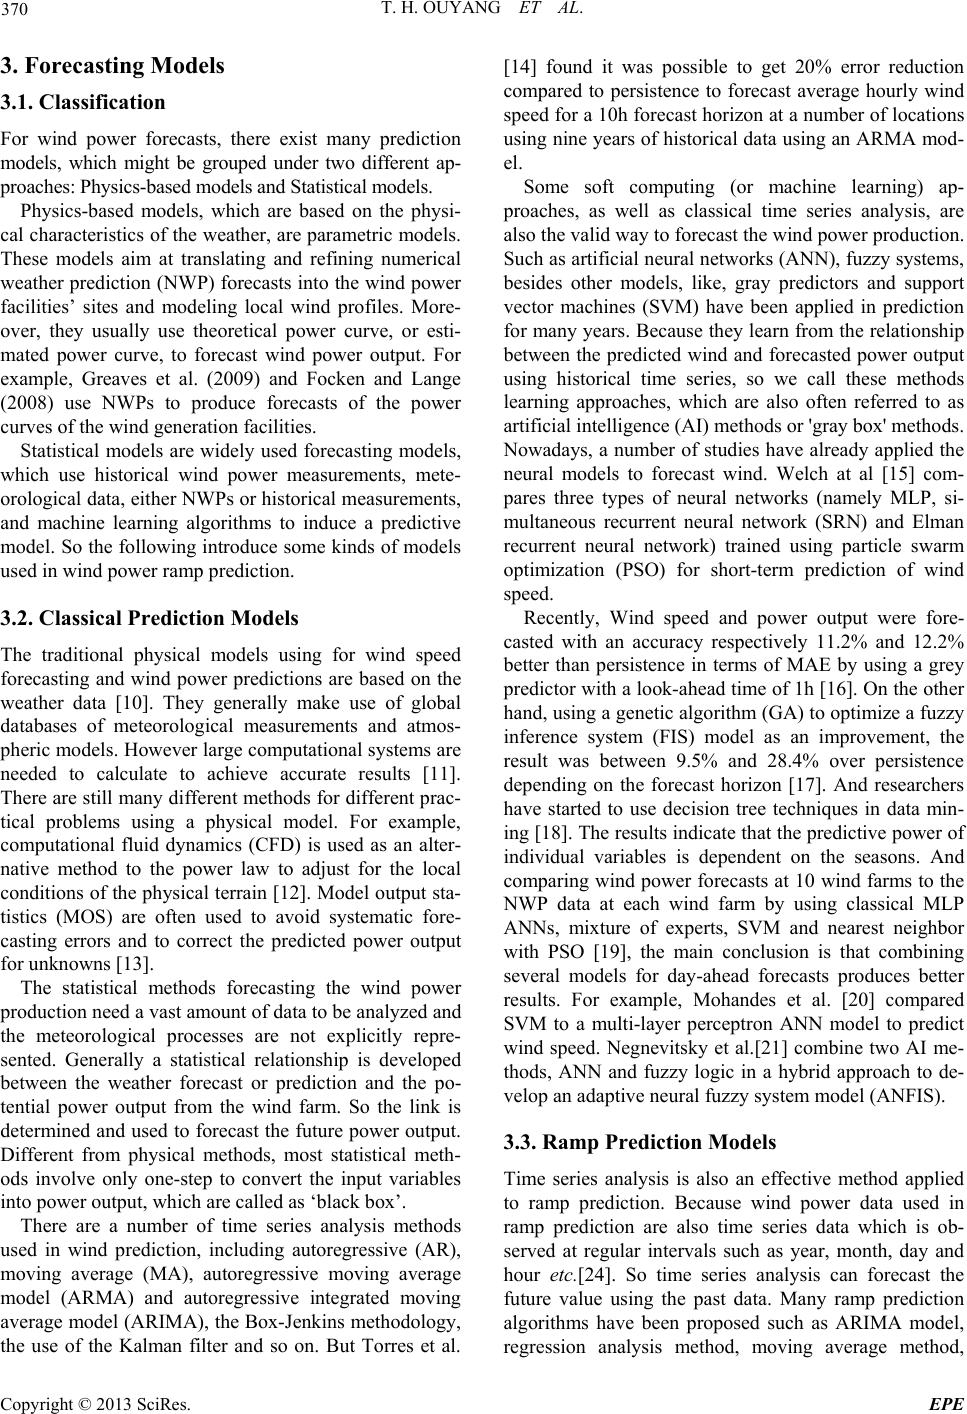 T. H. OUYANG ET AL. 370 3. Forecasting Models 3.1. Classification For wind power forecasts, there exist many prediction models, which might be grouped under two different ap- proaches: Physics-based models and St atisti cal m odel s. Physics-based models, which are based on the physi- cal characteristics of the weather, are parametric models. These models aim at translating and refining numerical weather prediction (NWP) forecasts into the wind power facilities’ sites and modeling local wind profiles. More- over, they usually use theoretical power curve, or esti- mated power curve, to forecast wind power output. For example, Greaves et al. (2009) and Focken and Lange (2008) use NWPs to produce forecasts of the power curves of the wind generation facilities. Statistical models are widely used forecasting models, which use historical wind power measurements, mete- orological data, either NWPs or historical measurements, and machine learning algorithms to induce a predictive model. So the following introduce some kinds of models used in wind power ramp prediction. 3.2. Classical Prediction Models The traditional physical models using for wind speed forecasting and wind power predictions are based on the weather data [10]. They generally make use of global databases of meteorological measurements and atmos- pheric models. However large computational systems are needed to calculate to achieve accurate results [11]. There are still many different methods for different prac- tical problems using a physical model. For example, computational fluid dynamics (CFD) is used as an alter- native method to the power law to adjust for the local conditions of the physical terrain [12]. Model output sta- tistics (MOS) are often used to avoid systematic fore- casting errors and to correct the predicted power output for unknow n s [ 13 ] . The statistical methods forecasting the wind power production need a vast amount of data to be analyzed and the meteorological processes are not explicitly repre- sented. Generally a statistical relationship is developed between the weather forecast or prediction and the po- tential power output from the wind farm. So the link is determined and used to forecast the future power output. Different from physical methods, most statistical meth- ods involve only one-step to convert the input variables into power output, which are called as ‘b lack box’. There are a number of time series analysis methods used in wind prediction, including autoregressive (AR), moving average (MA), autoregressive moving average model (ARMA) and autoregressive integrated moving average model (ARIMA), the Box-Jenkins methodology, the use of the Kalman filter and so on. But Torres et al. [14] found it was possible to get 20% error reduction compared to persistence to forecast average hourly wind speed for a 10h forecast horizon at a number of locations using nine years of historical data using an ARMA mod- el. Some soft computing (or machine learning) ap- proaches, as well as classical time series analysis, are also the valid way to forecast the wind power production. Such as artificial neural networks (ANN), fuzzy systems, besides other models, like, gray predictors and support vector machines (SVM) have been applied in prediction for many years. Because they learn from the relationship between the predicted wind and forecasted power output using historical time series, so we call these methods learning approaches, which are also often referred to as artificial intelligence (AI) methods or 'gray box' methods. Nowadays, a number of studies have already applied the neural models to forecast wind. Welch at al [15] com- pares three types of neural networks (namely MLP, si- multaneous recurrent neural network (SRN) and Elman recurrent neural network) trained using particle swarm optimization (PSO) for short-term prediction of wind speed. Recently, Wind speed and power output were fore- casted with an accuracy respectively 11.2% and 12.2% better than persistence in terms of MAE by using a grey predictor with a look-ahead time of 1h [16]. On the other hand, using a genetic algo rithm (GA) to optimize a fuzzy inference system (FIS) model as an improvement, the result was between 9.5% and 28.4% over persistence depending on the forecast horizon [17]. And researchers have started to use decision tree techniques in data min- ing [18]. The results indicate that the predictive power of individual variables is dependent on the seasons. And comparing wind power forecasts at 10 wind farms to the NWP data at each wind farm by using classical MLP ANNs, mixture of experts, SVM and nearest neighbor with PSO [19], the main conclusion is that combining several models for day-ahead forecasts produces better results. For example, Mohandes et al. [20] compared SVM to a multi-layer perceptron ANN model to predict wind speed. Negnevitsky et al.[21] combine two AI me- thods, ANN and fuzzy logic in a hybrid approach to de- velop an adaptive neural fuzzy system model (ANFIS). 3.3. Ramp Prediction Models Time series analysis is also an effective method applied to ramp prediction. Because wind power data used in ramp prediction are also time series data which is ob- served at regular intervals such as year, month, day and hour etc.[24]. So time series analysis can forecast the future value using the past data. Many ramp prediction algorithms have been proposed such as ARIMA model, regression analysis method, moving average method, Copyright © 2013 SciRes. EPE  T. H. OUYANG ET AL. 371 exponential smoothing method, and decomposition method, etc. Reference [2] forecast power output with ARIMA and exponential smoothing method that are in- variant time series models. Reference [22] considers the seasonal factors, and concludes that up ramp tend to oc- cur during the mid-day and afternoon periods and down ramp tend to occurs during the evening and night times. However, wind power has uncertainty in multiple time scales, each requires its own time series modeling ap- proach. In the range of seconds to minutes, autoregres- sive or persistence techniques can deal well with small amounts of fast fluctuations, but badly with longer term trends. ARIMA model can process an integral step, but do not capture abrupt changes in wind power ramp. To forecast the ramp events, most of the existing wind power forecasting methods are not suitable. They are based on the “point forecasting”, i.e., forecasting the exact value of wind power at a future time[23-25].Some other methods have extended the point forecasting me- thods by estimating the confidence interval of point forecasts[26]. No matter what model is used, it is about history data point and future point forecast. The differ- ence between all of the methods is the selection of time interval, usually for a few minutes ahead to 24 hours ahead. As a result, forecasting still suffer from a high level of inaccuracy because ramp event represent a scene not a point. So some people categorize ramp events into 'classes', and come up with SVM as classifiers and an elaborate model, which can use available data to predict the class of future ramps. Reference [27] uses SVM as the classification engine to predict ramp event. Further- more, it used the One-Against-All approach to extend and apply the binary SVM to multi-class prob lem. As is said above, ramp forecasting is a kind of scene prediction which can use Markov chain. Most described models rely on an observable process and are determined as a function of past values of the process. Markov Switching Auto Regressive (MSAR) models, which al- low the switches to be governed by an unobservable process, propose an alternative to this observable re- gime-switching modeling. It is assumed to be a Markov chain. A good characteristic of such approach is that permits to reflect the impact of some external factors on the behaviors of certain time-series [28]. Because it can manage to capture the influence of some complex mete- orological features, Markov chain is found to be suitable for modeling especially for weather variables, such as daily rainfall occurrences [29] or wind fields [30]. For the specific case of the fluctuations of wind generation, some people use this hidden Markov Models (HMM) to describe meteorological features and to forecast the wind ramp scene that cannot be determined from past values of measured power production only. HMM models and the estimation of their parameters are briefly described in [31]. To improve the ramp prediction approach, combina- tions of different methods are necessary. There are many methods existing to forecast wind ramp, most of which are inherited from the classical wind power prediction methods. However, each has its own application field. Generally speaking, at home and abroad, few of them can acquire high accuracy in forecasting a wind power ramp. Comprehensive consideration, on the one hand, time series models, a kind of statistical prediction meth- ods, have advantages in dealing with the past historical data to predict future data. On the other hand, Markov chain has its unique advantages at the transformation between different events. So we speculate that combin- ing time series with HMM models would achieve better results in the wind ramp forecasting. 4. Conclusions and Tendency It is necessary to improve forecasting accuracy of the wind power ramp. With the increasing of wind power installed capacity and concentrating arrangement of most wind farms, the wind ramp models are needed to be im- proved so that system operators can ensure power system safety and economy. The following gives out some sug- gestions to improve the results of ramp prediction : 1) Physics-based models mainly rely on NWP data. Because of NWP data coming from signal model, low update frequency and resulting in forecasting errors, these make the accuracy of wind power ramp prediction low. Combining with multiple NWP models can improve Physics-based modeling, which can improve the accu- racy of wind power ramp prediction. 2) For statistical model, the domestic and foreign scholars have studied that combining the prediction re- sults of different forecast methods can further improve the prediction accuracy. Moreover, using some good data mining methods to process data can also improve the accuracy. 3) Furthermore, the combination and optimization of the prediction results from physical models and statistical models can also improve the accuracy. REFERENCES [1] S. Y. Kim and S. H. Kim, “Comparative Study on the Performance of Various Wind Speed Predictors,” KIISS, April 2011, pp. 21-24. [2] Y. H. Mi, et al., “Prediction of Wind Power Generation and Power Ramp Rate with Time Series Analysis,” Awareness Science and Technology (iCAST), 2011 3rd International Conference on, 2011. [3] C. Kamath, “Understanding Wind Ramp Events through Analysis of Historical Data,” IEEE PES Transmission and Distribution Conference and Exposition: Smart Solu- Copyright © 2013 SciRes. EPE  T. H. OUYANG ET AL. Copyright © 2013 SciRes. EPE 372 tions for a Changing World, 2010, [4] C. Nicholas and Merlinde, et al., “Detecting, Categoriz- ing and Article Forecasting Large Ramps in Wind Farm Power Output Using Meteorological Observations and WPPT,” Wind Energy, Vol. 10, No. 5, 2007, pp. 453-470. doi:10.1002/we.235 [5] J. F. Li, P. F. Shi and H. Gao, “The Report of Chinese Wind Power Development 2010,” Vol. 10, 2010. [6] C. Ferreira, J. Gama and L. Matias, “A Survey on Wind Power Ramp Forecasting,” Argonne National Laboratory report, 2011. [7] A. Sfetsos, “A Novel Approach for the Forecasting of the Mean Hourly Wind Speed Time Series,” Renewable En- ergy, Vol. 27, No. 2, 2002, pp. 163-174. doi:10.1016/S0960-1481(01)00193-8 [8] A. J. Smola and B. Schoelkopf, “A Tutorial on Support Vector Regression,” Statistics and Computing, Vol. 14, No. 3, 2004, pp. 199-222. doi:10.1023/B:STCO.0000035301.49549.88 [9] A. J. Svoboda, C. Tseng, C. Li and R. B. Johnson, “Short-term Resource Scheduling with Ramp Con- straints,” IEEE Transactions on Power Systems, Vol. 12, No. 1, 1997, pp. 77-83. doi:10.1109/59.574926 [10] L. A. Landberg, “Mathematical Look at a Physical Power Prediction Model,” Wind Energy, Vol. 1, 1998, pp. 23-28. [11] L. Landberg, L. Myllerup, O. Rathmann, E. Lundtang Petersen, B. Hoffmann Jorgensen, J. Badger and N. Gyl- ling, “Mortensen Wind Resource Estimation – An Over- view,” Wind Energy, Vol. 6, No. 3, 2003, pp. 26-71. [12] M. Magnusson and L. Wern, “Wind Energy Predictions Using CFD and HIRLAM Forecast,” Proceedings of the European Wind Energy Conference EWEC2001, Copen- hagen, Denmark, 2001. [13] HR Glahn, DA Lowry, “The Use of Model Output Statis- tics (MOS) in Objective Weather Forecasting,” Journal of Applied Meteorology, Vol. 11, No. 8, 1972. [14] J. L. Torres, A. García, M. de Blas and A. de Francisco, “Forecast of Hourly Averages Wind Speed with ARMA Models in Navarre,” Solar Energy, Vol. 79, No. 1, 2005, pp. 65-77. [15] R. L. Welch, S. M. Ruffing and G. K. Venayagamoorthy, “Comparison of Feed Forward and Feedback Neural Network Architectures for Short-term Wind Speed Pre- diction,” Proceedings of International Joint Conference on Neural Networks, Atlanta, Georgia, USA, 2009. [16] T. H. M. El-Fouly, E. F. El-Saadany and M. M. A. Salama, “Grey predictor for Wind Energy Conversion Systems Output Power Prediction,” IEEE Transactions on Power System, Vol. 21, 2006. [17] I. G. Damousis and P. Dokopoulos, “A Fuzzy Model Expert System for the Forecasting of Wind Speed and Power Generation in Wind Farms,” Proceedings of the IEEE International Conference on Power Industry Com- puter Applications PICA 01, 2001. [18] H. Mori and Y. Umezawa, “Application of NB Tree to Selection of Meteorological Variables in Wind Speed Prediction,” Proceedings of the IEEE Transmission & Distribution Conference & Exposition, Asia and Pacific; 2009. [19] R. Jursa, “Wind Power Prediction with Different Artifi- cial Intelligence Models,” Proceedings of the European Wind Energy Conference, EWEC2007, Milan, Italy, 2007. [20] M. A. Mohandes, T. O. Halawani, S. Rehman and A. A. Hussain, “Support Vector Machines for Wind Speed Pre- diction,” Renewable Energy, Vol. 29, No. 6, 2004. [21] M. Negnevitsky, P. Johnson and S. Santoso, “Short-term Wind Power Forecasting Using Hybrid Intelligent Sys- tems,” Proceedings of the IEEE Power Engineering So- ciety General Meeting, Tampa, Florida, USA, 2007. [22] Sevlian, Raffi, Rajagopal and Ram, “Wind Power Ramps: Detection and Statistics,” IEEE Power and Energy Soci- ety General Meeting, 2012. [23] M. C. Alexiadis, P. S. Dokopoulos, and H. S. Sahsamanoglou, “Wind Speed and Power Forecasting Based on Spatial Correlation Models,” IEEE Transaction on Energy Conversion, Vol. 14, No. 3, 1999, pp. 836-842. doi:10.1109/60.790962 [24] C. W. Potter and M. Negnevitsky, “Very Short-term Wind Forecasting for Tasmanian Power Generation,” IEEE Transaction on Power System, Vol. 21, No. 2, 2006, pp. 965-972.doi:10.1109/TPWRS.2006.873421 [25] Kusiak, H. Zheng and Z. Song, “Short-term Prediction of Wind Farm Power: A Data Mining Approach,” IEEE Trans. Energy Conversion, Vol. 24, No. 1, 2009, pp. 125-136.doi:10.1109/TEC.2008.2006552 [26] P. Pinson and G. Kariniotakis, “On-line Assessment of Prediction Risk for Wind Power Production Forecasts,” in Proceedings of the European Wind Energy Conference and Exhibition, 2003. [27] H. Zareipour, H. Dongliang and W. Rosehart, “Wind Power Ramp Events Classification and Forecasting: A Data Mining Approach,” Power and Energy Society Gen- eral Meeting, Detroit, USA, 2011. [28] H. Hamilton, “A New Approach to the Economic Analy- sis of Nonstationay Time-series and Business Cycles,” Econometrica, Vol. 57, No. 2, 1989, pp. 357-384. doi:10.2307/1912559 [29] A. W. Robertson, S. Kirshner and P. Smyth, “Hidden Markov Models for Modeling Daily Rainfall Occurence over Brazil,” Report UCI-ICS-03-27, Information and Computer Sciences, University of California, Irvine (Cal- ifornia) 2003. [30] P. Ailliot and V. Monbet, “Markov Switching Autore- gressive Models for Wind Time Series,” Journal of Sta- tistical Planning and Inference (submitted) 2006. [31] P. Pinson, L. E. A. Christensen, H. Madsen, P. E. Sorensen, M. H. Donovan and L. E. Jensen, “Re- gime-switching Modeling of the Fluctuations of Offshore wind Generation,” Journal of Wind Engi- neering and Industrial Aerodynamics, Vol. 96 No.12, 2008, pp. 2327-2347. doi:10.1016/j.jweia.2008.03.010 |