

Paper Menu >>
Journal Menu >>
 Energy and Power E ngineering, 2013, 5, 356-362 doi:10.4236/epe.2013.54B069 Published Online July 2013 (http://www.scirp .o rg/journal/epe) Copyright © 2013 SciRes. EPE Economic and Feasibility Analysis for Stand–alone Solar Photovoltaic Generation System Jeeng-Min Ling, Ping-Hsun Liu Department of Electrical Engineering, Southern Taiwan University of Science and Technology, Tainan, Taiw an, China Email: [email protected], [email protected] Received April, 2013 ABSTRACT The paper presents a feasibility computing approach to solve the optimal planning problem applied to Stand-alone Pho- tovoltaic (SPV) system by considering the reliability requirement and economical performance. Evaluation technique based on genetic algorithm to get global optimum capacity o f solar array and battery in a SP V syste m is more efficient- ly. Explicit strategy selects proper values of systems' parameters improving local exploration and avoiding trapped in local optimum. Different requirements of system reliability are investigated to achieve the optimal planning of a SPV syste m. Sensit ivity analysis of components' cost and load pr o files are conducted to demonstrate the impacts of system uncertainty. The solar radiation and temperature data from the Central Weather Bureau of Taiwan at fou r different loca- tions were used. Keywords: Genetic Algorithms; Reliability; Opti mizatio n; Photo voltaic Systems 1. Introduction Taiwan is located in the subtropical area and possesses excellent solar radiation for photovoltaic applications. Some new demonstration photovoltaic systems were in- stalled on public buildings, such as the World Games 2009 Kaohsiung (1 MWp) and the National Museum of T aiwa n Hi story (195 KWp) etc. The government contin- ues to promote the installation of solar photovoltaic sys- tems through several projects, such as “Solar Top pro- ject”, “Solar community Project” and “Solar Campus Project”. It is believed that the installation capacity of solar photovoltaic systems will be boosted by the “Re- newable Energy Development Bill” for future comer- cial applic a tions [1]. SPV systems are becoming increasingly viable and cost-effective candidates for providing electricity to re- mote and offshore islands areas which operate at low capacity factors and where the gird extension is difficult and not economical. Issues concerning the security of supply and volta ge rising in the micro-grid underline the need of storage system, like a stand-alone system, are becoming increasingly viable recently [2]. The planning of such an electrification unit requires an estimation of the capacities of photovoltaic (PV) module and battery (BTY) to satisfy a given load demand. Some studies on sizing of the SPV system were stud- ied [3-6]. The sizing method based on energy generation simulation for various numbers of PV and BTY capacity (18 configurations) was presented using suitable models for the system devices [4]. The selection of the alloca- tion of PV and BTY under corresponding reliability in- dices, the loss of load hours (LOLH) and the loss energy, should be considered the stochastic nature of both the radiation and the load demand. Based on the Borowy’s and Salameh method [5], the system operation is simu- lated for various combination of PV and BTY sizes and the loss of power supply (LPSP) is calculated for each combination. For the desired LPSP, the PV versus BTY size are plotted to get the optimal solution, which mini- mizes the total system cost from the point on the sizing curve. Several software tools are available for the design of stand-alone renewable energy systems [6-9]. The RET Screen International Clean Energy Decision Support Centre in Canada developed a decision making tool, RET Screen, to help planners to implement renewable energy and analyze the technical a nd financial viability of po ssi- ble projects [7]. Hybr id 2 developed by the National Re- newable Energy Laboratory in USA performs the de- tailed time series simulat ion of hybrid renewable systems [8]. The most popular simulation tool, Hybrid Optimiza - tion Model for Electric Renewable (HOME R) [9], uses hourly simulation to achieve optimal sizing of isolated renewable system. Most of the available software tools only identify and si mulate a single design option; a range of possible design option is unavailable [6]. F urther- mor e, the impacts on the effects of non-linearity and op-  J.-M. LING, P.-H. LIU Copyright © 2013 SciRes. EPE 357 timization in system model, a nd the va riat ions o f the sig- nificant design variables is needed to investigate the usefulness of these simulation and optimization tools applied to specific applica tions. The paper proposes a procedure based on genetic al- gorithms (GA) to get global optimum capacity of PV array and battery in a SPV system under compromise between the reliability and to tal installed c ost. Compared with t he co n ve nt io na l Lagrangian relaxatio n op ti mization, GA approach finds the global optimum more efficiently. The sensitivity analysis for the component cost and load profiles were also discussed to show the impacts of the optimal results of planning. The optimal sizing of a SPV system incorporating solar resources uncertainty is also considered in the aspects of long-ter m pla nning. The real solar radiation/temperature data from four weather sta- tions have been tested to simulate the practicability of planning resul ts for a SPV system. 2. The Optimal Design Method In the design and planning of stand-alone renewable en- ergy systems, the optimal sizing is an important and challenging task as the coordination among renewable energy resources, generators, storage capacity and it’s complicated load. 2.1. System Modeling A SPV system consists of solar array, battery bank, con- trol and power converting components. The PV-array convert’s s un light into DC electricity. PV array is made up of several interconnected PV modules. The batteries store the electrical energy for use when needed. The block diagram of the proposed system is shown in Fig- ure 1. 2.2. The Reliability Analysis of a SPV Generation To access the available solar generation of a PV system in candidate regio n is one of the most impor tant parame- ters before installation. Because of the intermittent solar radiation characteristics, which highly influence the re- sulting energy production, reliability analysis has been Solar ArrayDC/DC Converter DC/AC Inverter Control of Charge and discharge Battery AC Load PV current Load current (AC) Battery current Figure 1. Block diagram of the SPV system. considered as an important step in any planning and de- sign process. In the paper, the reliability index evaluated is the total loss of load hours (LOLH) which is the sum- mation of loss of load expectation events expressed in hours over a specified time (usually one year). At these time, a SPV system is unable to meet the load require- ments due to lack of power at an in stant. LOLH is a feasible measure to sys tem pe r fo r manc e fo r assumed or known load distribution. Zero LOLH means that the load will always be satisfied. Larger LOLH im- plies the customer will be suffered from a higher proba- bility of losing power. It is a popular demand side index in the syste m pla nning. LOLH can be de fined b y the fol- lowing equatio n: 24 11(, ) n ij LOLHf i j = = =∑∑ (1) min min min min min min 0( (, )(, )) (,) (, )1(, )(,1) (,) 1( (, )(, ))(,1) ifSij LijS Sij S fijifSijS andSijS Li j if SijLijSorSijS −≥ − = −>−> − <−< where S(i,j): the capacity state of BTY in the ith day- jth hour, L(i,j) : the consumed load in the ith day- jth hour , f(i,j) : system shor tage in the ith day- jth hour s, Smin : Minimum battery discharge capacity. The amount of solar radiation determines the current output of a PV generation. After considering load profile, the out put po wer of a PV generation can be conducted to evaluate the charge/discharge current Ib of BTY. Two main directio ns of Ib lead to different operation modes of SPV: positive Ib is the mode of PV generation greater than load consumption, while negative Ib induced by the shortage of a SPV generation. At this mode, the state of charge and minimum battery discharge capacity of BTY should be integrated to calculate the LOLH. The Sum- mary of a LOLH table over a specified time (one year) associated with different combinations of PV/BTY ca- pacity allocations, i.e. specific reliability constrain, can be constructed to form the constrained optimization. 2.3. The Cons t r ai n ed Optimization Formulation The optimal size problem of a SPV system belongs to a constrained optimization. The optimum achieves at the best compromise betwe en system power reliability and cost. The objective function of the proposed system can be expressed as the installed cost: wb i CCPV CBTY C= ×+×+ (2) where C : the total cost for installed a SPV system, Ci : the initial cost fo r system i ns tallation, 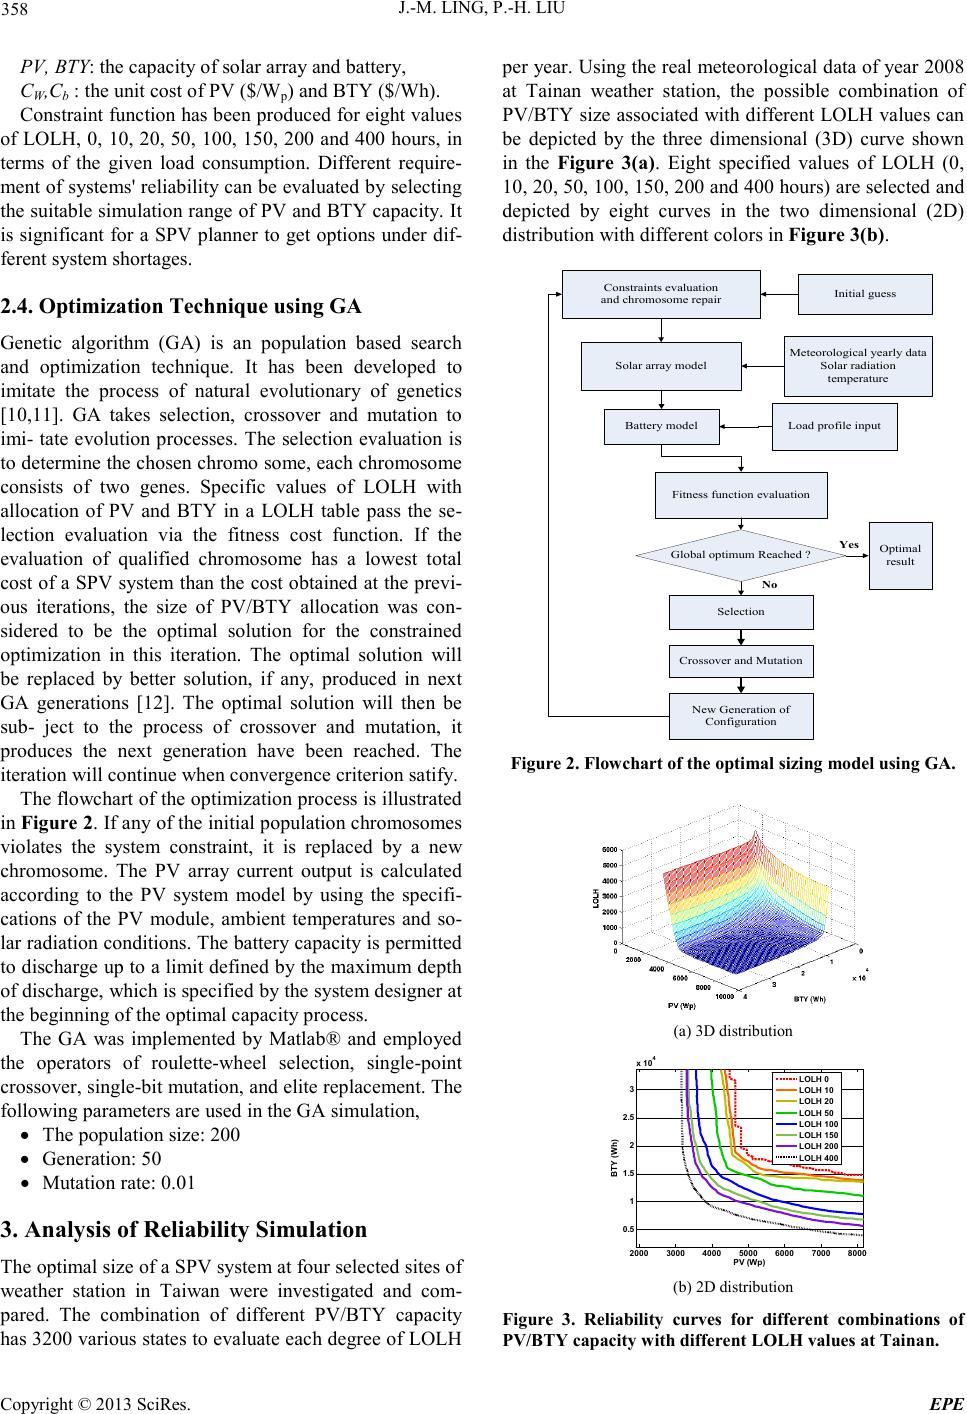 J.-M. LING, P.-H. LIU Copyright © 2013 SciRes. EPE 358 PV, BTY: the capacity of solar array and battery, CW,Cb : the unit cost of PV ($/Wp) and BTY ($/Wh). Constraint function ha s be en p ro duce d for eight values of LOLH, 0, 10, 20, 50, 100, 150, 200 and 400 hours, in terms of the given load consumption. Different require- ment of s ystems' reliabilit y can be evaluated by selecting the suitable simulation range of PV and BTY capacity. It is significa nt for a SPV planner to get options under dif- ferent s ystem shor ta ges . 2.4. Optimization Technique using GA Genetic algorithm (GA) is an population based search and optimization technique. It has been developed to imitate the process of natural evolutionary of genetics [10,11]. GA takes selection, crossover and mutation to imi- tate evolution processes. The selection eva luation i s to d eter mine the cho sen c hro mo some, each chro moso me consists of two genes. Specific values of LOLH with allocation of PV and BTY in a LOLH table pass the se- lection evaluation via the fitness cost function. If the evaluation of qualified chromosome has a lowest total cost of a SPV system than the cost obtained at the previ- ous iterations, the size of PV/BTY allocation was con- sidered to be the optimal solution for the constrained optimization in this iteration. The optimal solution will be replaced by better solution, if any, produced in next GA generations [12]. The optimal solution will then be sub- ject to the process of crossover and mutation, it produces the next generation have been reached. The iteration will continue when convergence c riterion satify. The flo wchart of the opti mization pr ocess is illu strated in Figure 2. If any of the initial population chromosomes violates the system constraint, it is replaced by a new chromosome. The PV array current output is calculated according to the PV system model by using the specifi- cations of the PV module, ambient temperatures and so- lar radia tion conditions. T he battery capacit y is permitted to discharge up to a limit defined by the maximum depth of di scha r ge , which is speci fied by the s yste m desig ner at the beginning of the optimal capacit y process. The GA was implemented by Matlab® and employed the operators of roulette-wheel selection, single-point crosso ver , si ngle-bit mutatio n, and elite r eplace ment. The following par ameters are used in the GA simulatio n, • The populatio n size: 200 • Generation: 50 • Mutation rate: 0.01 3. Analysis of Reliability Simulation The optimal size of a SP V system at four selected sites of weather station in Taiwan were investigated and com- pared. The combination of different PV/BTY capacity has 3200 various states to evaluate each degree of LOLH per year. Using the real meteorolo gical data of year 2008 at Tainan weather station, the possible combination of PV/BTY size associated with different LOLH values can be depicted by the three dimensional (3D) curve shown in the Figure 3(a). Eight specified values of LOLH (0, 10, 20, 50, 100, 150, 200 and 400 hours) are selected and depicted by eight curves in the two dimensional (2D) distribution with d ifferent colors in Figure 3(b). Initial guess Constraints evaluation and chromosome repair Meteorological yearly data Solar radiation temperature Solar array model Battery model Optimal result Selection Crossover and Mutation New Generation of Configuration Yes No Fitness function evaluation Global optimum Reached ? Load profile input Figure 2. Flowchart of the optimal sizing model using G A. (a) 3D dis tr ibutio n 20003000 40005000 60007000 8000 0.5 1 1.5 2 2.5 3 x 10 4 BTY (Wh) PV (W p) LOLH 0 LOLH 10 LOLH 20 LOLH 50 LOLH 100 LOLH 150 LOLH 200 LOLH 400 (b) 2D distribution Figure 3. Reliability curves for different combinations of PV/BTY capacity with diff erent LOLH values at Tainan. 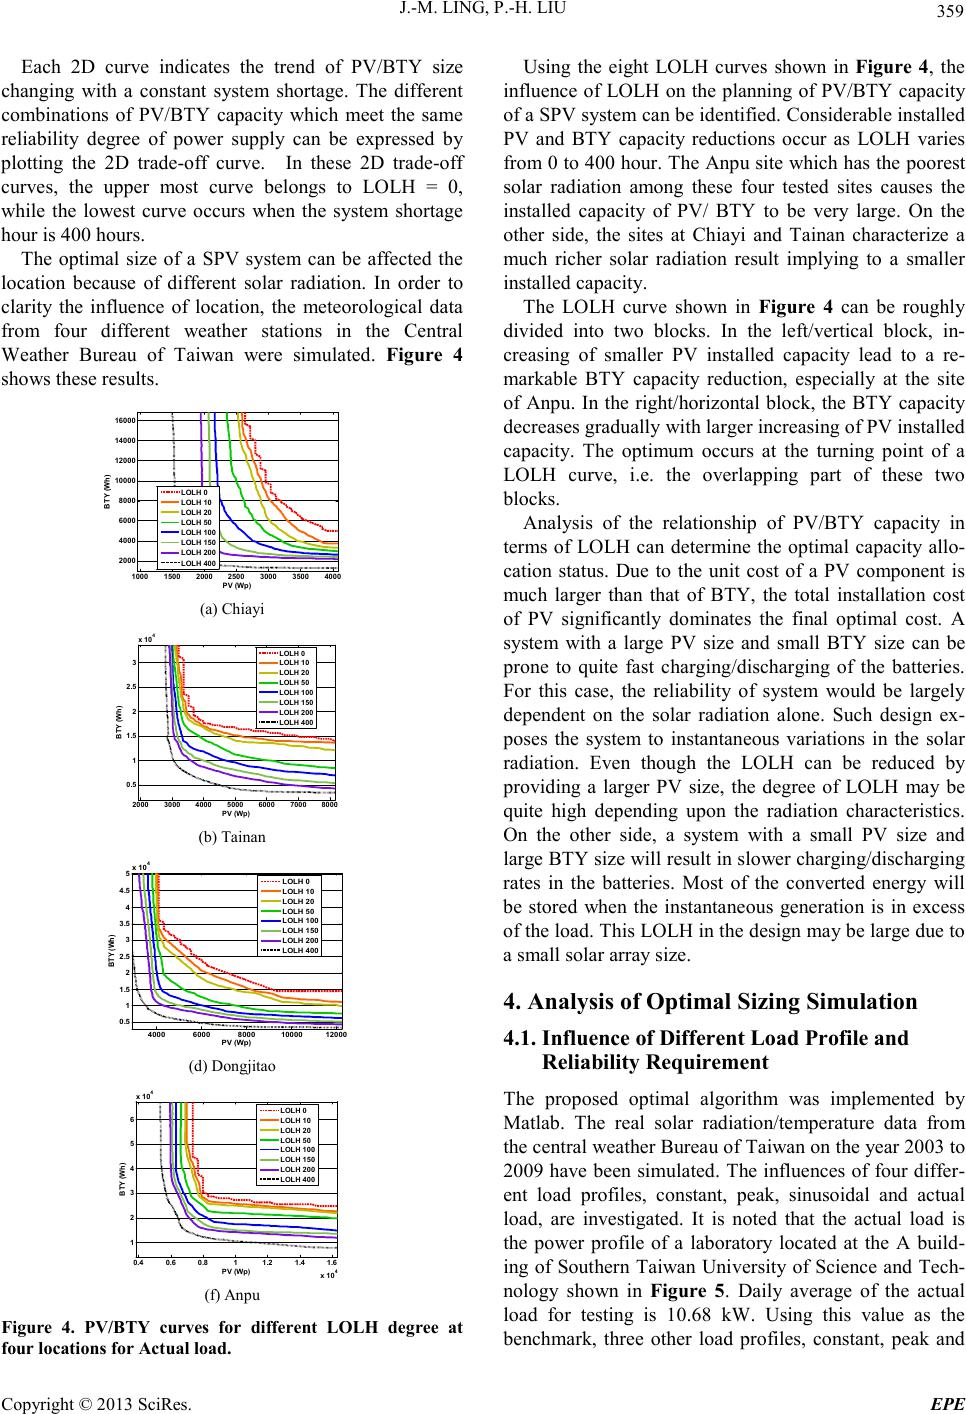 J.-M. LING, P.-H. LIU Copyright © 2013 SciRes. EPE 359 Each 2D curve indicates the trend of PV/BTY size changing with a constant system shortage. The different combinations of PV/BTY capacity which meet the same reliability degree of power supply can be expressed by plotting the 2D trad e -off curve. In these 2D trad e-off curves, the upper most curve belongs to LOLH = 0, while the lowest curve occurs when the system shortage hour i s 400 hours. The optimal size of a SPV system can be affected the location because of different solar radiation. In order to clarity the influence of location, the meteorological data from four different weather stations in the Central Weather Bureau of Taiwan were simulated. Figure 4 shows these results. 1000 1500 20002500 3000 3500 4000 2000 4000 6000 8000 10000 12000 14000 16000 BTY (Wh) PV (W p) LOLH 0 LOLH 10 LOLH 20 LOLH 50 LOLH 100 LOLH 150 LOLH 200 LOLH 400 (a) Chiayi 2000 3000 4000 5000 6000 70008000 0.5 1 1.5 2 2.5 3 x 10 4 BTY (Wh) PV (W p) LOLH 0 LOLH 10 LOLH 20 LOLH 50 LOLH 100 LOLH 150 LOLH 200 LOLH 400 (b) Tainan 4000 6000 800010000 12000 0.5 1 1.5 2 2.5 3 3.5 4 4.5 5x 10 4 BTY (Wh) PV (W p) LOLH 0 LOLH 10 LOLH 20 LOLH 50 LOLH 100 LOLH 150 LOLH 200 LOLH 400 (d) Dongj itao 0.4 0.6 0.8 11.2 1.4 1.6 x 10 4 1 2 3 4 5 6 x 10 4 BTY (Wh) PV (W p) LOLH 0 LOLH 10 LOLH 20 LOLH 50 LOLH 100 LOLH 150 LOLH 200 LOLH 400 (f) Anpu Figure 4. PV/BTY curves for different LOLH degree at four locations for Actu al load. Using the eight LOLH curves shown in Figure 4, the influence of LO LH on the planning of PV/BTY capacity of a SP V s ys te m ca n be ide nti fied. Considerable installed PV and BTY capacity reductions occur as LOLH varies from 0 to 400 hour. T he Anpu site which has the poorest solar radiation among these four tested sites causes the installed capacity of PV/ BTY to be very large. On the other side, the sites at C hiayi and Tainan characterize a much richer solar radiation result implying to a smaller installed capacity. The LOLH curve shown in Figure 4 can be roughly divided into two blocks. In the left/vertical block, in- creasing of smaller PV installed capacit y lead to a re- markable BTY capacity reduction, especially at the site of Anp u. In the right/horizontal block, the BTY capacity decreases gradually with larger increasing of PV installed capacity. The optimum occurs at the turning point of a LOLH curve, i.e. the overlapping part of these two blocks. Analysis of the relationship of PV/BTY capacity in terms o f LOLH can determine the optimal capacity allo- cation status. Due to the unit cost of a PV component is much larger than that of BTY, the total installation cost of PV significantly dominates the final optimal cost. A system with a large PV size and small BTY size can be prone to quite fast charging/discharging of the batteries. For this case, the reliability of system would be largely dependent on the solar radiation alone. Such design ex- poses the system to instantaneous variations in the solar radiation. Even though the LOLH can be reduced by providing a larger PV size, the degree of LOLH may be quite high depending upon the radiation characteristics. On the other side, a system with a small PV size and large BTY size will result in slo wer charging/discharging rates in the batteries. Most of the converted energy will be stored when the instantaneous generation is in excess of the load. This LO LH in the d esi gn may be large due to a small solar array size. 4. Analysis of Optimal Sizing Simulation 4.1. Influence of Different Load Profile and Reliability Requirement The proposed optimal algorithm was implemented by Matlab. The real solar radiation/temperature data from the central weather Bureau of T aiwan on the year 2003 to 2009 have been simulated. The influences of four differ- ent load profiles, constant, peak, sinusoidal and actual load, are investigated. It is noted that the actual load is the power profile of a laboratory located at the A build- ing of Southern T aiwan Universit y of Science and Tech- nology shown in Figure 5. Daily average of the actual load for testing is 10.68 kW. Using this value as the benchmark, three other load profiles, constant, peak and  J.-M. LING, P.-H. LIU Copyright © 2013 SciRes. EPE 360 sinusoidal, can be evaluated to investigate the impacts result from different load profiles during SPV system planning. This optimal result of PV/BTY corresponds to the fol lowing hours o f s yst e m sho rt age , e . g., 0 , 10 , 20, 5 0, 150, 200 and 400 as shown in Table 1. It can be found that the optimal cost for installation is sensitive to the desired system reliability. The installed cost of a SPV system will increase to meet the desired higher system reliability requirement, i.e., LOLH is in- versely proportional to system cost. As for the influence of load profile, we can verify the phenomenon that the installation cost of a SPV implemented in actual load is lower than other three load types at four testing sizes because of the diversity of load profile. The highest cost often occurs in the sinusoidal load, it concentrates the load consumption in one half of period time. Influence of locations to the optimal cost can be con- cluded by the characteristics of solar radiation. Chiayi region has the lo west total installation cost with its good solar radiation and ambient temperature average. Conversely, Anpu has the highest installed cost com- pared with other regions for the same reason. 01000 2000 3000 40005000 6000 7000 80009000 0 20 40 60 80 100 120 Hour Load (kW) Figure 5. Hourl y profile of testing load. Table 1. The o ptimal size of a spv at 4 sites under four dif feren t l oad pat t e r ns. (a) Chiayi Chiayi Fixed load Peak load S i nu s o idal load A c t ua l load LOLH (hours ) PV (Wp) BT Y (Wh) C ost (USD) PV (Wp) BTY ( Wh) Cos t (U SD) PV (Wp) BTY ( Wh) Cost (USD) PV (Wp) BTY (W h) Cost (U SD) 0 3913.7 12612.4 21505.2 3909.5 15114.2 21971.9 3910.0 13778.2 21714.1 2871.5 11397.0 16195.7 10 3896.4 11702.7 21243.6 3893.0 14864.1 21842.6 3884.5 13380.2 21512.5 2824.1 10788.8 15846.7 20 3945.1 9107.1 20975.3 3865.5 14934.8 21722.6 3875.9 12791.9 21356.1 2748.2 10320.1 15386.0 50 3783.6 8767.5 20123.2 3735.6 14996.6 21102.6 3782.1 9367.0 20232.5 2495.4 9982.8 14089.6 100 3462.9 10170.2 18835.1 3753.0 8606.3 19942.7 3243.2 11375.0 18000.6 2240.5 8413.8 12543.7 150 3145.3 10998.3 17450.6 3442.0 9359.4 18575.7 2916.8 8865.8 15923.1 2145.9 6488.5 11708.3 200 2900.0 10225.6 16106.3 3369.9 7420.5 17847.3 2647.5 8786.2 14597.1 2065.2 3364.7 10707.0 400 2427.1 4377.9 12665.7 2580.6 2625.2 13072.0 2016.1 3423.9 10479.9 1602.7 2501.0 8287.8 (b) Tainan Tainan Fixed load Peak load Si nus oidal load Ac t ual load LOLH (hours ) PV (Wp) BTY (Wh) C ost (USD) PV (Wp) BTY (W h) Cos t (U SD) PV (Wp) BTY (W h) Cos t (U SD) PV (Wp) BTY ( Wh) Cos t (U SD) 0 3558.5 18036.9 20832.3 3655.0 21556.7 21987.3 3606.2 18716.9 21196.9 3515.0 21456.0 21286.1 10 3587.0 16118.5 20597.4 3715.6 16879.3 21371.3 3600.4 18103.3 21049.2 3409.3 20956.6 20674.3 20 3618.5 15421.0 20615.2 3622.7 15629.5 20676.1 3657.9 14596.0 20646.4 3298.9 20789.3 20104.6 50 3528.6 13967.3 19894.3 3663.4 15284.7 20806.8 3568.9 14185.0 20133.0 3247.2 19599.6 19621.3 100 3454.4 13122.1 19368.5 3620.8 16108.7 20760.2 3481.0 13112.4 19496.1 3290.9 15090.1 18955.8 150 3375.4 12404.8 18844.5 3612.0 14715.7 20446.0 3386.1 12291.3 18874.3 3165.1 15155.8 18356.3 200 3281.8 12314.1 18371.3 3455.8 17170.2 20163.7 3280.0 11758.9 18254.6 3027.5 15792.7 17810.7 400 3060.4 10631.6 16966.2 3262.9 14874.9 18777.7 3014.3 10708.7 16756.8 2946.3 10736.0 16431.2 (c) Anpu A npu Fixed load Peak load S inu s oidal load A ctual load LOLH (hours ) PV (Wp) BTY ( Wh) Cos t (U SD) PV (Wp) BTY (Wh) Cost (USD) PV (Wp) BTY ( Wh) Cost (US D) PV (W p) BT Y (Wh) Cos t (US D) 0 15589.1 71962.0 89888.9 15589.1 71962.0 89888.9 15602.5 74994.8 90544.3 7777.5 31230.7 43936.6 10 15416.4 70954.2 88851.8 15416.4 70954.2 88851.8 14921.4 70978.2 86447.4 7473.5 29880.6 42194.1 20 15164.4 71332.6 87699.1 15164.4 71332.6 87699.1 14806.9 70079.7 85714.7 7210.6 29149.6 40771.9 50 13538.2 63854.2 78327.6 13538.2 63854.2 78327.6 13600.8 64959.3 78847.5 6697.7 38271.3 40051.4 100 12301.0 56919.5 70955.4 12301.0 56919.5 70955.4 12290.6 56019.9 70730.0 6395.1 35393.9 38018.4 150 11729.7 42473.4 65362.0 11729.7 42473.4 65362.0 11284.0 46565.0 63989.4 5923.7 40131.1 36646.0 200 11053.5 35342.3 60682.3 11053.5 35342.3 60682.3 10485.3 35775.6 58001.1 6152.1 33338.1 36435.4 400 7552.1 43976.5 45321.1 7552.1 43976.5 45321.1 6849.1 40783.1 41277.6 5594.9 31115.5 33290.4  J.-M. LING, P.-H. LIU Copyright © 2013 SciRes. EPE 361 0.5 11.5 2 x 10 4 2500 3000 3500 4000 0 1 2 3 4 x 10 4 55 50 60 45 40 30 35 25 20 BTY (Wh) 15 10 PV (Wp) 5 Total cost (US$) 1.8 1.9 22.1 2.2 x 10⁴ 3400 3600 3800 4000 0 1 2 3 4 5 x 10⁴ 60 50 45 55 40 35 30 25 20 15 BTY (Wh) 10 PV (Wp) 5 Total cost (US$) 1.851.9 1.95 2 x 10 4 4850 4900 4950 5000 0 2 4 6 8 x 10 4 60 55 45 40 50 35 30 25 BTY (Wh) 20 15 10 PV (Wp) 5 Total cost (US$) 22.2 2.4 2.6 x 10 4 6200 6400 6600 6800 0 2 4 6 8 x 10 4 60 50 55 45 40 35 30 25 20 15 BTY (Wh) 10 PV (Wp) 5 Total cost (US$) 2.8 2.9 33.1 x 10 4 7900 8000 8100 8200 0 2 4 6 8 10 x 10 4 55 60 50 45 40 35 30 25 20 15 BTY (Wh) PV (Wp) 10 5 Total cost (US$) (a) Chiayi (b) Tainan (c) Tawu (d) Lanyu (e) Anpu Figure 6. The optimal sizing curve with different ratio of to PV/BTY cost ( LOLH=0, the actual load). Table 2. T he optimal sizing res ults with different ratio of pv/bty cost under actual load. Cost ra tio Chiayi Tainan Tawu Lanyu Anp u PV (Wp) BTY (W h) Cost (US$) PV (Wp) BTY (W h) Cost (US$) PV (Wp) BTY (W h) Cost (US$) PV (Wp) BTY (W h) Cost (US$) PV (Wp) BTY (W h) Cost (US$) 5 3517.6 6449.5 4680.0 3838.9 18422.0 7323.7 4968.3 18767.0 8490.4 6622.6 20479.9 10434.3 8161.1 28403.0 13474.5 10 2984.2 10286.6 7812.9 3793.9 18724.6 11032.2 4911.9 19164.4 13294.5 6309.2 22826.6 16727.9 8161.1 28403.1 21419.2 15 2940.5 10811.2 10692.3 3558.2 21411.6 14560.3 4897.9 19337.0 18068.8 6266.4 23335.2 22843.8 7968.7 30737.6 29256.4 20 2668.9 15830.1 13474.3 3556.3 21446.6 18023.3 4892.2 19436.4 22833.7 6253.6 23552.2 28936.5 7967.7 30755.3 37013.3 25 2667.9 15850.9 16071.9 3556.0 21453.5 21485.2 4888.8 19510.5 27594.3 6246.3 23714.7 35020.2 7967.3 30764.4 44769.4 30 2666.6 15884.1 18668.1 3555.5 21465.9 24946.5 4887.4 19548.5 32352.6 6243.2 23800.8 41099.3 7966.8 30777.5 52524.9 35 2666.7 15881.7 21264.1 3555.3 21473.4 28407.5 4885.6 19606.5 37109.4 6240.8 23878.9 47175.7 7966.6 30784.3 60280.3 40 2665.8 15911.3 23858.7 3555.2 21475.3 31868.4 4884.9 19635.0 41865.2 6239.2 23938.3 53250.3 7966.5 30786.8 68035.5 45 2665.3 15934.8 26453.5 3554.9 21488.1 35329.0 4884.4 19656.2 46620.3 6237.6 24008.3 59324.0 7966.3 30792.8 75790.6 50 2665.1 15945.1 29048.2 3554.8 21493.7 38789.6 4885.1 19627.2 51376.1 6237.2 24030.6 65396.4 7966.3 30795.5 83545.6 55 2664.6 15981.7 31645.0 3555.0 21484.2 42250.3 4884.0 19675.0 56129.4 6237.6 24010.2 71468.4 7966.3 30797.7 91300.6 60 2665.1 15944.2 34237.0 3554.7 21497.3 45710.7 4883.3 19713.2 60883.2 6236.6 24065.2 77539.5 7966.3 30797.5 99055.5 4.2. Influence of Component Cost Variations The variations of component cost for a PV system is un- cer tain. In this st ud y, the unit cost of a PV is set to be the range of 4.67~5.61 (USD/Wp) , and a BTY is 0.093~ 0.280 (USD/Wh). The base cost of BTY capacity is set to 0.1947 (USD/Wh) for demonstration. A feasible range of cost ratio will be tested b y 5~60, it ca n be represented as the ratio of Cw to Cb shown in equation 2. 12 discrete values of cost ratio changing from 5 to 60 with increment 5 were used to show its effects. The fol- lowing simulation is derived from LOLH equals to 0. The optimal size in terms of different component cost ratios are depicted in Figure 6 and Table 2. As sh o wn i n Figure 6, the optimal size of PV and BTY is insensitive to the changing of cost ratio when its value greater than 10 to 15. It is believed that the value of cost ratio to be smaller than 2 0 is unreasonable. I n so me sen ses, it mea n s explicitly the robust of the optimal results regardless of price fluctuation. On the other side, a installed cost in- crease proportionally when the cost ratio grows. Results show the optimal result regional dependence. Different pattern of optimal size appears in different re- gion. The highly regional feature for the planning of a renewable system should be identified. Challenge from volatility and spatia l d iversit y o f solar re source is anot her issue. The optimal size of a SPV system is obviously reduced when the quality of the solar resources increas- ing. 5. Conclusions At different regions with various meteorological condi- tions and solar energy reserves, the electric power pro- duction from renewable energy is highly unreliable and unpredictable. Well-designed system is a basic require- ment for any system planner. In the paper, Different re- quirements of system reliability are conducted statistic- cally to achieve the optimal capacity allocation for a SPV system. Var iations resulted from the cost of SPV com- ponent and load amount are investigated to satisfy the specific reliability requirement to demonstrate the im- pacts of system uncertainty in the long-term plannin g. The optimal size of a SPV system is found eff iciently by a GA optimization technique. Global optimum with relative computation simplicity has been attained. The simulation resul ts of this paper is believed to be a worthy reference for decision-making can be considered as im-  J.-M. LING, P.-H. LIU Copyright © 2013 SciRes. EPE 362 portant references of the photo voltaic generatio n installa- tion. 6. Acknowled gements The authors would like to thank the financial support of National Science Council under grant number NSC- 101-2221-E-218-043. REFERENCES [1] J. J. Hwang, “Promotional Policy for Renewable Energy Development in Taiwan,” Renewable and Sustainable Energ y Reviews, Vol. 14, No. 3, 2010, pp. 1079-1087. doi:10.1016/j.rser.2009.10.029 [2] R. Hara, et al., “Testin g the Technologies: Demonstration Grid-connected Photovoltaic Projects in Japan,” IEEE Power and Energy Magazine, Vol. 7, No. 3, May/June 2009, pp . 77-85. [3] W. X. Shen, “Optimally Sizing of Solar Array and Bat- tery in Standalone Photovoltaic System in Malaysia,” Renewable Energy, Vol. 34, No.1, 2009, pp. 348-352. doi:10.1016/j.renene.2008.03.015 [4] G. B. Shrestha and L. Goel , “A Study on Optimal Sizing of Stan d-alone Photovoltaic Stations,” IEEE Transactions on Energy Con ver sion, Vol.13, No. 4, 1998, pp.373-378. doi:10.1109/60.736323 [5] S. B. Borowy and Z . M. Salameh, “Methodology for Op- timal Sizing of the Combination of a Battery Bank and PV Array in a Wind/PV Hybrid System,” IEEE Transac- tions on Energy Conversion, Vol. 11, No. 2, 1996, pp.367-375. [6] Jose L. Bernal-Agustin and R. Dufo-Lopez, “Simulation and Optimization of Stand-alone Hybrid Renewable Energy Systems,” Renewable and Sustainable Energy Reviews, Vol. 13, No. 8, 2009, pp. 2111-2118. [7] RETS, 2004. Available: http://www.retscreen.net/ang/t_software.php [8] RERL, 2007. Available: http://www.ceere. org/rerl/projects/software/hybrid2/Hy2_ users_manual.pdf. [9] Homer, The Hybrid Optimization Model for Electric Re- newable, Available: http://www.nrel.gov/homer/includes/downloads/HOMER Brochure_English.pdf. [10] J. Holland, Adaptation in Natural and Artificial Systems: The University of Michigan. 1975 [11] P. Arun, R. Banerjee and S. Bandyopadhyay, “Optimal sizing of Photovoltaic Battery Systems Incorporating Uncertainty through Design Space Approach,” Solar Energy, Vol. 83, No.7, 2009, pp.1013-1025. doi:10.1016/j.solener.2009.01.003 [12] Y. X. Hong, Z. Wei, L. Lin and F. H. Zhao, “Opimal Sizing Method for Stand-alone Hybrid Solar-wind Sys- tem with LPSP Technology by using Genetic Algorithm,” Solar Energy, 2008, pp. 354-367. |