

Paper Menu >>
Journal Menu >>
 Vol.3, No.1, 56-65 (2011) doi:10.4236/health.2011.31011 Copyright © 2011 SciRes. Openly accessible at http://www.scirp.org/journal/HEALTH/ Health Performance comparison between three intraoral image receptors of different technology at a variety of tube potential, tube current and exposure time settings using a stepwedge phantom Elli Katsoni1*, Ioannis A. Tsalafoutas2, Panagiotis Gritzalis3, Evripidis Stefanou3, Evangelos Georgiou1, Emmanuel Yakoumakis1 1Department of Medical Physics, Medical School, University of Athens, Athens, Greece; 2Medical Physics Department, Agios Savvas Hospital, Athens, Greece; 3Department of Oral Diagnosis and Radiology, Dental School, University of Athens, Athens, Greece; *Corresponding Author: [email protected] Received 22 November 2010; revise 30 November 2010; accepted 3 December 2010. ABSTRACT Purpose: To comparatively evaluate the per- formance of three intraoral image receptors of different technology when exposed to different X-ray beam spectra, dose and dose rate levels using a stepwedge phantom. Materials and methods: The intraoral radiographic receptors evaluated were: the Kodak Insight F speed class film, the Kodak RVG 6000, and the Duerr Vis- tascan Combi PSP system. A dental quality control phantom made of Plexiglas, containing an aluminium stepwedge with 12 steps and 7 holes drilled in each step was radiographed using a dental X-ray unit offering a wide range of tube potential, tube current and exposure time settings. The visibility of the holes in the images produced with each one of the three receptors was assessed by three independent observers. For each image the total image qual- ity score (TS) was derived from the summation of the number of visible holes in each step. The numbers of perceptible holes in each experi- mental condition (TSs) were statistically ana- lyzed through use of analysis of variance. In- traobserver and interobserver agreement was also measured. Results: Vistascan exhibited the most extended useful exposure range, follow ed by RVG 6000 and Insight. RVG 6000 exhibited the largest TS values in all tube potential set- tings except 70 kV where the Vistascan per- formed better. Insight performed better than Vistascan only at 60 and 63 kV. Vistascan per- formed better at 66 and 70 kV, Insight at 60 and 66 kV, whereas RVG performed equally well at all tube potential settings, except than at 52 and 70 kV. For the Insight the largest TS values w ere obtained with the smallest ESAK values whe- reas with the Vistascan the largest TS were ob- tained with ESAK values that where the largest observed. Conclusions: The performance of all receptors tested was greatly dependent on the exposure parameters and mainly on the kV set- tings. Overall, the RVG 6000 offered the best image quality at doses somewhere in between those required by the Insight and t he Vistascan. Keywords: Radiography; Dental; Digital; Dosage 1. INTRODUCTION According to the UNSCEAR 2000 Report, dental in- traoral radiography is among the most frequently per- formed radiological procedures [1]. Although the patient exposure associated with dental radiography is relatively low, intraoral radiography should be optimised in order to keep the radiation risk “as low as reasonably achiev- able”, something that is widely known as the ALARA principle [2]. Over the past 20 years both the X-ray units and the X-ray receptors used in dental radiology have been evolved. Modern dental X-ray units incorporate high frequency generators, operate at higher tube potentials and produce X-ray spectra that have higher mean energy and therefore are more penetrating compared to those produced by older dental X-ray units. These improve- ments have contributed in the reduction of the radiation dose to the entrance skin surface of the patient and the 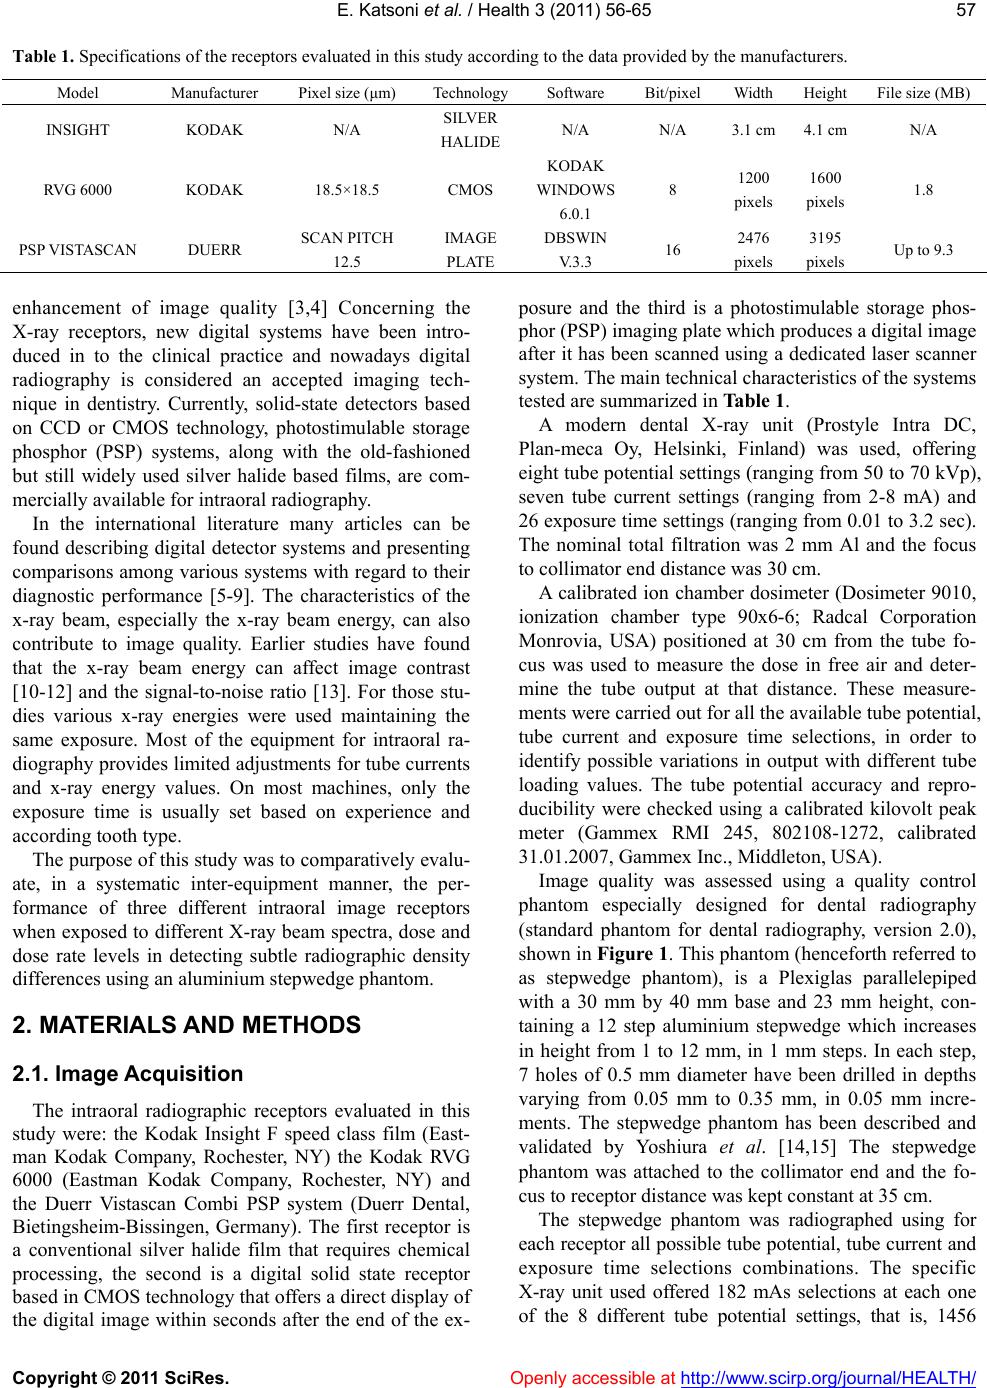 E. Katsoni et al. / Health 3 (2011) 56-65 Copyright © 2011 SciRes. Openly accessible at http://www.scirp.org/journal/HEALTH/ 57 Table 1. Specifications of the receptors evaluated in this study according to the data provided by the manufacturers. Model Manufacturer Pixel size (μm) TechnologySoftware Bit/pixelWidth Height File size (MB) INSIGHT KODAK N/A SILVER HALIDE N/A N/A 3.1 cm 4.1 cm N/A RVG 6000 KODAK 18.5×18.5 CMOS KODAK WINDOWS 6.0.1 8 1200 pixels 1600 pixels 1.8 PSP VISTASCAN DUERR SCAN PITCH 12.5 IMAGE PLATE DBSWIN V.3.3 16 2476 pixels 3195 pixels Up to 9.3 enhancement of image quality [3,4] Concerning the X-ray receptors, new digital systems have been intro- duced in to the clinical practice and nowadays digital radiography is considered an accepted imaging tech- nique in dentistry. Currently, solid-state detectors based on CCD or CMOS technology, photostimulable storage phosphor (PSP) systems, along with the old-fashioned but still widely used silver halide based films, are com- mercially available for intraoral radiography. In the international literature many articles can be found describing digital detector systems and presenting comparisons among various systems with regard to their diagnostic performance [5-9]. The characteristics of the x-ray beam, especially the x-ray beam energy, can also contribute to image quality. Earlier studies have found that the x-ray beam energy can affect image contrast [10-12] and the signal-to-noise ratio [13]. For those stu- dies various x-ray energies were used maintaining the same exposure. Most of the equipment for intraoral ra- diography provides limited adjustments for tube currents and x-ray energy values. On most machines, only the exposure time is usually set based on experience and according tooth type. The purpose of this study was to comparatively evalu- ate, in a systematic inter-equipment manner, the per- formance of three different intraoral image receptors when exposed to different X-ray beam spectra, dose and dose rate levels in detecting subtle radiographic density differences using an aluminium stepwedge phantom. 2. MATERIALS AND METHODS 2.1. Image Acquisition The intraoral radiographic receptors evaluated in this study were: the Kodak Insight F speed class film (East- man Kodak Company, Rochester, NY) the Kodak RVG 6000 (Eastman Kodak Company, Rochester, NY) and the Duerr Vistascan Combi PSP system (Duerr Dental, Bietingsheim-Bissingen, Germany). The first receptor is a conventional silver halide film that requires chemical processing, the second is a digital solid state receptor based in CMOS technology that offers a direct display of the digital image within seconds after the end of the ex- posure and the third is a photostimulable storage phos- phor (PSP) imaging plate which produces a digital image after it has been scanned using a dedicated laser scanner system. The main technical characteristics of the systems tested are summarized in Table 1. A modern dental X-ray unit (Prostyle Intra DC, Plan-meca Oy, Helsinki, Finland) was used, offering eight tube potential settings (ranging from 50 to 70 kVp), seven tube current settings (ranging from 2-8 mA) and 26 exposure time settings (ranging from 0.01 to 3.2 sec). The nominal total filtration was 2 mm Al and the focus to collimator end distance was 30 cm. A calibrated ion chamber dosimeter (Dosimeter 9010, ionization chamber type 90x6-6; Radcal Corporation Monrovia, USA) positioned at 30 cm from the tube fo- cus was used to measure the dose in free air and deter- mine the tube output at that distance. These measure- ments were carried out for all the available tube potential, tube current and exposure time selections, in order to identify possible variations in output with different tube loading values. The tube potential accuracy and repro- ducibility were checked using a calibrated kilovolt peak meter (Gammex RMI 245, 802108-1272, calibrated 31.01.2007, Gammex Inc., Middleton, USA). Image quality was assessed using a quality control phantom especially designed for dental radiography (standard phantom for dental radiography, version 2.0), shown in Figure 1. This phantom (henceforth referred to as stepwedge phantom), is a Plexiglas parallelepiped with a 30 mm by 40 mm base and 23 mm height, con- taining a 12 step aluminium stepwedge which increases in height from 1 to 12 mm, in 1 mm steps. In each step, 7 holes of 0.5 mm diameter have been drilled in depths varying from 0.05 mm to 0.35 mm, in 0.05 mm incre- ments. The stepwedge phantom has been described and validated by Yoshiura et al. [14,15] The stepwedge phantom was attached to the collimator end and the fo- cus to receptor distance was kept constant at 35 cm. The stepwedge phantom was radiographed using for each receptor all possible tube potential, tube current and exposure time selections combinations. The specific X-ray unit used offered 182 mAs selections at each one o f the 8 different tube potential settings, that is, 1456 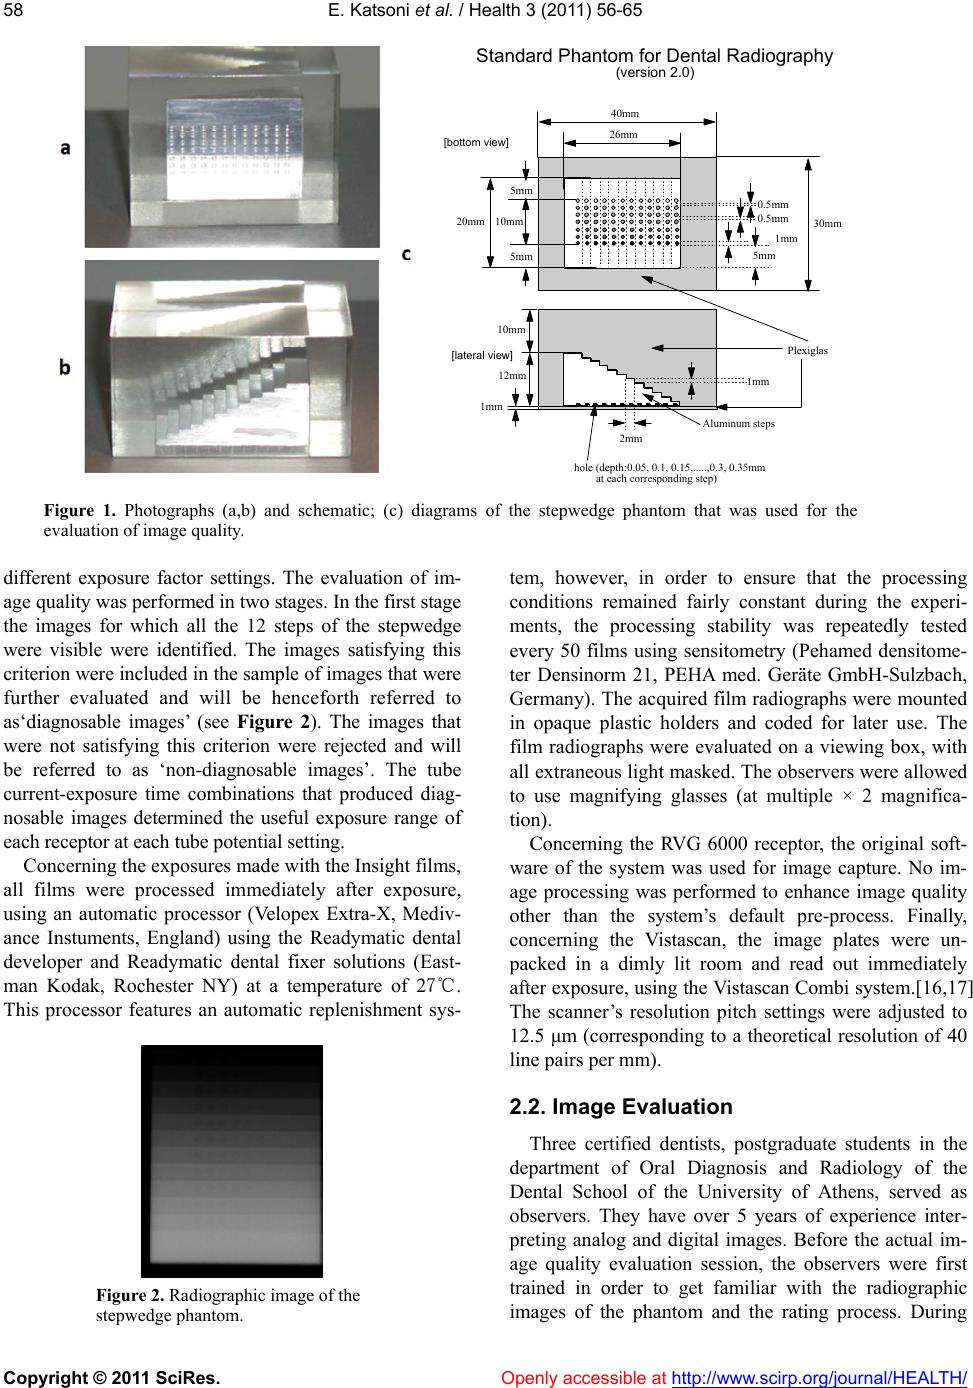 E. Katsoni et al. / Health 3 (2011) 56-65 Copyright © 2011 SciRes. Openly accessible at http://www.scirp.org/journal/HEALTH/ 58 26mm 20mm 1mm 12mm 10mm 1mm 2mm 0.5mm 1mm 5mm Plexiglas Aluminum steps hole (depth:0.05, 0.1, 0.15,.....,0.3, 0.35mm at each corresponding step) 10mm 30mm 40mm Standard Phantom for Dental Radiography (version 2.0) 0.5mm [bottom view] [lateral view] 5mm 5mm Figure 1. Photographs (a,b) and schematic; (c) diagrams of the stepwedge phantom that was used for the evaluation of image quality. different exposure factor settings. The evaluation of im- age quality was performed in two stages. In the first stage the images for which all the 12 steps of the stepwedge were visible were identified. The images satisfying this criterion were included in the sample of images that were further evaluated and will be henceforth referred to as‘diagnosable images’ (see Figure 2). The images that were not satisfying this criterion were rejected and will be referred to as ‘non-diagnosable images’. The tube current-exposure time combinations that produced diag- nosable images determined the useful exposure range of each receptor at each tube potential setting. Concerning the exposures made with the Insight films, all films were processed immediately after exposure, using an automatic processor (Velopex Extra-X, Mediv- ance Instuments, England) using the Readymatic dental developer and Readymatic dental fixer solutions (East- man Kodak, Rochester NY) at a temperature of 27℃. This processor features an automatic replenishment sys- Figure 2. Radiographic image of the stepwedge phantom. tem, however, in order to ensure that the processing conditions remained fairly constant during the experi- ments, the processing stability was repeatedly tested every 50 films using sensitometry (Pehamed densitome- ter Densinorm 21, PEHA med. Geräte GmbH-Sulzbach, Germany). The acquired film radiographs were mounted in opaque plastic holders and coded for later use. The film radiographs were evaluated on a viewing box, with all extraneous light masked. The observers were allowed to use magnifying glasses (at multiple × 2 magnifica- tion). Concerning the RVG 6000 receptor, the original soft- ware of the system was used for image capture. No im- age processing was performed to enhance image quality other than the system’s default pre-process. Finally, concerning the Vistascan, the image plates were un- packed in a dimly lit room and read out immediately after exposure, using the Vistascan Combi system.[16,17] The scanner’s resolution pitch settings were adjusted to 12.5 μm (corresponding to a theoretical resolution of 40 line pairs per mm). 2.2. Image Evaluation Three certified dentists, postgraduate students in the department of Oral Diagnosis and Radiology of the Dental School of the University of Athens, served as observers. They have over 5 years of experience inter- preting analog and digital images. Before the actual im- age quality evaluation session, the observers were first trained in order to get familiar with the radiographic images of the phantom and the rating process. During 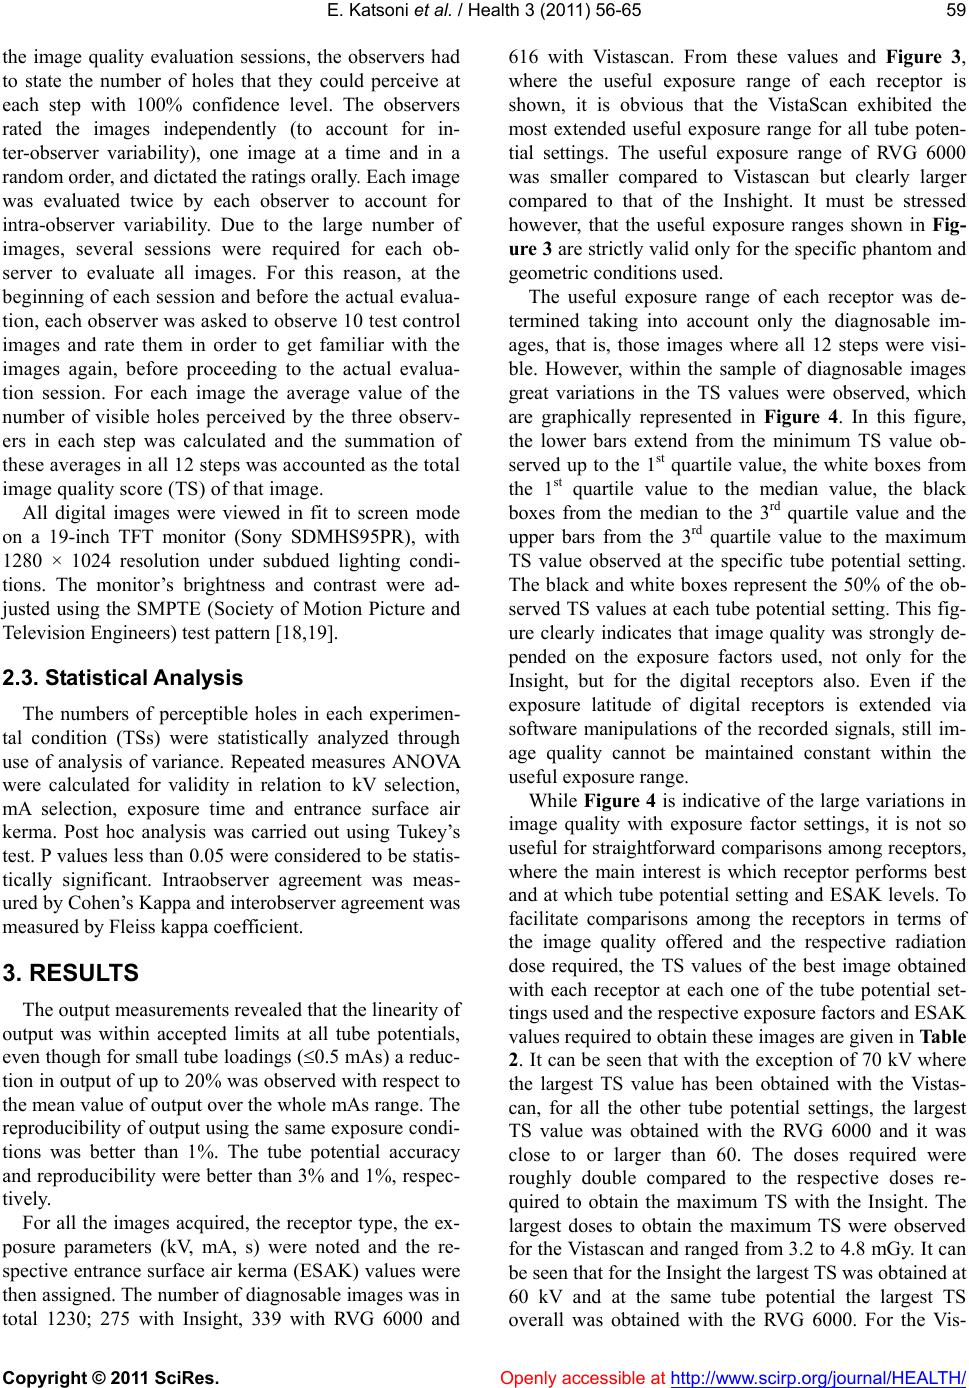 E. Katsoni et al. / Health 3 (2011) 56-65 Copyright © 2011 SciRes. Openly accessible at http://www.scirp.org/journal/HEALTH/ 59 the image quality evaluation sessions, the observers had to state the number of holes that they could perceive at each step with 100% confidence level. The observers rated the images independently (to account for in- ter-observer variability), one image at a time and in a random order, and dictated the ratings orally. Each image was evaluated twice by each observer to account for intra-observer variability. Due to the large number of images, several sessions were required for each ob- server to evaluate all images. For this reason, at the beginning of each session and before the actual evalua- tion, each observer was asked to observe 10 test control images and rate them in order to get familiar with the images again, before proceeding to the actual evalua- tion session. For each image the average value of the number of visible holes perceived by the three observ- ers in each step was calculated and the summation of these averages in all 12 steps was accounted as the total image quality score (TS) of that image. All digital images were viewed in fit to screen mode on a 19-inch TFT monitor (Sony SDMHS95PR), with 1280 × 1024 resolution under subdued lighting condi- tions. The monitor’s brightness and contrast were ad- justed using the SMPTE (Society of Motion Picture and Television Engineers) test pattern [18,19]. 2.3. Statistical Analysis The numbers of perceptible holes in each experimen- tal condition (TSs) were statistically analyzed through use of analysis of variance. Repeated measures ANOVA were calculated for validity in relation to kV selection, mA selection, exposure time and entrance surface air kerma. Post hoc analysis was carried out using Tukey’s test. P values less than 0.05 were considered to be statis- tically significant. Intraobserver agreement was meas- ured by Cohen’s Kappa and interobserver agreement was measured by Fleiss kappa coefficient. 3. RESULTS The output measurements revealed that the linearity of output was within accepted limits at all tube potentials, even though for small tube loadings (0.5 mAs) a reduc- tion in output of up to 20% was observed with respect to the mean value of output over the whole mAs range. The reproducibility of output using the same exposure condi- tions was better than 1%. The tube potential accuracy and reproducibility were better than 3% and 1%, respec- tively. For all the images acquired, the receptor type, the ex- posure parameters (kV, mA, s) were noted and the re- spective entrance surface air kerma (ESAK) values were then assigned. The number of diagnosable images was in total 1230; 275 with Insight, 339 with RVG 6000 and 616 with Vistascan. From these values and Figure 3, where the useful exposure range of each receptor is shown, it is obvious that the VistaScan exhibited the most extended useful exposure range for all tube poten- tial settings. The useful exposure range of RVG 6000 was smaller compared to Vistascan but clearly larger compared to that of the Inshight. It must be stressed however, that the useful exposure ranges shown in Fig- ure 3 are strictly valid only for the specific phantom and geometric conditions used. The useful exposure range of each receptor was de- termined taking into account only the diagnosable im- ages, that is, those images where all 12 steps were visi- ble. However, within the sample of diagnosable images great variations in the TS values were observed, which are graphically represented in Figure 4. In this figure, the lower bars extend from the minimum TS value ob- served up to the 1st quartile value, the white boxes from the 1st quartile value to the median value, the black boxes from the median to the 3rd quartile value and the upper bars from the 3rd quartile value to the maximum TS value observed at the specific tube potential setting. The black and white boxes represent the 50% of the ob- served TS values at each tube potential setting. This fig- ure clearly indicates that image quality was strongly de- pended on the exposure factors used, not only for the Insight, but for the digital receptors also. Even if the exposure latitude of digital receptors is extended via software manipulations of the recorded signals, still im- age quality cannot be maintained constant within the useful exposure range. While Figure 4 is indicative of the large variations in image quality with exposure factor settings, it is not so useful for straightforward comparisons among receptors, where the main interest is which receptor performs best and at which tube potential setting and ESAK levels. To facilitate comparisons among the receptors in terms of the image quality offered and the respective radiation dose required, the TS values of the best image obtained with each receptor at each one of the tube potential set- tings used and the respective exposure factors and ESAK values required to obtain these images are given in Table 2. It can be seen that with the exception of 70 kV where the largest TS value has been obtained with the Vistas- can, for all the other tube potential settings, the largest TS value was obtained with the RVG 6000 and it was close to or larger than 60. The doses required were roughly double compared to the respective doses re- quired to obtain the maximum TS with the Insight. The largest doses to obtain the maximum TS were observed for the Vistascan and ranged from 3.2 to 4.8 mGy. It can be seen that for the Insight the largest TS was obtained at 60 kV and at the same tube potential the largest TS overall was obtained with the RVG 6000. For the Vis- 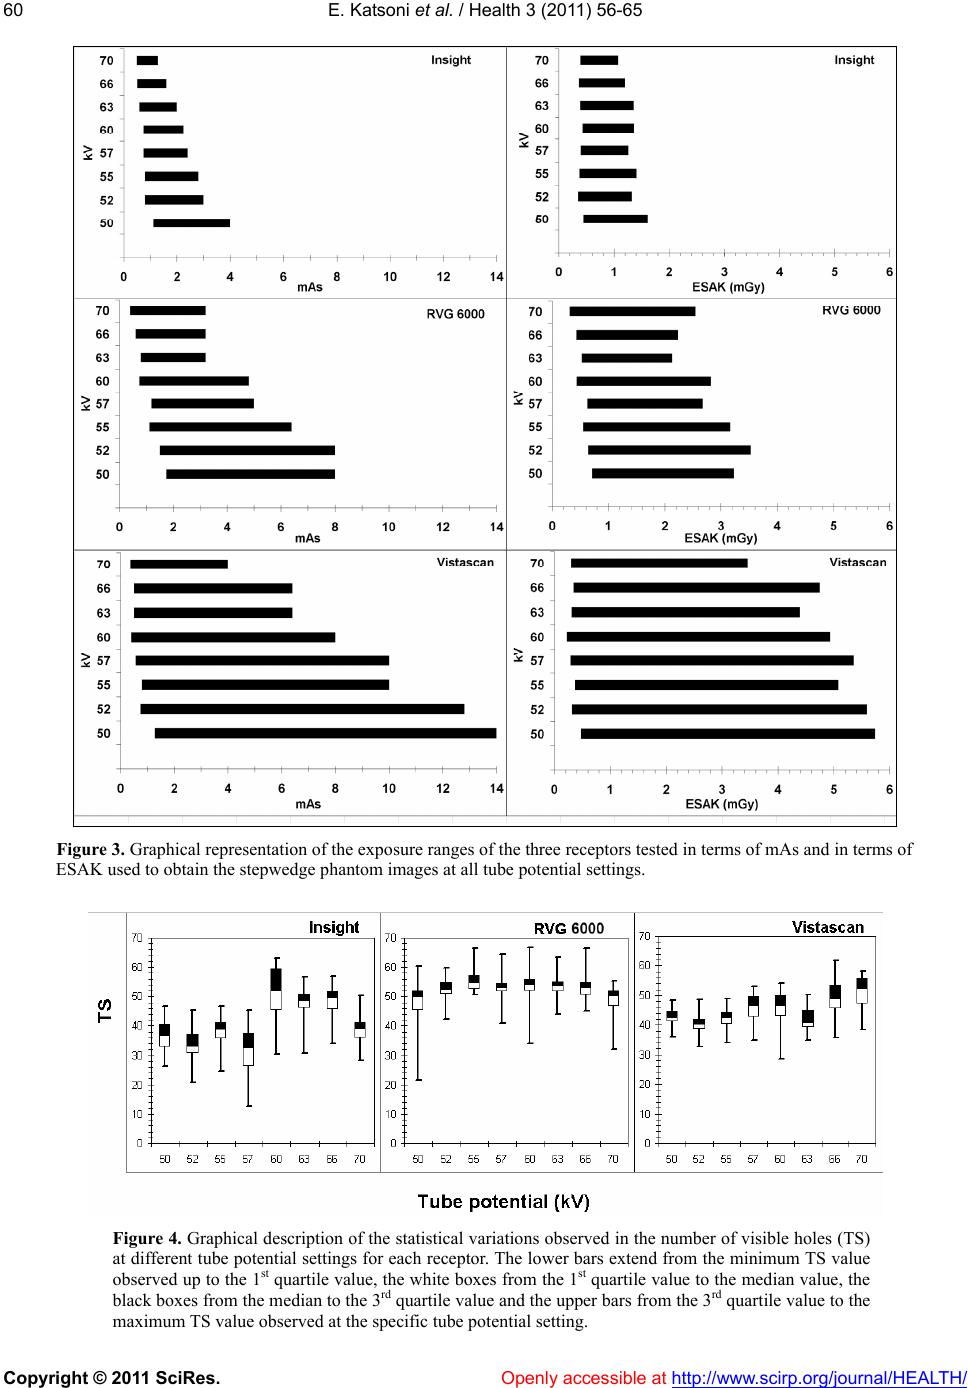 E. Katsoni et al. / Health 3 (2011) 56-65 Copyright © 2011 SciRes. http://www.scirp.org/journal/HEALTH/ 60 Figure 3. Graphical representation of the exposure ranges of the three receptors tested in terms of mAs and in terms of ESAK used to obtain the stepwedge phantom images at all tube potential settings. Figure 4. Graphical description of the statistical variations observed in the number of visible holes (TS) at different tube potential settings for each receptor. The lower bars extend from the minimum TS value observed up to the 1st quartile value, the white boxes from the 1st quartile value to the median value, the black boxes from the median to the 3rd quartile value and the upper bars from the 3rd quartile value to the maximum TS value observed at the specific tube potential setting. Openly accessible at 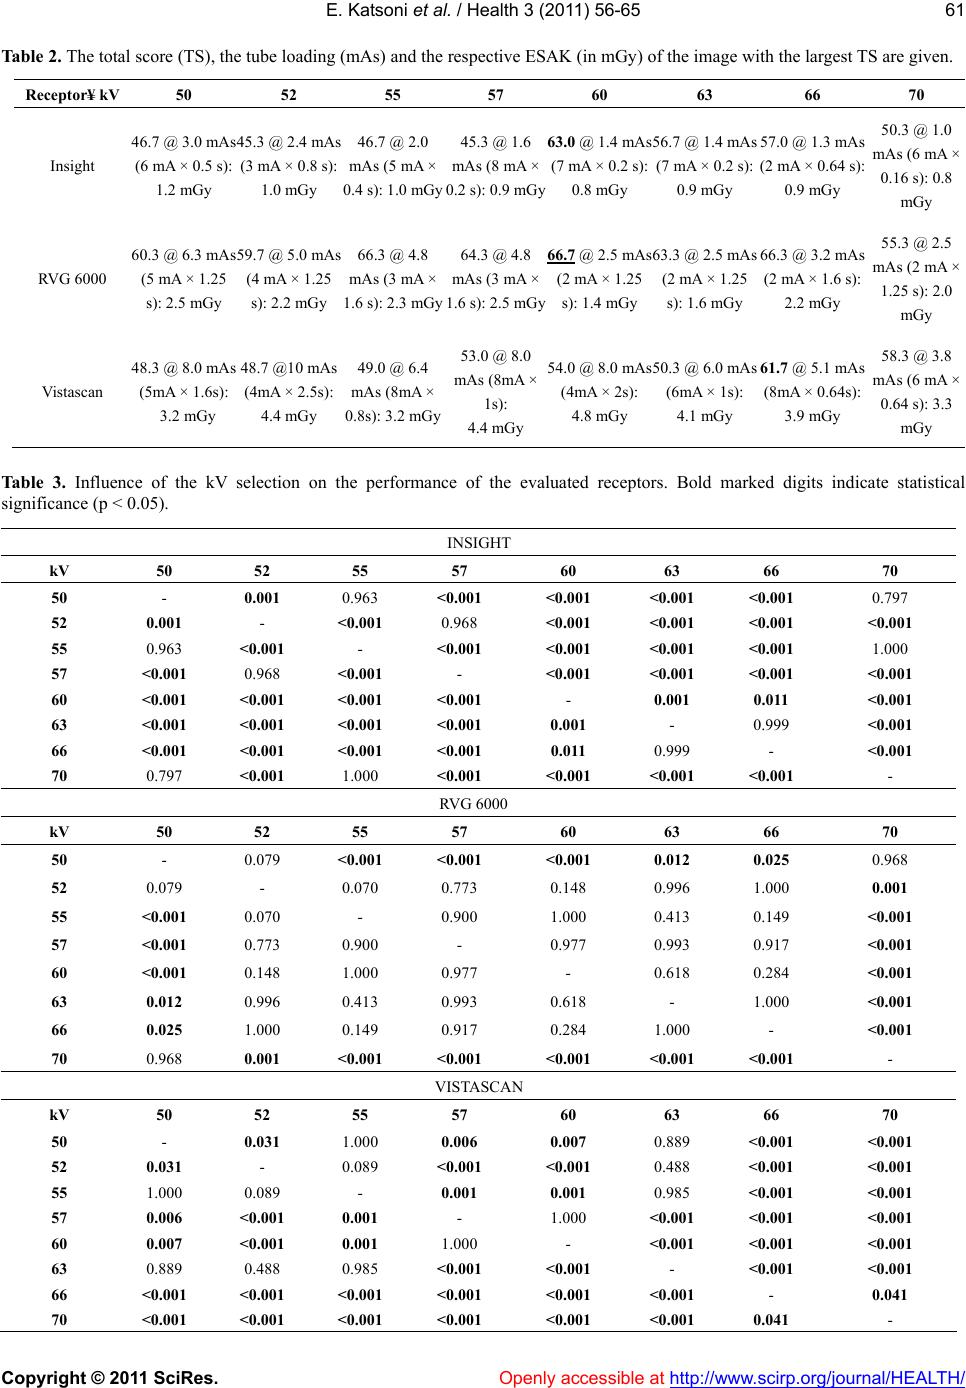 E. Katsoni et al. / Health 3 (2011) 56-65 Copyright © 2011 SciRes. Openly accessible at http://www.scirp.org/journal/HEALTH/ 61 Table 2. The total score (TS), the tube loading (mAs) and the respective ESAK (in mGy) of the image with the largest TS are given. Receptor¥ kV 50 52 55 57 60 63 66 70 Insight 46.7 @ 3.0 mAs (6 mA × 0.5 s): 45.3 @ 2.4 mAs (3 mA × 0.8 s): 1.0 mGy 1.2 mGy 46.7 @ 2.0 mAs (5 mA × 0.4 s): 1.0 mGy 45.3 @ 1.6 mAs (8 mA × 0.2 s): 0.9 mGy 63.0 @ 1.4 mAs (7 mA × 0.2 s): 0.8 mGy 56.7 @ 1.4 mAs (7 mA × 0.2 s): 0.9 mGy 57.0 @ 1.3 mAs (2 mA × 0.64 s): 0.9 mGy 50.3 @ 1.0 mAs (6 mA × 0.16 s): 0.8 mGy RVG 6000 60.3 @ 6.3 mAs (5 mA × 1.25 s): 2.5 mGy 59.7 @ 5.0 mAs (4 mA × 1.25 s): 2.2 mGy 66.3 @ 4.8 mAs (3 mA × 1.6 s): 2.3 mGy 64.3 @ 4.8 mAs (3 mA × 1.6 s): 2.5 mGy 66.7 @ 2.5 mAs (2 mA × 1.25 s): 1.4 mGy 63.3 @ 2.5 mAs (2 mA × 1.25 s): 1.6 mGy 66.3 @ 3.2 mAs (2 mA × 1.6 s): 2.2 mGy 55.3 @ 2.5 mAs (2 mA × 1.25 s): 2.0 mGy Vistascan 48.3 @ 8.0 mAs (5mA × 1.6s): 3.2 mGy 48.7 @10 mAs (4mA × 2.5s): 4.4 mGy 49.0 @ 6.4 mAs (8mA × 0.8s): 3.2 mGy 53.0 @ 8.0 mAs (8mA × 1s): 4.4 mGy 54.0 @ 8.0 mAs (4mA × 2s): 50.3 @ 6.0 mAs (6mA × 1s): 4.8 mGy 4.1 mGy 61.7 @ 5.1 mAs (8mA × 0.64s): 3.9 mGy 58.3 @ 3.8 mAs (6 mA × 0.64 s): 3.3 mGy Table 3. Influence of the kV selection on the performance of the evaluated receptors. Bold marked digits indicate statistical significance (p < 0.05). INSIGHT kV 50 52 55 57 60 63 66 70 50 - 0.001 0.963 <0.001 <0.001 <0.001 <0.001 0.797 52 0.001 - <0.001 0.968 <0.001 <0.001 <0.001 <0.001 55 0.963 <0.001 - <0.001 <0.001 <0.001 <0.001 1.000 57 <0.001 0.968 <0.001 - <0.001 <0.001 <0.001 <0.001 60 <0.001 <0.001 <0.001 <0.001 - 0.001 0.011 <0.001 63 <0.001 <0.001 <0.001 <0.001 0.001 - 0.999 <0.001 66 <0.001 <0.001 <0.001 <0.001 0.011 0.999 - <0.001 70 0.797 <0.001 1.000 <0.001 <0.001 <0.001 <0.001 - RVG 6000 kV 50 52 55 57 60 63 66 70 50 - 0.079 <0.001 <0.001 <0.001 0.012 0.025 0.968 52 0.079 - 0.070 0.773 0.148 0.996 1.000 0.001 55 <0.001 0.070 - 0.900 1.000 0.413 0.149 <0.001 57 <0.001 0.773 0.900 - 0.977 0.993 0.917 <0.001 60 <0.001 0.148 1.000 0.977 - 0.618 0.284 <0.001 63 0.012 0.996 0.413 0.993 0.618 - 1.000 <0.001 66 0.025 1.000 0.149 0.917 0.284 1.000 - <0.001 70 0.968 0.001 <0.001 <0.001 <0.001 <0.001 <0.001 - VISTASCAN kV 50 52 55 57 60 63 66 70 50 - 0.031 1.000 0.006 0.007 0.889 <0.001 <0.001 52 0.031 - 0.089 <0.001 <0.001 0.488 <0.001 <0.001 55 1.000 0.089 - 0.001 0.001 0.985 <0.001 <0.001 57 0.006 <0.001 0.001 - 1.000 <0.001 <0.001 <0.001 60 0.007 <0.001 0.001 1.000 - <0.001 <0.001 <0.001 63 0.889 0.488 0.985 <0.001 <0.001 - <0.001 <0.001 66 <0.001 <0.001 <0.001 <0.001 <0.001 <0.001 - 0.041 70 <0.001 <0.001 <0.001 <0.001 <0.001 <0.001 0.041 - 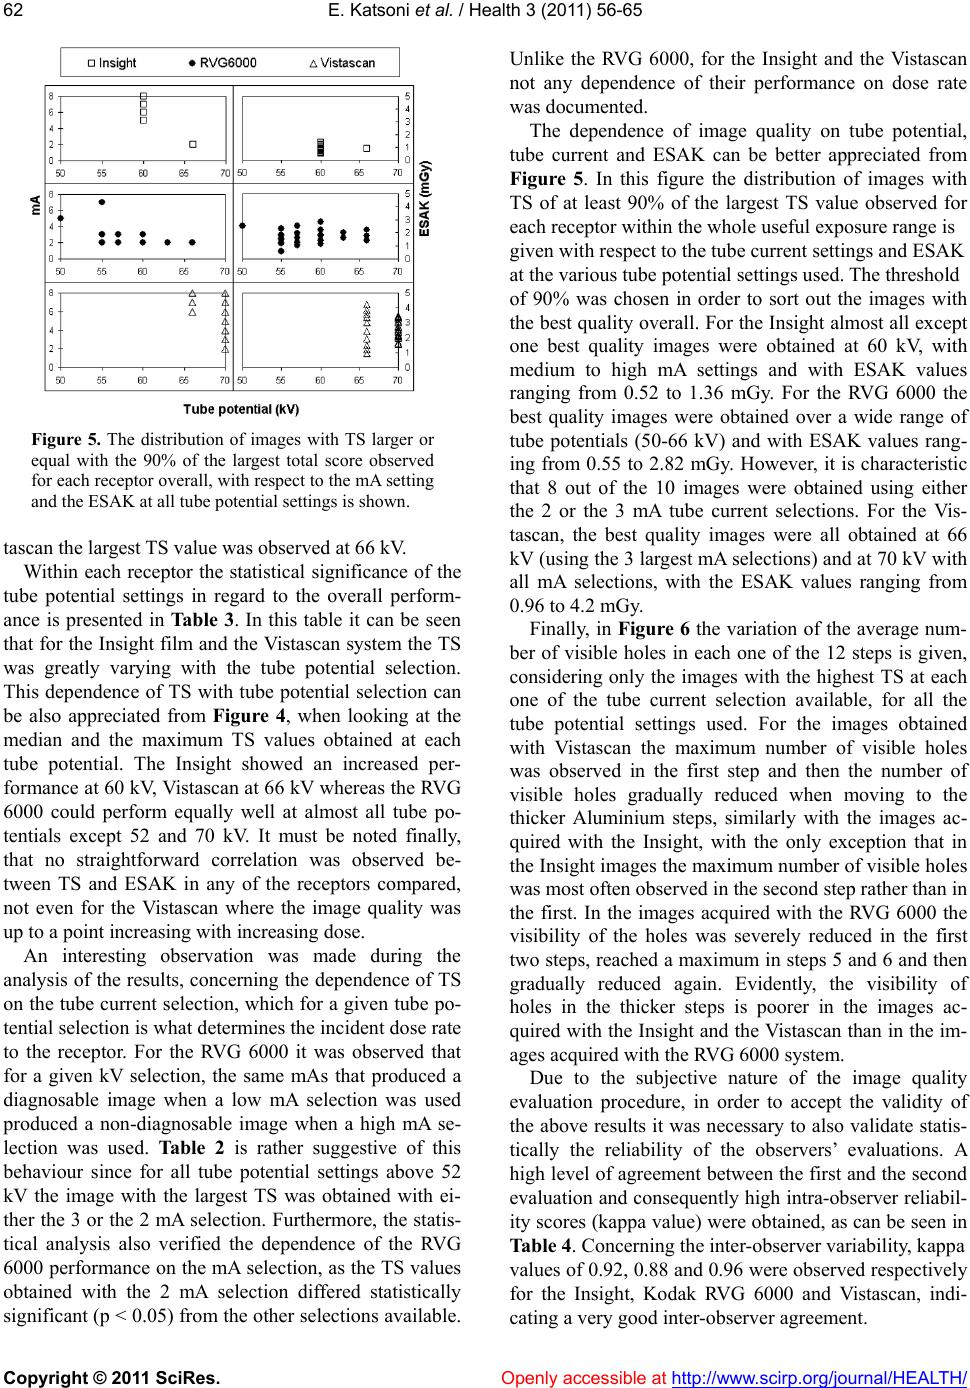 E. Katsoni et al. / Health 3 (2011) 56-65 Copyright © 2011 SciRes. Openly accessible at http://www.scirp.org/journal/HEALTH/ 62 Figure 5. The distribution of images with TS larger or equal with the 90% of the largest total score observed for each receptor overall, with respect to the mA setting and the ESAK at all tube potential settings is shown. tascan the largest TS value was observed at 66 kV. Within each receptor the statistical significance of the tube potential settings in regard to the overall perform- ance is presented in Tab le 3 . In this table it can be seen that for the Insight film and the Vistascan system the TS was greatly varying with the tube potential selection. This dependence of TS with tube potential selection can be also appreciated from Figure 4, when looking at the median and the maximum TS values obtained at each tube potential. The Insight showed an increased per- formance at 60 kV, Vistascan at 66 kV whereas the RVG 6000 could perform equally well at almost all tube po- tentials except 52 and 70 kV. It must be noted finally, that no straightforward correlation was observed be- tween TS and ESAK in any of the receptors compared, not even for the Vistascan where the image quality was up to a point increasing with increasing dose. An interesting observation was made during the analysis of the results, concerning the dependence of TS on the tube current selection, which for a given tube po- tential selection is what determines the incident dose rate to the receptor. For the RVG 6000 it was observed that for a given kV selection, the same mAs that produced a diagnosable image when a low mA selection was used produced a non-diagnosable image when a high mA se- lection was used. Table 2 is rather suggestive of this behaviour since for all tube potential settings above 52 kV the image with the largest TS was obtained with ei- ther the 3 or the 2 mA selection. Furthermore, the statis- tical analysis also verified the dependence of the RVG 6000 performance on the mA selection, as the TS values obtained with the 2 mA selection differed statistically significant (p < 0.05) from the other selections available. Unlike the RVG 6000, for the Insight and the Vistascan not any dependence of their performance on dose rate was documented. The dependence of image quality on tube potential, tube current and ESAK can be better appreciated from Figure 5. In this figure the distribution of images with TS of at least 90% of the largest TS value observed for each receptor within the whole useful exposure range is given with respect to the tube current settings and ESAK at the various tube potential settings used. The threshold of 90% was chosen in order to sort out the images with the best quality overall. For the Insight almost all except one best quality images were obtained at 60 kV, with medium to high mA settings and with ESAK values ranging from 0.52 to 1.36 mGy. For the RVG 6000 the best quality images were obtained over a wide range of tube potentials (50-66 kV) and with ESAK values rang- ing from 0.55 to 2.82 mGy. However, it is characteristic that 8 out of the 10 images were obtained using either the 2 or the 3 mA tube current selections. For the Vis- tascan, the best quality images were all obtained at 66 kV (using the 3 largest mA selections) and at 70 kV with all mA selections, with the ESAK values ranging from 0.96 to 4.2 mGy. Finally, in Figure 6 the variation of the average num- ber of visible holes in each one of the 12 steps is given, considering only the images with the highest TS at each one of the tube current selection available, for all the tube potential settings used. For the images obtained with Vistascan the maximum number of visible holes was observed in the first step and then the number of visible holes gradually reduced when moving to the thicker Aluminium steps, similarly with the images ac- quired with the Insight, with the only exception that in the Insight images the maximum number of visible holes was most often observed in the second step rather than in the first. In the images acquired with the RVG 6000 the visibility of the holes was severely reduced in the first two steps, reached a maximum in steps 5 and 6 and then gradually reduced again. Evidently, the visibility of holes in the thicker steps is poorer in the images ac- quired with the Insight and the Vistascan than in the im- ages acquired with the RVG 6000 system. Due to the subjective nature of the image quality evaluation procedure, in order to accept the validity of the above results it was necessary to also validate statis- tically the reliability of the observers’ evaluations. A high level of agreement between the first and the second evaluation and consequently high intra-observer reliabil- ity scores (kappa value) were obtained, as can be seen in Table 4. Concerning the inter-observer variability, kappa values of 0.92, 0.88 and 0.96 were observed respectively for the Insight, Kodak RVG 6000 and Vistascan, indi- ating a very good inter-observer agreement. c 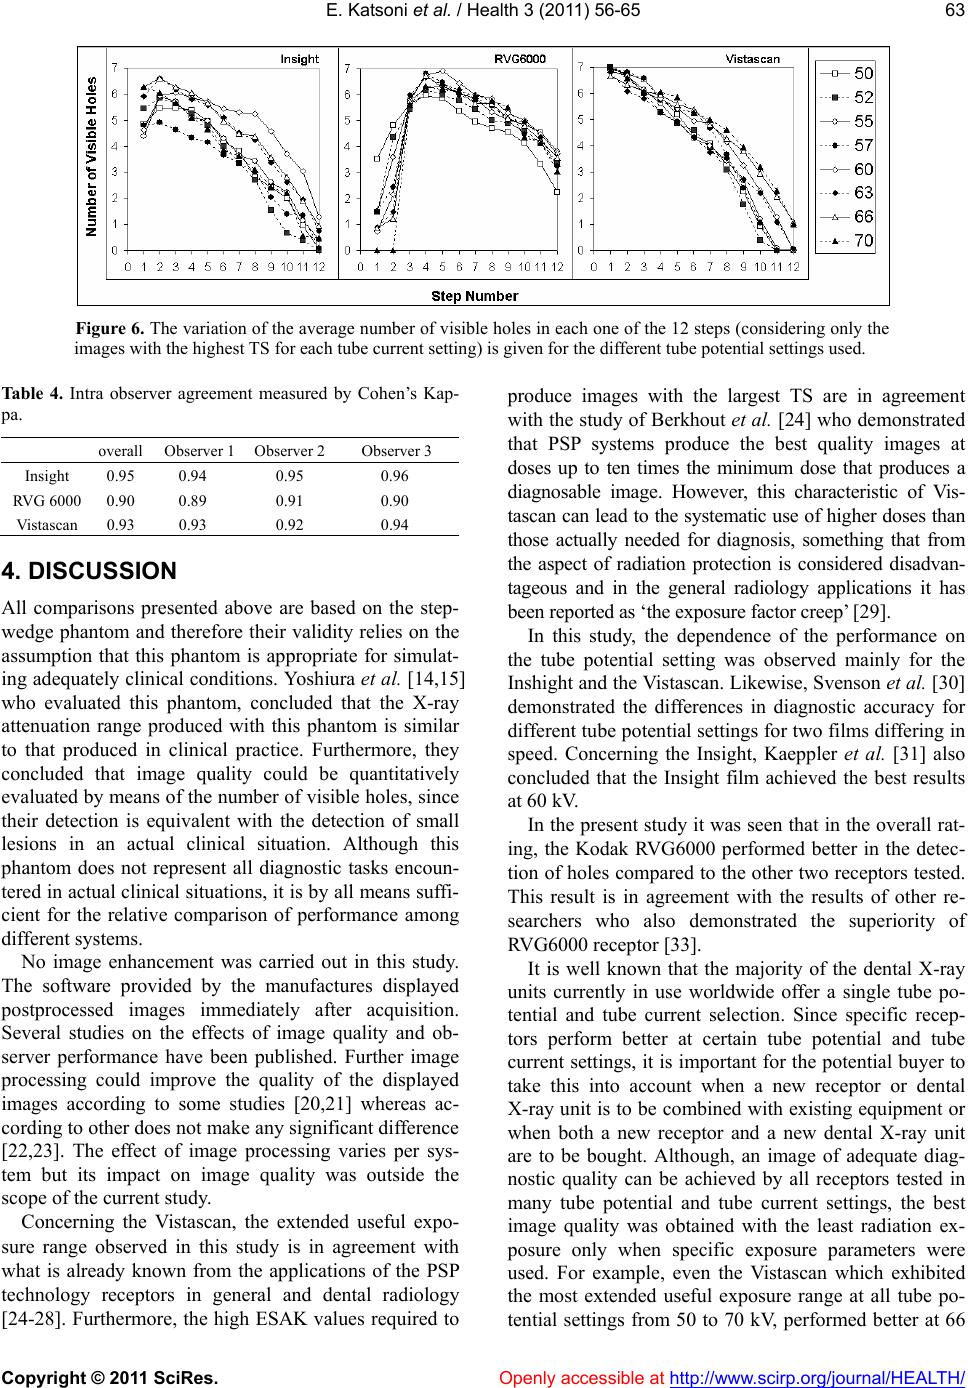 E. Katsoni et al. / Health 3 (2011) 56-65 Copyright © 2011 SciRes. Openly accessible at http://www.scirp.org/journal/HEALTH/ 63 Figure 6. The variation of the average number of visible holes in each one of the 12 steps (considering only the images with the highest TS for each tube current setting) is given for the different tube potential settings used. Table 4. Intra observer agreement measured by Cohen’s Kap- pa. overall Observer 1 Observer 2 Observer 3 Insight 0.95 0.94 0.95 0.96 RVG 6000 0.90 0.89 0.91 0.90 Vistascan 0.93 0.93 0.92 0.94 4. DISCUSSION All comparisons presented above are based on the step- wedge phantom and therefore their validity relies on the assumption that this phantom is appropriate for simulat- ing adequately clinical conditions. Yoshiura et al. [14,15] who evaluated this phantom, concluded that the X-ray attenuation range produced with this phantom is similar to that produced in clinical practice. Furthermore, they concluded that image quality could be quantitatively evaluated by means of the number of visible holes, since their detection is equivalent with the detection of small lesions in an actual clinical situation. Although this phantom does not represent all diagnostic tasks encoun- tered in actual clinical situations, it is by all means suffi- cient for the relative comparison of performance among different systems. No image enhancement was carried out in this study. The software provided by the manufactures displayed postprocessed images immediately after acquisition. Several studies on the effects of image quality and ob- server performance have been published. Further image processing could improve the quality of the displayed images according to some studies [20,21] whereas ac- cording to other does not make any significant difference [22,23]. The effect of image processing varies per sys- tem but its impact on image quality was outside the scope of the current study. Concerning the Vistascan, the extended useful expo- sure range observed in this study is in agreement with what is already known from the applications of the PSP technology receptors in general and dental radiology [24-28]. Furthermore, the high ESAK values required to produce images with the largest TS are in agreement with the study of Berkhout et al. [24] who demonstrated that PSP systems produce the best quality images at doses up to ten times the minimum dose that produces a diagnosable image. However, this characteristic of Vis- tascan can lead to the systematic use of higher doses than those actually needed for diagnosis, something that from the aspect of radiation protection is considered disadvan- tageous and in the general radiology applications it has been reported as ‘the exposure factor creep’ [29]. In this study, the dependence of the performance on the tube potential setting was observed mainly for the Inshight and the Vistascan. Likewise, Svenson et al. [30] demonstrated the differences in diagnostic accuracy for different tube potential settings for two films differing in speed. Concerning the Insight, Kaeppler et al. [31] also concluded that the Insight film achieved the best results at 60 kV. In the present study it was seen that in the overall rat- ing, the Kodak RVG6000 performed better in the detec- tion of holes compared to the other two receptors tested. This result is in agreement with the results of other re- searchers who also demonstrated the superiority of RVG6000 receptor [33]. It is well known that the majority of the dental X-ray units currently in use worldwide offer a single tube po- tential and tube current selection. Since specific recep- tors perform better at certain tube potential and tube current settings, it is important for the potential buyer to take this into account when a new receptor or dental X-ray unit is to be combined with existing equipment or when both a new receptor and a new dental X-ray unit are to be bought. Although, an image of adequate diag- nostic quality can be achieved by all receptors tested in many tube potential and tube current settings, the best image quality was obtained with the least radiation ex- posure only when specific exposure parameters were used. For example, even the Vistascan which exhibited the most extended useful exposure range at all tube po- tential settings from 50 to 70 kV, performed better at 66  E. Katsoni et al. / Health 3 (2011) 56-65 Copyright © 2011 SciRes. Openly accessible at http://www.scirp.org/journal/HEALTH/ 64 and at 70 kV. Therefore, Vistascan should be combined with a dental X-ray unit operating at 70 kV rather with one operating at 60 kV. Unlike to Vistascan, RVG 6000 and Inshight should be combined preferably with an X-ray unit operating at 60 kV. The ALARA statement endorses the principle that (in- dividual) doses should be as low as reasonably achiev- able. In this context European guidelines [30] recom- mended the establishment of diagnostic reference levels (DRLs). The European guidelines [30] recommended a DRL of 4 mGy absorbed dose in air measured at the end of the spacer cone for a standard maxillary molar projec- tion. In this study it was shown that for the specific phantom used, images of good diagnostic quality could be obtained with all receptors tested using just a fraction of the proposed DRL (see Figure 5). Similar surveys conducted in dental radiographic fa- cilities [34-36] over the last 10 years have demonstrated a trend for reduction of the entrance surface dose, with the use of faster films and digital receptors, as well as with modern x-ray units and rectangular collimation. Compared with the previous guidelines, the 2007 ICRP [37] recommendations for estimating risk associated with exposure to radiation, increased the emphasis given on the structures located in the oral region, par- ticularly the salivary glands. According to the revised recommendations for calculating effective dose, dental radiography involves 32% to 422% more risk than that previously thought [38]. Therefore, efforts should be made to reduce dose as much as possible but not at ex- pense of image quality and diagnostic accuracy. In this context it is important to determine for each receptor the exposure factors settings which can produce a good quality image with the least radiation dose possible. For this reason it would be ideal if receptor manufacturers could determine, using a phantom like the one used in this study, the optimal exposure factor settings and the respective TS and ESAK values for each receptor that becomes commercially available and include this in- formation in their technical data sheets. In this way the potential users would be able to determine if a given receptor is well suited for the dental X-ray unit that may already have or they intend to buy and furthermore they would be able to compare receptors using performance indices that relate to the clinical practice and therefore are easy to comprehend. The main results of this study in terms of the relative performance of the three receptors studied can be sum- marized as follows: Vistascan exhibited the most ex- tended useful exposure range, followed by RVG 6000 and Insight. RVG 6000 exhibited the largest TS values in all tube potential settings except 70 kV where the Vis- tascan performed better. Insight performed better than Vistascan only at 60 and 63 kV. Vistascan exhibited its largest TS values at 66 and 70 kV, Insight at 60 and 66 kV, whereas RVG exhibited large TS values at all tube potential settings, except than at 52 and 70 kV. For the Insight the largest TS values were obtained with the smallest ESAK values whereas with the Vistascan the largest TS were obtained with ESAK values that where the largest observed. RVG 6000 was the only system that exhibited a dependence on the dose rate since most of the large TS values were obtained at low mA selections. REFERENCES [1] United Nations Scientific Committee on the Effects of Atomic Radiation (2000) Sources and effect of ionizing radiation. UNSCEAR publications, Report, 1. [2] European Union. Council Directive 97/43 Euratom (1997) On health protection of individuals against the dangers of ionizing radiation in relation to medical exposures, and re- pealing directive 84/466 Euratom. Official Journal of the European Communities, 22, L180. [3] Kitagawa, H. and Farman, A.G. (2004) Effect of beam energy and filtration on the signal-to-noise ratio of the Dexis intraoral X-ray detector. Dentomaxillofacial Radi- ology, 33, 21-24. doi:10.1259/dmfr/26493631 [4] Wenzel, A. (2006) A review of dentists' use of digital radiography and caries diagnosis with digital systems. Dentomaxillofacial Radiology, 5, 307-314. doi:10.1259/dmfr/64693712 [5] Hellen-Halme, K. (2007) Quality aspects of digital radi- ography in general dental practice. Swedish Dental Journal. Supplement, 184, 9-60. [6] Hellen-Halme, K., Nilsson, M. and Petersson, A. (2007) Digital radiography in general dental practice: A field study. Dentomaxillofacial Radiology, 36, 249-255. doi:10.1259/dmfr/95125494 [7] Cowen, A.R., Kengyelics, S.M. and Davies, A.G. (2008) Solid-state, flat-panel, digital radiography detectors and their physical imaging characteristics. Clinical Radiology, 63, 487-498. doi:10.1016/j.crad.2007.10.014 [8] Hintze, H. (2006) Diagnostic accuracy of two software modalities for detection of caries lesions in digital radio- graphs from four dental systems. Dentomaxillofacial Ra- diology, 35, 78-82. doi:10.1259/dmfr/50356588 [9] Lanca, L., Silva, A., Alves, E., Serranheira, F. and Cor- reia, M. (2008) Evaluation of exposure parameters in plain radiography: A comparative study with European guidelines. Radiation Protection Dosimetry, 129, 316-320. doi:10.1093/rpd/ncn144 [10] Harada, T., Nishikawa, K., Shibuya, H., Hayakawa, Y. and Kuroyanagi, K. (1995) Sens-A-Ray characteristics with variation in beam quality. Oral Surgery, Oral Medi- cine, Oral Pathology, Oral Radiology & Endodontics, 80, 120-123. doi:10.1016/S1079-2104(95)80028-X [11] Goshima, T., Goshima, Y., Scarfe, W.C. and Farman, A.G. (1996) Sensitometric response of the Sens-A-Ray, a charge coupled imaging device, to changes in beam energy. Den- tomaxillofacial Rad io lo gy, 25, 17-18. [12] McDonnell, D. and Price, C. (1993) An evaluation of the Sens-A-Ray digital dental imaging system. Dentomaxil- lofacial Radiology, 22, 121-126. [13] Kitagawa, H. and Farman, A.G. (2004) Effect of beam energy and filtration on the signal to noise ratio of the  E. Katsoni et al. / Health 3 (2011) 56-65 Copyright © 2011 SciRes. http://www.scirp.org/journal/HEALTH/Openly accessible at 65 Dexis intraoral x-ray detector. Dentomaxillofacial Radi- ology, 33, 21-24. doi:10.1259/dmfr/26493631 [14] Yoshiura, K., Kawazu, T., Chikui, T., Tatsumi, M., To- kumori, K., Tanaka, T., et al. (1999) Assessment of image quality in dental radiography, part 1: Phantom validity. Oral Surgery, Oral Medicine, Oral Pathology, Oral Ra- diology, and Endodontics, 87, 115-122. doi:10.1016/S1079-2104(99)70304-5 [15] Yoshiura, K., Kawazu, T., Chikui, T., Tatsumi, M., To- kumori, K., Tanaka, T., et al. (1999) Assessment of image quality in dental radiography, part 2: Optimum exposure conditions for detection of small mass changes in 6 in- traoral radiography systems. Oral Surgery, Oral Medi- cine, Oral Pathology, Oral Radiology, and Endodontics, 87, 123-129. doi:10.1016/S1079-2104(99)70305-7 [16] Ang, D.B., Angelopoulos, C. and Katz, J.O. (2006) How does signal fade on photo-stimulable storage phosphor imaging plates when scanned with a delay and what is the effect on image quality? Oral Surgery, Oral Medicine, Oral Pathology, Oral Radiology, and Endodontics, 102, 673-679. doi:10.1016/j.tripleo.2005.11.002 [17] Ramamurthy, R., Canning, C.F., Scheetz, J.P. and Farman, A.G. (2004) Impact of ambient lighting intensity and du- ration on the signal-to-noise ratio of images from photo- stimulable phosphor plates processed using DenOptix and ScanX systems. Dentomaxillofacial Radiology, 33, 307-311. doi:10.1259/dmfr/91373164 [18] Parsons, D.M., Kim, Y. and Haynor, D.R. (1995) Quality control of cathode-ray tube monitors for medical imaging using a simple photometer. Journal of Digital Imaging, 8, 10-20. doi:10.1007/BF03168051 [19] Jervis, S.E. and Brettle, D.S. (2003) A practical approach to soft-copy display consistency for PC-based review workstations. The British Journal of Radiology, 76, 648-652. doi:10.1259/bjr/25693100 [20] Alpoz, E., Sogur, E. and Baksi Akdeniz, B.G. (2007) Perceptibility curve test for digital radiographs before and after application of various image processing algo- rithms. Dentomaxil lofacial Radiology, 36, 490-494. doi:10.1259/dmfr/20897311 [21] Li, G., Sanderink, G.C., Berkhout, W.E., Syriopoulos, K. and van der Stelt, P.F. (2007) Detection of proximal car- ies in vitro using standard and task-specific enhanced images from a storage phosphor plate system. Caries Research, 41, 231-234. doi:10.1159/000099324 [22] Koob, A., Sanden, E., Hassfeld, S., Staehle, H.J. and Eickholz, P. (2004) Effect of digital filtering on the measurement of the depth of proximal caries under dif- ferent exposure conditions. American Journal of Den- tistry, 17, 388-393. [23] Li, G., Engström, P.E. and Welander, U. (2007) Meas- urement accuracy of marginal bone level in digital radio- graphs with and without color coding. Acta Odontologica Scandinavica, 65, 254-258. doi:10.1080/00016350701452089 [24] Berkhout, W.E., Beuger, D.A., Sanderink, G.C. and van der Stelt, P.F. (2004) The exposure range of digital radio- graphic systems: Dose reduction or risk of overexposure? Dentomaxillofacial Radiology, 33, 1-5. doi:10.1259/dmfr/40677472 [25] Borg, E., and Grondahl, H.G. (1996) On the exposure range of different X-ray photon detectors in intra-oral ra- diography. A comparison of image quality in film, charge-coupled device and storage phosphor systems. Dentomaxillofacial Radiology, 25, 82-88. [26] Borg, E., Attaelmanan, A. and Grondahl, H.G. (2000) Image plate systems differ in physical performance. Oral Surgery, Oral Medicine, Oral Pathology, Oral Radiology, and Endodontics, 89, 118-124. doi:10.1016/S1079-2104(00)80026-8 [27] Farman, A.G. and Farman, T.T. (2005) A comparison of 18 different x-ray detectors currently used in dentistry. Oral Surgery, Oral Medicine, Oral Pathology, Oral Ra- diology, and Endodontics, 99, 485-489. doi:10.1016/j.tripleo.2004.04.002 [28] Kitagawa, H., Farman, A.G., Scheetz, J.P., Brown, W.P., Lewis, J., Benefiel, M., et al. (2000) Comparison of three intra-oral storage phosphor systems using subjective im- age quality. Dentomaxillofacial Radiology, 29, 272-276. doi:10.1038/sj.dmfr.4600532 [29] Willis, C.E. (2004) Strategies for dose reduction in ordinary radiographic examinations using CR and DR. Pediat ric Ra- diolog y, 34, 196-200. doi:10.1007/s00247-004-1269-6 [30] Svenson, B., Grondahl, H.G., Petersson, A. and Olving, A. (1985) Accuracy of radiographic caries diagnosis at dif- ferent kilovoltages and two film speeds. Swedish Dental Journal, 9, 37-43. [31] Kaeppler, G., Dietz, K. and Reinert, S. (2007) Influence of tube potential setting and dose on the visibility of le- sions in intraoral radiography. Dentomaxillofacial Radi- ology, 36, 75-79. doi:10.1259/dmfr/75743437 [32] Ramamurthy, R., Scheetz, J.P., Clark, S.J. and Farman, A.G. (2006) Effects of imaging system and exposure on accurate detection of the second mesio-buccal canal in maxillary molar teeth. Oral Surgery, Oral Medicine, Oral Pathology, Oral Radiology, and Endodontics, 102, 796-802. doi:10.1016/j.tripleo.2006.02.009 [33] Radiation Protection (2004) European guidelines on ra- diation protection in dental radiology. The safe use of ra- diographs in dental practice. Issue No. 136. [34] Yakoumakis, E.N., Tierris, C.E., Stefanou, E.P., Pha- nourakis, I.G. and Proukakis, C.C. (2001) Image quality assessment and radiation doses in intraoral radiography. Oral Surgery, Oral Medicine, Oral Pathology, Oral Ra- diology, and Endodontics, 91, 362-368. doi:10.1067/moe.2001.111940 [35] Hatziioannou, K., Psarouli, E., Papanastassiou, E., Bous- bouras, P., Kodona, H., Kimoundri, O., et al. (2005) Quality control and diagnostic reference levels in in- traoral dental radiographic facilities. Dentomaxillofacial Radiology, 34, 304-307. doi:10.1259/dmfr/38802780 [36] Gonzalez, L. and Moro, J. (2007) Patient radiation dose management in dental facilities according to the X-ray focal distance and the image receptor type. Dentomaxil- lofacial Radiology, 36, 282-284. [37] Valentin, J. (2007) The 2007 recommendations of the international commission on radiological protection. El- sevier, Oxford. doi:10.1259/dmfr/67494525 [38] Ludlow, J.B., Davies-Ludlow, L.E. and White, S.C. (2008) Patient risk related to common dental radio- graphic examinations: The impact of 2007 International Commission on Radiological Protection recommenda- tions regarding dose calculation. Journal of American Dental Association, 139, 1237-1243. |