

Paper Menu >>
Journal Menu >>
 Energy and Power E ngineering, 2013, 5, 230-236 doi:10.4236/epe.2013.54B045 Published Online July 2013 (http://www.scirp .o rg/journal/epe) Copyright © 2013 SciRes. EPE Comprehensive Modulation and Classification of Faults and Analysis Their Effect in DC Side of Photovoltaic System Mehrdad Davarifar, Abdelhamid Rabhi, Ahmed El Hajjaji Universi ty of Picardie “Jules Verne”, Laboratory MIS (Modeling, Information & Systems), 33Rue Saint Leu, Amiens, 80039, France Email: Davar [email protected] Received April, 2013 ABSTRACT The first step in automatic supervision, condition monitoring and fault detection of photovoltaic system is recognition, exploratio n and classification of all possible faults that maybe happen in the system. This pap er aims to perceive, classi- fied, simulate a nd discus all electrical faul ts in DC side of photovoltaic s ystem, regarding electrical voltage a nd current inspections. For that, simplified hybrid model of photovoltaic panel in MATLAB environment is used. Investigation and classification of each type of faults is down and the effects of the faults are illustrated in this paper. Flash test are applied to improved electrical model. Current-Voltage curves signature are interpreted and investigated in simulation environment. Keywords: Photovoltaic Systems; Modeling; Electrical Fault; Fault Detection 1. Introduction Nowadays photovoltaic (PV) panels are used in several sector of industry. They could be found, on building roofs, illuminated highway signs [1], etc. where rural electrification is embryonic [2], even in infrastructure industries such as oil industry [3], huge power plant in desert and different aspects of life. PV markets are growing fast because of their advantages such as: pollu- tion free, safety, noiseless, easy installation, and short construction period. Also tariff of the solar electricity is enormous compared to the traditional power especially in peak load time [4]. Enquiries for lower cost and high- efficiency-devices motivate the researchers to increase the reliabilit y o f P V systems. On the other hand, this wide diffusion has of the dis- tributed generation (DG) such as photovoltaic panels have not been supported by monitoring, fault detection and diagnosis equipment. In fact, monitoring systems represent an additional cost and it weighs appreciably on Residential Photovol- taic System (RPS). For this reason, small PV plants are not regularly checked and partial system faults can occur, leading to energy losses that are dificult to be observed and causing financial losses [5-7]. Without proper fault detection, non-cleared faults in PV arrays not only cause po wer losses, but also might lead to safety issues and fire hazards [8]. Photovoltaic system are subjected to different sort of failures, thus befo re st arti n g sup erviso r y syst em a nd fa ult diagnosis methods, it is necessary to identify what kind of failures can be found in the real system. The first step in this challenge is to cognition and classification all possible faults, in the first. On the other hand, the fault detection methods for the PV array are varied and are classified in the Table 1. Amon g these metho ds suc h as: vi sual, the rmal, a nd elec- trical, the visual and the thermal methods need to look down the PV array and observe the color changes of the modules or observe the thermal properties such as hot spots. These methods need thermal cameras or other equipment in front of the array, while the electrical me- thod s need o nly t he outp ut ter minal of the array to meas- ure the volt age, c urre nt, and signa l da ta such as te mpera- ture and irrad ia tion. This characteristic of electrical methods is important for the fault diagnosis technologies to install them into the power conditioners or into the system inspection equipment. Then, electrical methods are promising for PV system fault diagnosis [10, 11]. This paper aims to perceive, simulate and discuss about electrical fault in DC side of photovoltaic system and has been focused on electrical voltage and current inspections. For that sim- plified hybrid model of PV panel in MATLAB environ- ment is proposed in third part [12-15]. 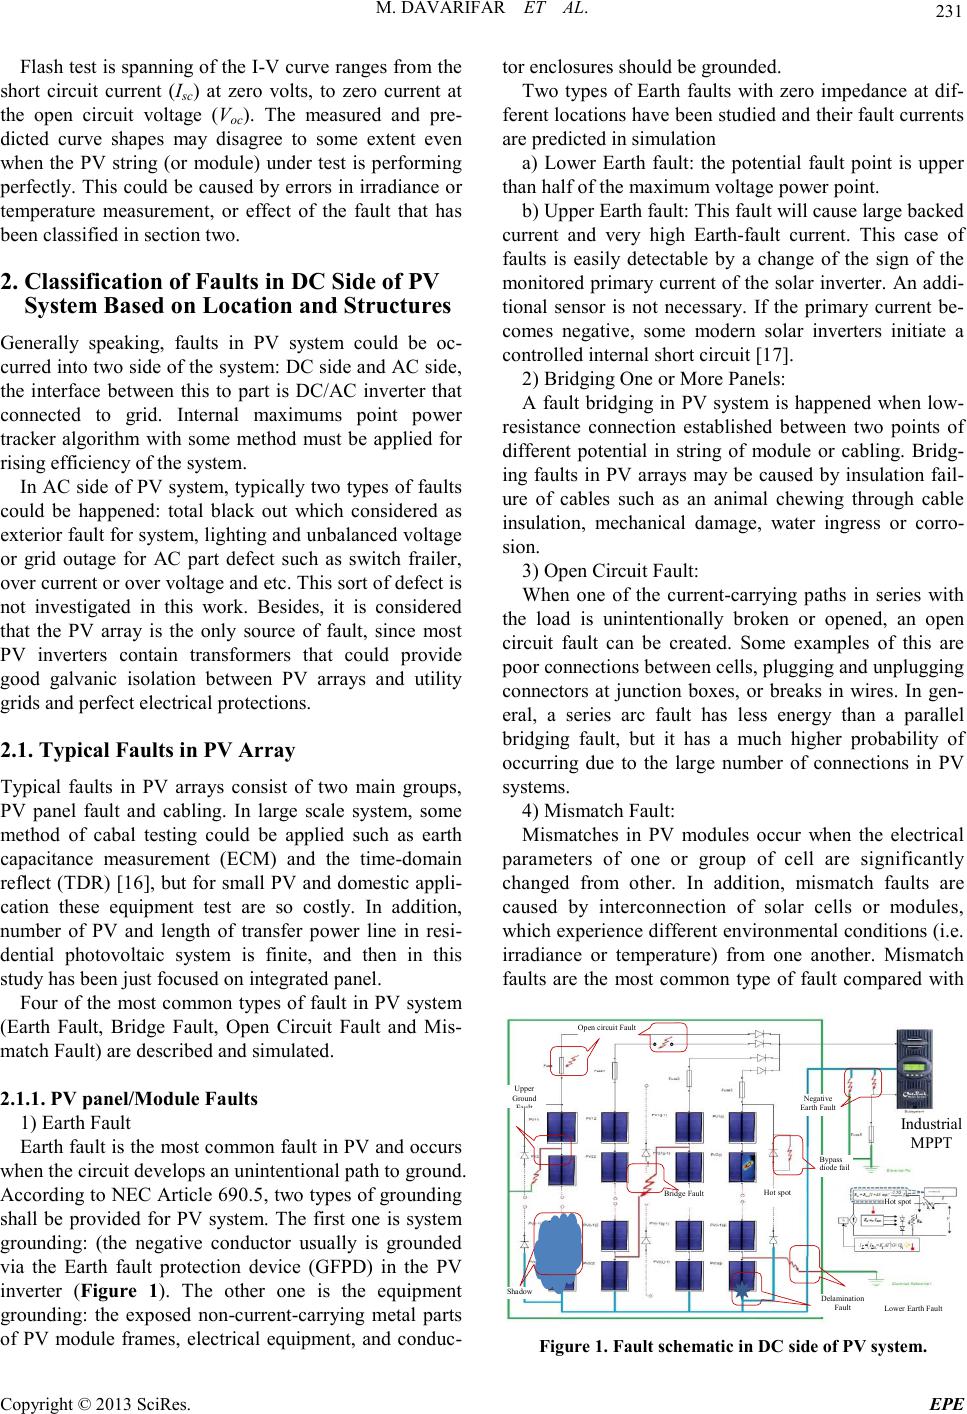 M. DAVARIF AR ET AL. Copyright © 2013 SciRes. EPE 231 Flas h test is sp anni ng of the I-V curve range s fro m the short circuit current (Isc) at zero volts, to zero current at the open circuit voltage (Voc). The measured and pre- dicted curve shapes may disagree to some extent even when the PV string (or module) under test is performing perfectly. This could be cause d by errors in irradiance or temperature measurement, or effect of the fault that has been classified in section two. 2. Classification of Faults in DC Side of PV System Based on Location and Structures Generally speaking, faults in PV system could be oc- curred into t wo side o f the s ystem: DC sid e and AC side, the interface between this to part is DC/AC inverter that connected to grid. Internal maximums point power tracker algorithm with some method must be applied for rising efficiency of the system. In AC side of PV system, typically two types of faults could be happened: total black out which considered as exter ior faul t for s yste m, l ight ing a nd u nbal anced volt age or grid outage for AC part defect such as switch frailer, over current or over voltage and etc. This sort of defect is not investigated in this work. Besides, it is considered that the PV array is the only source of fault, since most PV inverters contain transformers that could provide good galvanic isolation between PV arrays and utility grids and perfect electrical protections. 2.1. Typical Faults in PV Array Typical faults in PV arrays consist of two main groups, PV panel fault and cabling. In large scale system, some method of cabal testing could be applied such as earth capacitance measurement (ECM) and the time-domain reflect (TDR) [16], but for small PV and domestic appli- cation these equipment test are so costly. In addition, number of PV and length of transfer power line in resi- dential photovoltaic system is finite, and then in this study has been just focused on integrated panel. Four of the most co mmon types of fault in PV system (Earth Fault, Bridge Fault, Open Circuit Fault and Mis- match Fault) are described and simulated. 2.1.1. PV panel/Module Faults 1) Earth Fault Earth fault is the most co mmon fault in PV and occurs when the circuit develops an unintentional path to ground. According to NEC Article 690.5, two types of grounding shall be provided for PV system. The first one is system grounding: (the negative conductor usually is grounded via the Earth fault protection device (GFPD) in the PV inverter (Figure 1). The other one is the equipment grounding: the exposed non-current-carrying metal parts of PV module frames, electrical equipment, and conduc- tor enclosures should be grounded. Two types of Earth faults with zero impedance at dif- ferent locations have been studied a nd their fault currents are predicted in simulation a) Lower Earth fault: the potential fault point is upper than half o f the maximum voltage po wer point . b) Upper Earth fault: This fault will cause large backed current and very high Earth-fault current. This case of faults is easily detectable by a change of the sign of the monitored pr imary current o f the solar inverter. An add i- tional sensor is not necessary. If the primary current be- comes negative, some modern solar inverters initiate a controlled internal short circuit [17]. 2) Bridging One or More Panels: A fault bridging in PV system is happened when low- resistance connection established between two points of different potential in string of module or cabling. Bridg- ing faults in PV arra ys may be caused by insulation fail- ure of cables such as an animal chewing through cable insulation, mechanical damage, water ingress or corro- sion. 3) Open Circuit Fa ult: When one of the current-carrying paths in series with the load is unintentionally broken or opened, an open circuit fault can be created. Some examples of this are poor connections between cells, plugging and unplugging connectors at junction boxes, or breaks in wires. In gen- eral, a series arc fault has less energy than a parallel bridging fault, but it has a much higher probability of occurring due to the large number of connections in PV systems. 4) Mismatch Fault: Mismatches in PV modules occur when the electrical parameters of one or group of cell are significantly changed from other. In addition, mismatch faults are caused by interconnection of solar cells or modules, which experience different environmental conditions (i.e. irradiance or temperature) from one another. Mismatch faults are the most common type of fault compared with Upper Ground Fault Open ci rcuit Fault Lower Earth Fault Bridge Fault Hot sp ot Negative Earth Fault Shadow Bypass diod e fa i l Delamination Fault Hot sp ot Industrial MPPT Figure 1. F ault schematic in DC side of PV system.  M. DAVARIF AR ET AL. Copyright © 2013 SciRes. EPE 232 Earth fault and bridging faults, among PV arrays. Mis- match faults may lead to irreversible damage on PV modules and large power loss. However, they are diffi- cult to detect using conventional protection devices, since the y generall y do not l ead to la rge fault currents . These faults can be categorized into two groups, per- manent and temporary. Their causes are listed below: a) Temporary Mismatches: are divided in two groups: • Partial shading: Shading effect occurs when a part of the panels array are shaded which can be caused by a number of different reasons, like shade from the building itself, light posts, chimneys, trees, clouds, dirt, snow and other light- blocking obstacles [18]. Non- uniform temperature: Snow covering, b) Permanent Mismatches: • Hotspot: Hot spot heating occurs when a module’s operating current exceeds the reduced short circuit current of a shadowed or faulty cell or group of cells within the mod- ule [19]. To create a Hot spot fault, a variable resistor in series with the Rsn of each defective cell could be added in Simulink. Value of this resistor is considered approx- imately one unt i l five ohm. • Soldering: this defective appears in resistive solder bond between cell and contacted ribbons. • between cells and contact ribbons, Degradation: o Discoloration; o Delaminatio n; o Transparent layer crack. Typical Chart of fault in (Figure 2) is illustrated: 2.1.2. Cabling Fault Such as PV panel three principal type of fault is occur in power line carrier and cabling system. 1) Bridging Fault: A very typical location of a possible bridging fault could be an aged connection box at the back side of a solar panel or in the corner and bend aria of cable [20]. 2) Open-Circuit fault; 3) Earth Fault: a) Upper Earth Fault b) Lower Earth Fault These common faults occur between panels and ground. Earth fault res ults in lo wered output voltage and power, and can be fatal if the leakage currents are run- ning thr o ug h a pe r so n. T he se fa u lts have almost t he same effect on PV array and PV panel. Faults DC side PV Panel fau lt Photovoltaic array Earth fau lts Upper Ground fau lts Lower Earth faults Bridging faults Open Circuit fau lts Mismatch faults Temporary Mismatches Partial Shading Shading Bird Droppings or Tress Leav es Snow covering Non-uniform temperature Snow covering Permanent Mismatches Soldering Hot Spot Degradation fau lts Discoloration Delamination Crack Cabling Bridging faults Open Circuit fau lts Earth fault s Upper Earth fau lts Lower Earth fau lts MPPT AC si de (grid) Grid outage Lighting Inv erter Total black out Not interested in this work Interested in this work Figure 2. Classification of Faults i n DC Si de o f PV system bas ed on locat ion and structures.  M. DAVARIF AR ET AL. Copyright © 2013 SciRes. EPE 233 3. Simulation and Experimental Results 3.1. MATLA B/ Psp ice Cir cuit Ba sed Mode l of PV Panels for Fault Diagnosis Application Photovoltaic system are subject to different sort of fail- ures. Therefore, before stating health monitoring and fault diagnosis in PV system, finding general and real time model of PV, with good and fast performance is inevitable. This general and universal model must have following specification: • Applicable for almost all co mmercial PV panel; • Capable to work in real-time for fault diagnostic delibera tion and monitoring system; • Capable to simulate partial shading conditions (PSC) effect and degradation to investigate pa- nels fault; • Possible to connect easily and interfaced to the electronic devices and power converters model in MATLAB Simulink for maximum power point tracking and fau lt diagnosis st ud ie s. Hybrid model is used and adopted according to the PV datasheet value for better I-V curve estimation. In fact, equivalent circuit of a practical PV device includes the cells connected in series and parallel. With this modification it is possible to change input data (irradiating and temperature) for each cell and si- mulate it individually. Of complying with superposition rules the simulation result of each cell combine together to form I-V characteristic of PV module as the output. In our model (Figure 3): • Dependent current source to irradiation and te mper- ature for each cell are considered separately, in or- der to convert solar energy to electrical form; • Adopted diode has been superseded instead of nor- mal silicon dio de; • Variable resistor is used to appearance effect of solar irradiation (especially for Amorphous tech- nology); • Adopted diode connected in series form to demon- strate number of P-N junction and became justifica- tion for high-level ideality factors a. Using Spice diode block, it is possible to consider en- vironment temperature effect in the simulation. In fact, the diode satura tion current Isat and b and -gap energy Eg is corrected regarding datasheet value, and then parameters are manipulated in diode block. This procedure could be extended for PV arrays, output of each PV panel/module connected together according array configuration to for m total I-V curve. 3.2. Simulation of Fault in Real Time The model presented in this work is implemented and tested on the a-Si:H triple layer amorphous. The panels are installed in MIS laboratory energy renewable plat- form in university of Picardie Jules Verne (Fiugre 4). Solar irradiation data is captured by pyrometer CS300. This pyrometer connects directly to our data loggers. PV temperature is sensed with a type K thermocouple (Silicone rubber patch with self-adhesive aluminum foil backing) that mounted on panels, also RMS value of voltage and current are captured by national instrument data acquisition device (NI DAQ 6212 USB). IL/n IL/np Voc Rs Voc/ns Voc Voc/ns Rshnp/nsl Rsnp/nsl Rshnp/nsl Rsnp/nsl Rshnp/nsl Rsnp/nsl Rshnp/nsl Rsnp/nsl IL Rs V I I L I L R s Rsh Eg, an, Isatn Amorphou Cell model Adopted diode ( ) 3 ITa scTmax n a .k.T .T IT n max max satn n E= -Ln. gVq.T- T n max ocTmax exp- 1 a.VTm I+K . T scn i I= sat V+K. T ocn v exp- 1 a.Vtn ∆ ∆ Figure 3. MATLAB/Pspice circuit based model of PV pa- nels for fault diagnosis application. Figure 4. Evaluated Simulink model in MIS laboratory Energy ren ewable platform. 05 10 15 20 25 -5 0 5 10 15 20 25 30 35 40 45 Time (h) Po wer ( w) -- Power of model -The real power Figure 5. Comparison between the actual and the power provided by the model.  M. DAVARIF AR ET AL. Copyright © 2013 SciRes. EPE 234 Temperature and irradiation captured as input data. The voltage and current predicted by simulation in real time. According to this figure, it appeared that there was a good agreement between the real data given by mea- surement sensors and the results obtained by simulation. This Comparison is fundamental task to Feasibility of error by considering power lowering. 4. Flash Test Result of Faults in DC Side of PV System (I-V Characteristic) Flash test is a fundamental method for measuring the performance I-V characteristics o f photovolta ic panels b y spanning the PV voltage from zero to open circuit in short time. The output of measuring is a set of data, which are determined by output peak power, open circuit voltage, short circuit current, operating voltage, current, or power and efficienc y [21]. Flash test has been applied to PV models for different type of fault scenario. Results of fore principal of fault, Open circuit (Figure 6), Mismatched fault (Figure 7), Bridging Fau lt (Figure 8) and Erath Fault (Figure 9) are illustrated. 00.5 11.5 22.5 33.5 0 10 20 30 40 50 Voltage Power & Curr ent I-V Normal P-V Normal I- V Open circ iut P-V Open c ircuit Figure 6. Open circuit fault affect ed on ISC. 00.5 11.5 22.533.5 0 10 20 30 40 50 Voltage Power & Curr ent I-V M ismat ched P -V M i sm ached I-V Normal P -V Norm a l P -V Hot Spot I-V Hot S pot Figure 1. I-V curve ha s notc hes or s teps in M is matc hed an d Hot spot fault. 00.5 11.5 22.5 33. 5 0 10 20 30 40 50 Voltage P ower & Current I-V Normal I-V Normal I- V Bridging Fault P-V Bridging Fault Figure 2. Bridging Fault Loses power and is effe cted on Voc. 00.51 1.52 2.53 3.5 0 10 20 30 40 50 V oltage P ower & Current I-V Normal P-V Normal I-V Lower Earth Fault P- V Lower Eart h F ault I- V Upper Earth Fault P- V Upper Earth Fault Figure 3. Earth Fault affected Voc, Upper Earth fault is more effective in out-put characteristic. For simulation initialize three strings in parallel and each string is included five cells or panel. (It is men- tioned before that it is possible to consider PV module instead of cell, because the result is consequence of su- perposition rules). Inference and investigated I-V and P-V Curve are in- terprete d at the end part o f this study: • The I-V curve shows higher or lower current than predicted, which is caused by following faults: - PV array is soiled (especially uniformly). - PV modules are degraded. • The slope of the I-V curve near Isc does not match the prediction, if: - Shunt paths exist in PV cells (H ot Spot) - Shunt paths exist in the PV cell interc onnects - Module Isc mismatch • The slope of the I-V curve near Voc does not match the prediction, in cases below: - PV wiring has excess resistance or is insufficiently sized - Electrical interconnections in the arra y are resistive - Series resistance of PV modules has increased • The I-V curve has notc hes or steps, if:  M. DAVARIF AR ET AL. Copyright © 2013 SciRes. EPE 235 - Array is partially shaded - PV cells are damaged - Bypass diode is short-circuited • The I-V curve has a higher or lower Voc value than predicte d in the following cases: - PV cell temperature is different than the modeled temperature - One or more cells or modules are completely shaded - One or more bypass diodes is conducting or s horte d - One or more PV modules were not included in the circuit as-built 5. Conclusions A comprehensive classification of faults in DC Side of PV system based on location and structures is proposed for the first time. Flash test applied to validated model and deferent type of faults are simulated. Inference and investigated I-V and P-V curves are interpreted. The future research plans to address some intelligent algorithm, which is used for fault detection and localiza- tion i n P V sys tem r egar din g the inference of I-V and P -V curves characteristics. REFERENCES [1] C. J. Huang, L. Y. Kang, Y. C. Jen, and C. S. Jen, “De- sign and Implementation of a Photovoltaic High-Intensity-Discharge Street Lighting System,” Power Electronics, IEEE Transactions, Vol. 26, No. 12, 2011, pp. 3464 -3471. doi:10.1109/TPEL.2011.2116806 [2] M. Kolhe, “Techno-Economic Optimum Sizing of a Stand-Alone Solar Photovoltaic System,” Energy Con- version, IEEE Transactions on, Vol. 24, No. 2, 2009, pp. 511-519. doi:10.1109/TEC.2008.2001455 [3] N. Groom, “Analysis: Oil companies go solar to tap hard-to -get supplies,” Ed: USA Edition; Reuters, 2011. [4] D. Solyali and M. A. Redfern, “Why Should Cyprus Ex- ploit the Solar Power to Match its Peak Demand?” Uni- versities' Power Engineering Conference (UPEC), Pro- ceedings of 2011 46th International, 2011, pp. 1-6. [5] P. D ucange, M. Fazzolari , B. Lazzerini and F. Marcelloni, “An Intelligent System for Detecting Faults in Photovol- taic Fields,” In Intelligent Systems Design and Applica- tions (ISDA), 2011 11th International Conference on, 2011, pp . 1341-1346. [6] S. Sho jaee, M . Davari far, M. H. Varahram and A. Davari, “Implementation of Remote Meter Reading Via Power Line,” In RCEE 2006,Gonabad Azad University, Iran, 2006. [7] M. Davarifar, Z. Daneshi-Far and H. Fayyaz, “I mpl e- mentation of Automate Remote Meter Reading (AMR) via BPL in Kish Island,” In International Power System Conference (PSC), 2009, Tehran, Iran., 2009. [8] Y. Zhao, B. Lehman, J. F. DePalma, J. Mosesian and R. Lyons, “Fault Evolution in Photovoltaic Array during night-to-day Transition,” In Control and Modeling for Power Electronics (COMPEL), 2010 IEEE 12th Work- shop on, 2010, pp. 1-6. [9] T. Takashima, J. Yamaguchi and M. Ishida, “Disconnec- tion Detection using Earth Capacitance Measurement in Photovoltaic Module String,” Progress in Photovoltaics: Research and Applications, Vol. 16, No. 8, 2008, pp. 669-677. doi:10.1002/pip.860 [10] S. Buddha, H. Braun, V. Krishnan, C. Tepedelenlioglu, A. Spanias, T. Yeider, et al., “Signal processing for photo- voltaic applications,” in Emerging Signal Processing Ap- plications (ESPA), 2012 IEEE International Conference on, 2012, pp. 115-118. [11] Z. Ye, Y. Ling, B. Lehman, J. de Palma, J. Mosesian and R. Lyons, “Decisi on tree-b ased fault d etection an d classi- fication in solar photovoltaic arrays,” in Applied Power Electronics Conference and Exposition (APEC), 2012 Twent y-Seventh An nu al IEE E , 2012, pp. 93-99. [12] M. Davarifar, A. Rab hi and A.Hajjaji, “Circuit Model Of PEM Fuel Cell For Energy Conversion Uses Renewable Energy System In Matlab,” in The Internat ional Renewa- ble Energy Congress (IREC), Hammamet, Tunisia, De- cember 2011. [13] M. Davarifar, A. Rabhi and A. E. Hajjaji, "Modeling of Solar Photovoltaic Panels in Matlab/Simscape Environ- ment," in International Conference on Renewable Energy: Generation and Applications” ICREGA’12, Al Ain, Unite d Ar ab E m ir at e s , March 2012. [14] M. Davarifar, A. Rabhi, A. E. Hajjaji and J. Bosche, “Real Time Modeling of Triple layers Amorphous Pho- tovoltaic Panels,” in 2d International Conference on Sys- tems and Control (ICSC12),Marrakesh, Morocco , April 2012. [15] M. Davarifar, A. Rabhi, A. Hajjaji, J. Bosche and X. Pierre, “Improved Real Time Amorphous PV Model for Fault Diagnostic Usage,” in Sustainability in Energy and Buildings, Vol. 22, A. Hakansson, M. Höjer, R. J. How- lett, and L. C. Jain, Eds., ed: Springer Berlin Heidelberg, 2013, pp . 179-188. [16] T. Takashima, J. Yamaguchi, K. Otani, T. Oozeki, K. Kato, and M. Ishida, “Experimental studies of fault loca- tion in PV module strings,” Solar Energy Materials and Solar Cells, Vol. 93, No. 6-7, 2009, pp. 1079-1082. doi:org/10.1016/j.solmat.2008.11.060 [17] C. Strobl and P. Meckler, “Arc Faults in Photovoltaic Systems,” in Electrical Contacts (HOLM), 2010 Pro- ceedings of the 56th IEEE Holm Conference on, 20 10, pp. 1-7. [18] F. Ancu ta and C. Cep isca, “Fault analysis possibilities for PV panels,” in Energetics (IYCE), Proceedings of the 2011 3rd International Youth Conference on, 2011, pp. 1-5. [19] A. D. S. Wendlandt, T. Buseth, S. Krauter, P. Grunow, “Hot Spot Risk Analysis on Silicon Cell Modules,” in 25th European Photovoltaic Solar Energy Conference and Exhibition / 5th World Conference on Photovoltaic Energ y Conversio, Valencia, Spain, 2010, pp. 4002-4006. [20] H. Haeberlin and M. Real, “Arc Detector for Remote Detection of Dangerous Arcs on the DC Side of PV  M. DAVARIF AR ET AL. Copyright © 2013 SciRes. EPE 236 Plants,” in 22nd EU PV Conf., Milano, Italy, 2007. [21] P. Mastny, L. Radil and Z. Mastna, “Possibilities of PV Panels Defects Identification and Determination of its Effect on the Economy of Photovoltaic Power Plants Op- eration,” in Communication and Management in Tech- nological Innovation and Academic Globalization, 2011, pp. 233-238. |