

Paper Menu >>
Journal Menu >>
 Energy and Power Engineering, 2013, 5, 182-188 doi:10.4236/epe.2013.54B035 Published Online July 2013 (http://www.scirp.org/journal/epe) Cost-effective Energy Monitoring of Domestic Off-grid PV Systems Arthur James Swart, Ruaan Schoeman, Christo Pienaar Institute of Applied Electronics, Vaal University of Technology, Private Bag, Vanderbijlpark, South Africa Email: [email protected] Received September, 2012 ABSTRACT Domestic off-grid renewable energy systems have become common place in many areas of the world, as humanity seeks to keep abreast with global technological changes and advancements. This paper aims to present a cost-effective energy monitoring system which may be used to analyze and evaluate the operation of a domestic off-grid PV system. Parameters which are monitored include the output voltage and current from a 55 W polycrystalline PV panel. The output voltage and current from a power regulation circuit (which could be a DC-DC converter, solar charger or MPPT) is also monitored with this singular system which incorporates a data logging interface circuit, a data logger and a per- sonal computer. Keywords: Off-grid PV System; Data Logging; Current Sensor; Differential Amplifier 1. Introduction “Most people spend more time and energy going around problems than in trying to solve them” [1]. These words, by Henry Ford, well illustrate the inefficiency of trying to solve existing problems by finding ways to circumvent them. A current major environmental challenge which exists is climate change [2], a challenge that cannot be circumvented as a possible solution. The challenge needs to be tackled head-on. Fortunately, many nations have started to enforce policies and regulations surrounding the reduction of the global carbon footprint, which could, in the long run, mitigate climate change. For example, in December 1997 the Kyoto Protocol was developed in which 160 nations signed an agreement in order to cut or reduce carbon emissions through carbon taxes and the Clean Development Mechanism (CDM) [3]. Many governments are also investing huge sums of money into searching for alternative energy sources as a means to replace current fossil fuel and nuclear energy power plants. The worldwide venture investment in “green technology” companies totalled US$ 2.57 billion for the first quarter of 2011[4]. Subsequently some suggest that renewable energy could supply as much as 77 percent of the world’s energy demand by 2050, which would equate to a reduction of one third of greenhouse gas emissions compared to busi- ness-as usual projections [5]. It is predicted that solar power will become the dominant energy source in the future (see Figure 1). A branch of solar energy research that has received worldwide attention is the photovoltaic (PV) renaissance [6]. Solar power generation through PV arrays (strings), is arguably the most eco-friendly, emission free and sus- tainable source of energy known to man [7]. Many com- mercial systems for domestic off-grid applications cur- rently exist which could be purchased and installed within a matter of hours. However, these systems rarely incor- porate some or other type of monitoring, whereby the user could analyze and evaluate not only the energy consumption, but also the energy supplied [8]. Figure 1. Energy forecast according to the Scientific Advi- sory Board [9]. Copyright © 2013 SciRes. EPE 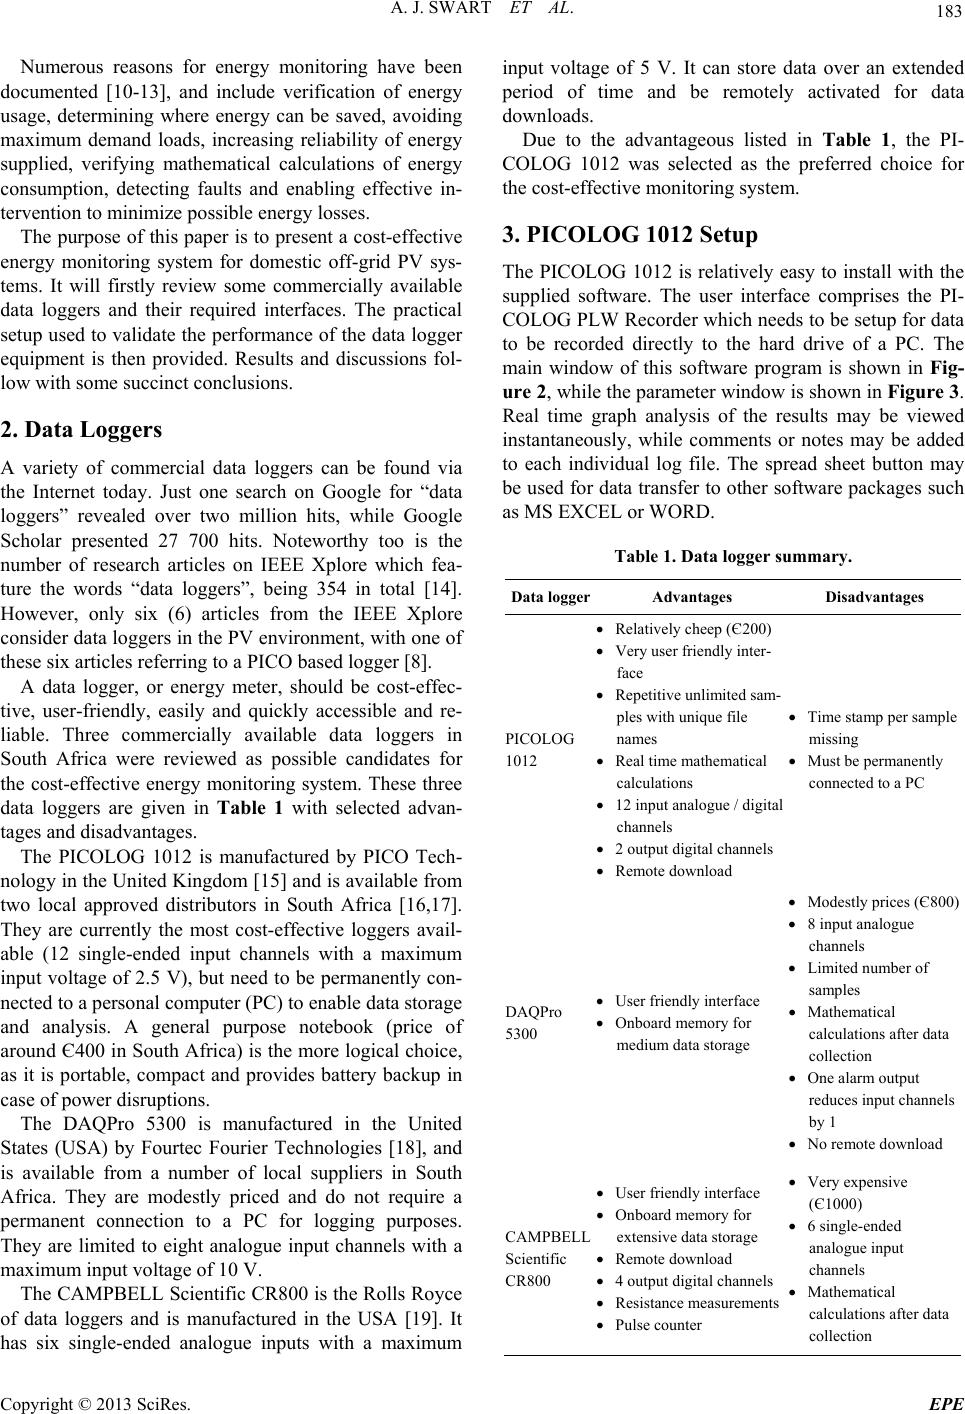 A. J. SWART ET AL. 183 Numerous reasons for energy monitoring have been documented [10-13], and include verification of energy usage, determining where energy can be saved, avoiding maximum demand loads, increasing reliability of energy supplied, verifying mathematical calculations of energy consumption, detecting faults and enabling effective in- tervention to minimize possible energy losses. The purpose of this paper is to present a cost-effective energy monitoring system for domestic off-grid PV sys- tems. It will firstly review some commercially available data loggers and their required interfaces. The practical setup used to validate the performance of the data logger equipment is then provided. Results and discussions fol- low with some succinct conclusions. 2. Data Loggers A variety of commercial data loggers can be found via the Internet today. Just one search on Google for “data loggers” revealed over two million hits, while Google Scholar presented 27 700 hits. Noteworthy too is the number of research articles on IEEE Xplore which fea- ture the words “data loggers”, being 354 in total [14]. However, only six (6) articles from the IEEE Xplore consider data loggers in the PV environment, with one of these six articles referring to a PICO based logger [8]. A data logger, or energy meter, should be cost-effec- tive, user-friendly, easily and quickly accessible and re- liable. Three commercially available data loggers in South Africa were reviewed as possible candidates for the cost-effective energy monitoring system. These three data loggers are given in Table 1 with selected advan- tages and disadvantages. The PICOLOG 1012 is manufactured by PICO Tech- nology in the United Kingdom [15] and is available from two local approved distributors in South Africa [16,17]. They are currently the most cost-effective loggers avail- able (12 single-ended input channels with a maximum input voltage of 2.5 V), but need to be permanently con- nected to a personal computer (PC) to enable data storage and analysis. A general purpose notebook (price of around Є400 in South Africa) is the more logical choice, as it is portable, compact and provides battery backup in case of power disruptions. The DAQPro 5300 is manufactured in the United States (USA) by Fourtec Fourier Technologies [18], and is available from a number of local suppliers in South Africa. They are modestly priced and do not require a permanent connection to a PC for logging purposes. They are limited to eight analogue input channels with a maximum input voltage of 10 V. The CAMPBELL Scientific CR800 is the Rolls Royce of data loggers and is manufactured in the USA [19]. It has six single-ended analogue inputs with a maximum input voltage of 5 V. It can store data over an extended period of time and be remotely activated for data downloads. Due to the advantageous listed in Table 1, the PI- COLOG 1012 was selected as the preferred choice for the cost-effective monitoring system. 3. PICOLOG 1012 Setup The PICOLOG 1012 is relatively easy to install with the supplied software. The user interface comprises the PI- COLOG PLW Recorder which needs to be setup for data to be recorded directly to the hard drive of a PC. The main window of this software program is shown in Fig- ure 2, while the parameter window is shown in Figure 3. Real time graph analysis of the results may be viewed instantaneously, while comments or notes may be added to each individual log file. The spread sheet button may be used for data transfer to other software packages such as MS EXCEL or WORD. Table 1. Data logger summary. Data loggerAdvantages Disadvantages PICOLOG 1012 Relatively cheep (Є200) Very user friendly inter- face Repetitive unlimited sam- ples with unique file names Real time mathematical calculations 12 input analogue / digital channels 2 output digital channels Remote download Time stamp per sample missing Must be permanently connected to a PC DAQPro 5300 User friendly interface Onboard memory for medium data storage Modestly prices (Є800) 8 input analogue channels Limited number of samples Mathematical calculations after data collection One alarm output reduces input channels by 1 No remote download CAMPBELL Scientific CR800 User friendly interface Onboard memory for extensive data storage Remote download 4 output digital channels Resistance measurements Pulse counter Very expensive (Є1000) 6 single-ended analogue input channels Mathematical calculations after data collection Copyright © 2013 SciRes. EPE 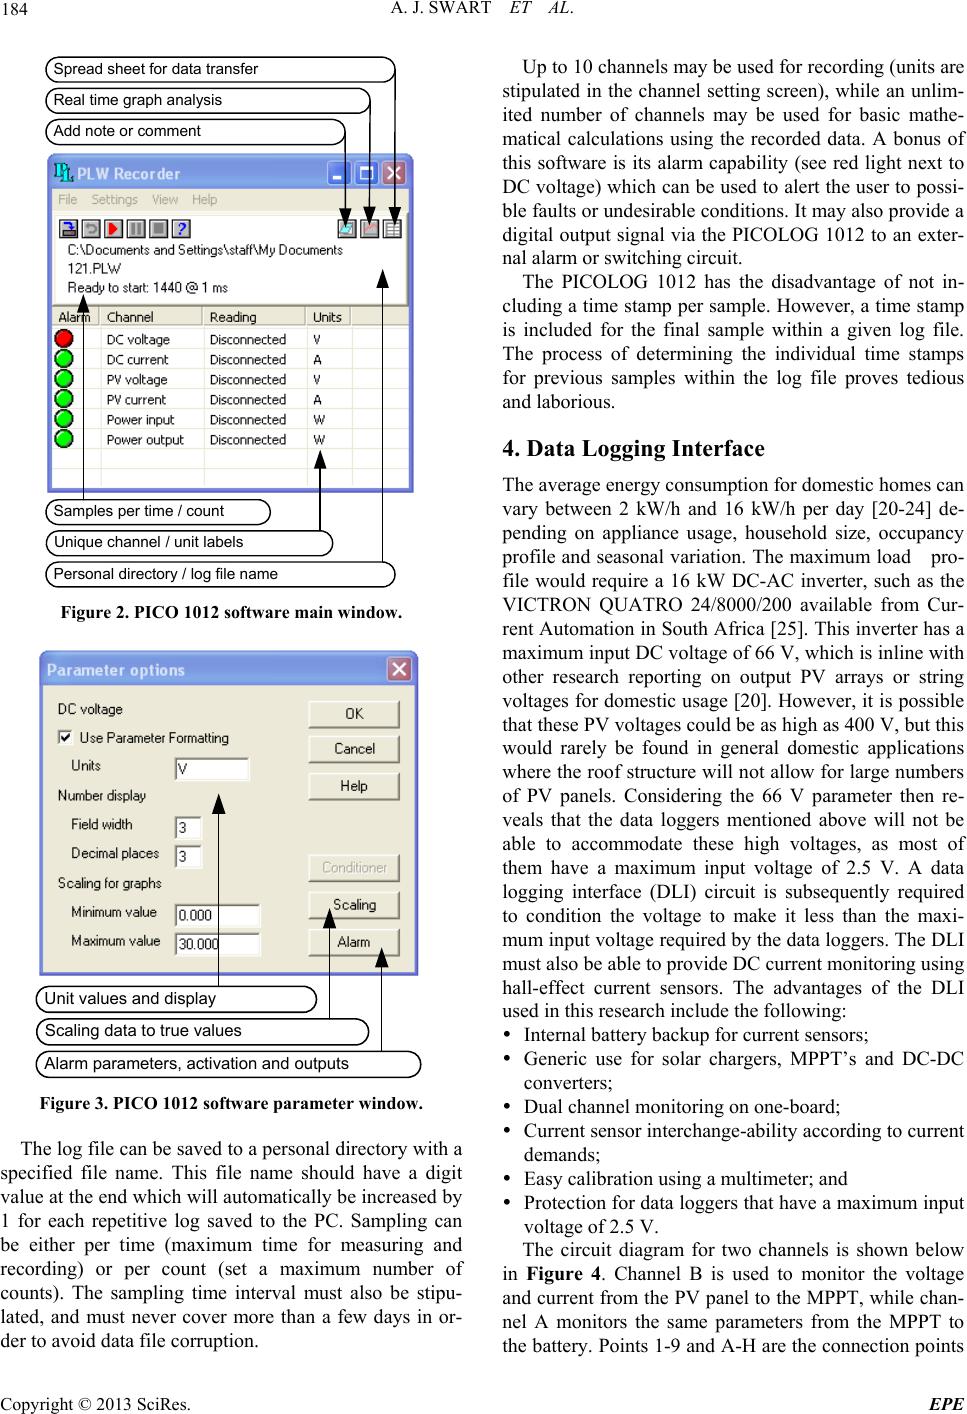 A. J. SWART ET AL. 184 Add note or comm ent Real time gr aph analysis Spread sheet for data transfer Unique channel / unit labels Samples per time / count Personal directory / log file name Figure 2. PICO 1012 software main window. Scaling data to true values Alarm parameters, activation and outputs Unit values and display Figure 3. PICO 1012 software parameter window. The log file can be saved to a personal directory with a specified file name. This file name should have a digit value at the end which will automatically be increased by 1 for each repetitive log saved to the PC. Sampling can be either per time (maximum time for measuring and recording) or per count (set a maximum number of counts). The sampling time interval must also be stipu- lated, and must never cover more than a few days in or- der to avoid data file corruption. Up to 10 channels may be used for recording (units are stipulated in the channel setting screen), while an unlim- ited number of channels may be used for basic mathe- matical calculations using the recorded data. A bonus of this software is its alarm capability (see red light next to DC voltage) which can be used to alert the user to possi- ble faults or undesirable conditions. It may also provide a digital output signal via the PICOLOG 1012 to an exter- nal alarm or switching circuit. The PICOLOG 1012 has the disadvantage of not in- cluding a time stamp per sample. However, a time stamp is included for the final sample within a given log file. The process of determining the individual time stamps for previous samples within the log file proves tedious and laborious. 4. Data Logging Interface The average energy consumption for domestic homes can vary between 2 kW/h and 16 kW/h per day [20-24] de- pending on appliance usage, household size, occupancy profile and seasonal variation. The maximum load pro- file would require a 16 kW DC-AC inverter, such as the VICTRON QUATRO 24/8000/200 available from Cur- rent Automation in South Africa [25]. This inverter has a maximum input DC voltage of 66 V, which is inline with other research reporting on output PV arrays or string voltages for domestic usage [20]. However, it is possible that these PV voltages could be as high as 400 V, but this would rarely be found in general domestic applications where the roof structure will not allow for large numbers of PV panels. Considering the 66 V parameter then re- veals that the data loggers mentioned above will not be able to accommodate these high voltages, as most of them have a maximum input voltage of 2.5 V. A data logging interface (DLI) circuit is subsequently required to condition the voltage to make it less than the maxi- mum input voltage required by the data loggers. The DLI must also be able to provide DC current monitoring using hall-effect current sensors. The advantages of the DLI used in this research include the following: Internal battery backup for current sensors; Generic use for solar chargers, MPPT’s and DC-DC converters; Dual channel monitoring on one-board; Current sensor interchange-ability according to current demands; Easy calibration using a multimeter; and Protection for data loggers that have a maximum input voltage of 2.5 V. The circuit diagram for two channels is shown below in Figure 4. Channel B is used to monitor the voltage and current from the PV panel to the MPPT, while chan- nel A monitors the same parameters from the MPPT to the battery. Points 1-9 and A-H are the connection points Copyright © 2013 SciRes. EPE 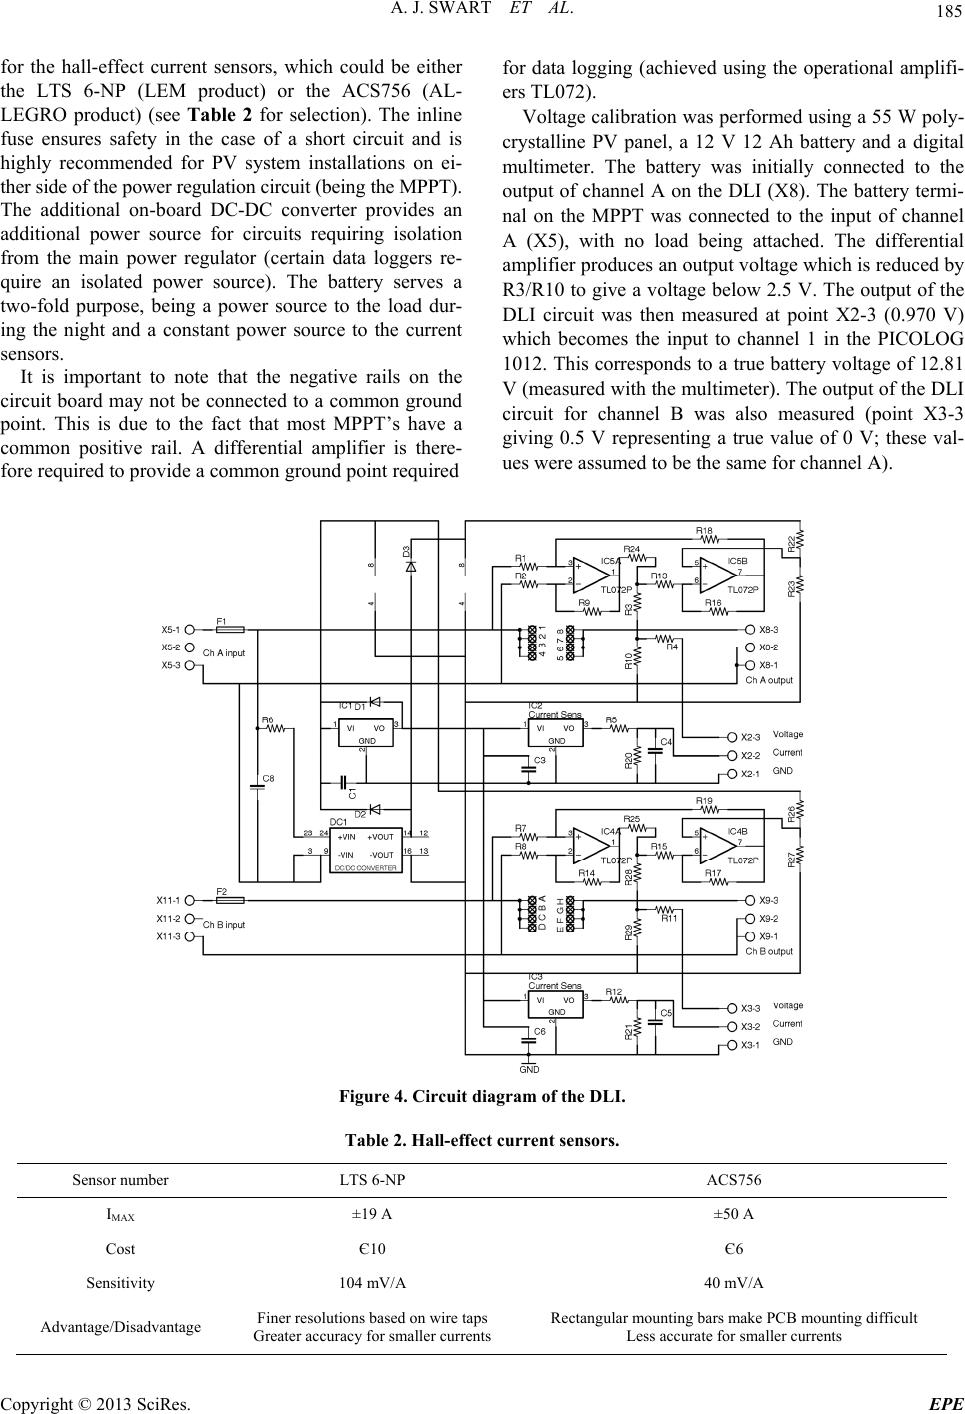 A. J. SWART ET AL. Copyright © 2013 SciRes. EPE 185 for the hall-effect current sensors, which could be either the LTS 6-NP (LEM product) or the ACS756 (AL- LEGRO product) (see Table 2 for selection). The inline fuse ensures safety in the case of a short circuit and is highly recommended for PV system installations on ei- ther side of the power regulation circuit (being the MPPT). The additional on-board DC-DC converter provides an additional power source for circuits requiring isolation from the main power regulator (certain data loggers re- quire an isolated power source). The battery serves a two-fold purpose, being a power source to the load dur- ing the night and a constant power source to the current sensors. It is important to note that the negative rails on the circuit board may not be connected to a common ground point. This is due to the fact that most MPPT’s have a common positive rail. A differential amplifier is there- fore required to provide a common ground point required for data logging (achieved using the operational amplifi- ers TL072). Voltage calibration was performed using a 55 W poly- crystalline PV panel, a 12 V 12 Ah battery and a digital multimeter. The battery was initially connected to the output of channel A on the DLI (X8). The battery termi- nal on the MPPT was connected to the input of channel A (X5), with no load being attached. The differential amplifier produces an output voltage which is reduced by R3/R10 to give a voltage below 2.5 V. The output of the DLI circuit was then measured at point X2-3 (0.970 V) which becomes the input to channel 1 in the PICOLOG 1012. This corresponds to a true battery voltage of 12.81 V (measured with the multimeter). The output of the DLI circuit for channel B was also measured (point X3-3 giving 0.5 V representing a true value of 0 V; these val- ues were assumed to be the same for channel A). Figure 4. Circuit diagram of the DLI. Table 2. Hall-effect current sensors. Sensor number LTS 6-NP ACS756 IMAX ±19 A ±50 A Cost Є10 Є6 Sensitivity 104 mV/A 40 mV/A Advantage/Disadvantage Finer resolutions based on wire taps Greater accuracy for smaller currents Rectangular mounting bars make PCB mounting difficult Less accurate for smaller currents 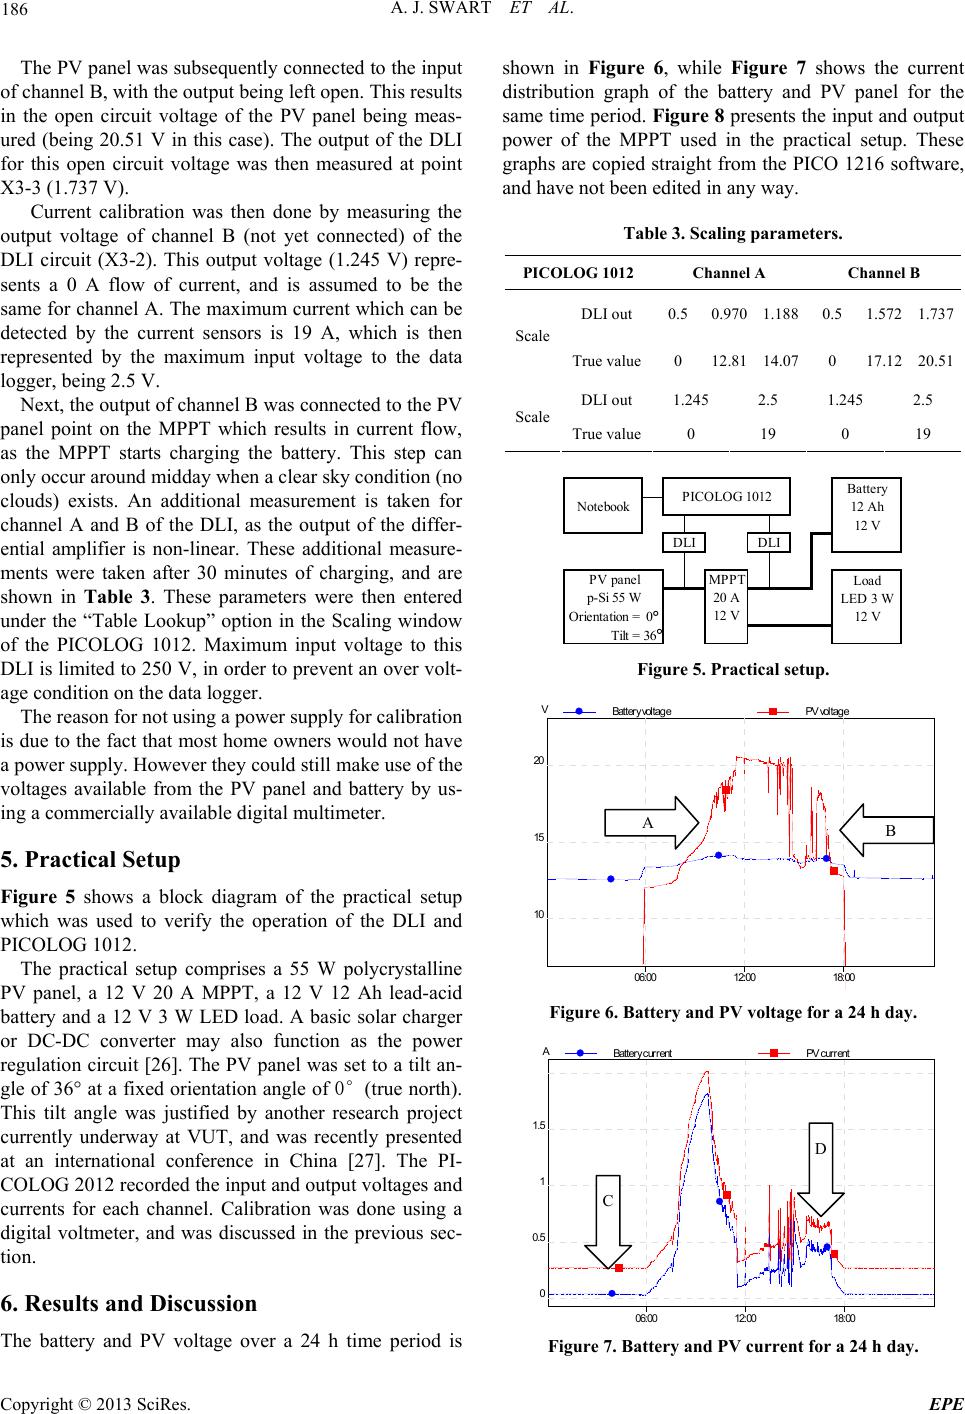 A. J. SWART ET AL. 186 The PV panel was subsequently connected to the input of channel B, with the output being left open. This results in the open circuit voltage of the PV panel being meas- ured (being 20.51 V in this case). The output of the DLI for this open circuit voltage was then measured at point X3-3 (1.737 V). Current calibration was then done by measuring the output voltage of channel B (not yet connected) of the DLI circuit (X3-2). This output voltage (1.245 V) repre- sents a 0 A flow of current, and is assumed to be the same for channel A. The maximum current which can be detected by the current sensors is 19 A, which is then represented by the maximum input voltage to the data logger, being 2.5 V. Next, the output of channel B was connected to the PV panel point on the MPPT which results in current flow, as the MPPT starts charging the battery. This step can only occur around midday when a clear sky condition (no clouds) exists. An additional measurement is taken for channel A and B of the DLI, as the output of the differ- ential amplifier is non-linear. These additional measure- ments were taken after 30 minutes of charging, and are shown in Table 3. These parameters were then entered under the “Table Lookup” option in the Scaling window of the PICOLOG 1012. Maximum input voltage to this DLI is limited to 250 V, in order to prevent an over volt- age condition on the data logger. The reason for not using a power supply for calibration is due to the fact that most home owners would not have a power supply. However they could still make use of the voltages available from the PV panel and battery by us- ing a commercially available digital multimeter. 5. Practical Setup Figure 5 shows a block diagram of the practical setup which was used to verify the operation of the DLI and PICOLOG 1012. The practical setup comprises a 55 W polycrystalline PV panel, a 12 V 20 A MPPT, a 12 V 12 Ah lead-acid battery and a 12 V 3 W LED load. A basic solar charger or DC-DC converter may also function as the power regulation circuit [26]. The PV panel was set to a tilt an- gle of 36° at a fixed orientation angle of 0°(true north). This tilt angle was justified by another research project currently underway at VUT, and was recently presented at an international conference in China [27]. The PI- COLOG 2012 recorded the input and output voltages and currents for each channel. Calibration was done using a digital voltmeter, and was discussed in the previous sec- tion. 6. Results and Discussion The battery and PV voltage over a 24 h time period is shown in Figure 6, while Figure 7 shows the current distribution graph of the battery and PV panel for the same time period. Figure 8 presents the input and output power of the MPPT used in the practical setup. These graphs are copied straight from the PICO 1216 software, and have not been edited in any way. Table 3. Scaling parameters. PICOLOG 1012 Channel A Channel B DLI out 0.50.970 1.188 0.5 1.5721.737 Scale True value0 12.81 14.07 0 17.1220.51 DLI out 1.245 2.5 1.245 2.5 Scale True value0 19 0 19 Battery Notebook12 Ah 12 V Load LED 3 W Orientation =0°12 V Tilt =36° MPPT 20 A 12 V PICOLOG 1012 PV panel p-Si 55 W DLI DLI Figure 5. Practical setup. V 10 15 20 B a tte ry vo ltagePV v oltage 06:00 12:00 18:00 AB Figure 6. Battery and PV voltage for a 24 h day. A 0 0.5 1 1.5 Battery currentPV current 06:00 12:00 18:00 C D Figure 7. Battery and PV current for a 24 h day. Copyright © 2013 SciRes. EPE  A. J. SWART ET AL. 187 W 0 10 20 30 Pow er inputPow er output 06:00 12:00 18:00 E F Figure 8. Input power (from the PV panel to the MPPT) and output power (from the MPPT to the battery). The PV panel’s voltage rises at 08:00 and falls at 18:00, giving rise to 12 hours of possible sunlight (see Figure 6). However, this does not mean that optimum output power is available for 12 h, as is indicated by the gradual rise of the current graph shown in Figure 7. Point A, in Figure 6, illustrates the PV panel’s output voltage rise from approximately 11 V (diffused radiation received) to 22 V (its maximum power point with direct radiation received) in accord with the movement of the sun. Point B shows the effect of cloud movement result- ing in the PV panel’s output voltage varying considerable. Point C (in Figure 7) highlights a concern in that the PV panel’s output current is not precisely 0 A during the night. This suggests that current calibration still requires attention. Point D verifies the fact that the PV current will always be higher than the battery current during the day, as the MPPT also consumes energy. Point E, in Figure 8, reveals the change-over in power consumption. During the night the battery provides power to the MPPT for driving the load, while the PV panel takes over during the day to fulfil this role. The negative power simply indicates that current is flowing in the reverse direction (from battery to the MPPT). Point F denotes the maximum power drawn for the day, being approximately 32 W, at approximately 10:15 the morning. 7. Conclusions A cost-effective energy monitoring system for domestic off-grid PV system installations was presented. The PI- COLOG 1012 was identified as an ideal real time data logger and a suitable DLI circuit was designed and con- structed. The results prove that the input and output pa- rameters of the power regulation circuit can be success- fully recorded and used to analyse the PV system’s per- formance. REFERENCES [1] At Task, “Six Common Mistakes that Plague IT Projects and Three Keys to Avoiding Them,” 2011. [2] S. V. Larsen, L. Kørnøv, and A. Wejs, “Mind the Gap in SEA: An Institutional Perspective on Why Assessment of Synergies amongst Climate Change Mitigation, Adap- tation and Other Policy Areas are Missing,” Environ- mental Impact Assessment Review, Vol. 33, No. 1, 2011, pp. 32-40. doi:0.1016/j.eiar.2011.09.003 [3] S. M. Shaahid and M. A. Elhadidy, “Economic Analysis of Hybrid Photovoltaic-diesel-battery Power Systems for Residential Loads in Hot Regions-A Step to Clean Fu- ture,” Renewable and Sustainable Energy Reviews, Vol. 12, No. 2, 2008, pp. 488-503. doi:0.1016/j.rser.2006.07.013 [4] IPCC, Special Report on Renewable Energy Sources and Climate Change Mitigation, [Online], Available at: http://www.ipcc.ch/. Accessed: 20 November 2011 [5] R. Pichs, “Statement by a Colleague of IPCC Working Group Co-chair Prof Ottomar Edenhofer,” 2011. [6] T. P. Chang, “Optimal Tilt Angles for Photovoltaic Mod- ules Using the PSO Method with Nonlinear Time-varying Evolution,” Energy, Vol. 35, No. 5, pp. 1954-1963. doi:0.1016/j.energy.2010.01.010 [7] E. Dursun and O. Kilic, “Comparative Evaluation of Dif- ferent Power Management Strategies of a Stand-alone PV/Wind/PEMFC Hybrid Power System,” International Journal of Electrical Power and Energy Systems, Vol. 34, No. 1, 2012, pp. 81-89. doi:10.1016/j.ijepes.2011.08.025 [8] L. K. Biswas, M. H. Rahman and S. Haque, “A Low Cost Caracteristics Analyzer of PV Module,” Developments in Renewable Energy Technology (ICDRET), 2012 2nd In- ternational Conference, 2012, pp. 1-5. [9] Energy Revolution-YUDU, [Online], Available at: http://content.yudu.com/Library/A1tlhk/Rexelrenewables Sharp/resources/12.htm. Accessed: 2012-04-12, [10] N. Lemmer, “Using Energy Meters as a Tool to Improve Energy-efficiency,” 25 Degrees in Africa, 2012, pp. 28-29. [11] S. C. Brofferio, A. Antonini, G. Galimberti and D. Galeri, “A Method for Estimating and Monitoring the Power Generated by a Photovoltaic Module Based on Super- vised Adaptive Neural networks,” Smart Measurements for Future Grids (SMFG), 2011 IEEE International Con- ference, 2011, pp. 148-153. [12] D. Sera, R. Teodorescu and P. Rodriguez, “Photovoltaic Module Diagnostics by Series Resistance Monitoring and Temperature and Rated Power Estimation,” Industrial Electronics, IECON 2008, 34th Annual Conference of IEEE, 2008, pp. 2195-2199. [13] N. Pearsall and B. Atanasiu, “The European PV System Monitoring Guidelines - Modernisation under the PER- FORMANCE Project,” Photovoltaic Specialists Confer- ence (PVSC), 2009 34th IEEE, 2009, pp. 000256-000261. [14] IEEE Xplore, Data Loggers, [Online], Available at: http://ieeexplore.ieee.org. Accessed: 1 July, 2012 [15] PICO Technology, Homepage, [Online], Available at: http://www.picotech.com/index.html. Accessed: 11 July, 2012 Copyright © 2013 SciRes. EPE  A. J. SWART ET AL. Copyright © 2013 SciRes. EPE 188 [16] AP Electronics, Homepage, [Online], Available at: http://www.apelectronics.co.za/. Accessed: 11 July, 2012 [17] RS Components, Homepage, [Online], Available at: http://za.rs-online.com/web/. Accessed: 11 July, 2012 [18] Fourtec Fourier Technologies, Homepage, [Online], Available at: http://www.fouriersystems.com/. Accessed: 17 July, 2012 [19] Campbell Scientific, Homepage, [Online], Available at: http://www.campbellsci.com/. Accessed: 20 July 2012 [20] M. Abdel-Salam, A. Ahmed, M. Amery, M. Swify, A. El-kousy and K. Sayed, “Design and Implementation of Stand-alone Residential PV System,” Applied Electrical Engineering and Computing Technologies (AEECT), 2011 IEEE Jordan Conference, 2011, pp. 1-6. [21] R. A. R. Kilpatrick, P. F. G. Banfill and D. P. Jenkins, “Methodology for Characterising Domestic Electrical Demand by Usage Categories,” Applied Energy, Vol. 88, No. 3, 2011, pp. 612-621. doi:10.1016/j.apenergy.2010.08.002 [22] U. Deichmann, C. Meisner, S. Murray and D. Wheeler, “The Economics of Renewable Energy Expansion in Ru- ral Sub-Saharan Africa,” Energy Policy, Vol. 39, No. 1, 2011, pp. 215-227. doi:10.1016/j.enpol.2010.09.034 [23] S. K. Firth, R. A. Buswell, and K. J. Lomas, “A Simple Model of Domestic pv Systems and Their Integration with Building Loads,” Eleventh International IBPSA Conference, Glasgow, Scotland, 2009. [24] Z. Li, F. Boyle, and A. Reynolds, “Domestic Application of Solar PV Systems in Ireland: The Reality of Their Eco- nomic Viability,” Energy, Vol. 36, No. 10, 2011, pp. 5865-5876. doi:10.1016/j.energy.2011.08.036 [25] Current Automation, Homepage, [Online], Available at: http://www.rectifier.co.za/index.html. Accessed: 20 July, 2012 [26] O. Asowata, J. Swart and C. Pienaar, “Optimum Tilt An- gles for Photovoltaic Panels during Winter Months in the Vaal Triangle, South Africa,” Smart Grid and Renewable Energy, Vol. 3, No. 2, 2012, pp. 119-125. doi:10.4236/sgre.2012.32017 [27] O. Asowata, A. J. Swart and H. C. Pienaar, “Optimum Tilt and Orientation Angles for Photovoltaic Panels in the Vaal Triangle,” Asia-Pacific Power and Energy Engi- neering Conference, Grand Mercure Baolong Hotel, Shanghai, China, 27-29 March, 2012. |