

Paper Menu >>
Journal Menu >>
 Energy and Power Engineering, 2013, 5, 15-21 doi:10.4236/epe.2013.54B003 Published Online July 2013 (http://www.scirp.org/journal/epe) Short-term Distributed Energy Resource Scheduling for a DC Microgrid G. W. Chang, H. J. Lu, H. J. Su Department of Electrical Engineering, National Chung Cheng University Email: [email protected] Received September, 2012 ABSTRACT A microgrid is associated with a low voltage distribution power network and inherits small modular generation systems and loads that have certain coordinated functions to provide the solution to supply premium power to remote or specific areas. Similar to conventional power systems, the energy management of distributed generation resources (DERs) is carried out to minimize the operation cost and maximize benefit of installation of DERS in a microgrid. This paper pre- sents the process of implementing the short-term DER scheduling function for a dc microgrid. The optimal scheduling results for two operation modes are then reported. Keywords: Microgrid; Distributed Generation Resources; PV; Battery 1. Introduction The microgrid is a group of traditional and/or distributed generation resources, energy storages, and loads that is normally connected to a low-voltage power network. The point of common coupling (PCC) with the connected power network can be disconnected and the microgrid is then functioned in islanding mode. The microgrid can provide the platform for integration of different renew- able resources with communications [1]. Due to characteristics of distributed energy resources, modern power systems have functions of changing its power flow either in one direction or bi-directions. Since it is a trend that active distributed systems have flexible and smart control systems to obtain clean energy from renewable sources, distribution systems have trans- formed into larger-scale of smarter grids or a smaller scale of localized microgrids. Microgrids can reduce cost of investment for installations of renewable sources and they also provide reactive power compensation and fre- quency regulation, increase capacity of spinning reserve, and improve power quality and reliability of customer’s power system. Unlike the conventional power system, a microgrid may include energy-storage devices such as batteries and becomes a strong coupling system in the time domain [2-4]. Furthermore, due to uncontrollable characteristics of DERs, certain operation function such as islanding mode of the grid and have to be further studied. In this paper, the short-term DER scheduling that considers the photovoltaic cell, wind generation, fuel cell, and energy- storage device (i.e. battery) of a dc microgrid supplying local loads is presented. The optimization model is developed for the consid- ered short-term DER scheduling problem. The objective is to minimize operational costs while satisfying the mi- crogrid load demand. All the DER and energy-storage units must be operated within their lower and upper out- put limits. The output of the power optimization model considers the operation limits of the supply options, load demand, sell/purchase power costs from the connected grid, and the operating costs of the DERs. Therefore, the objective function becomes minimizing operational costs represented by the difference between the profit and the cost. In the scheduling model, the problem is formulated as a nonlinear programming problem is solved by an op- timization toolbox provided by Matlab. To solve the mi- crogrid DER scheduling problem, a solution algorithm is proposed and implemented under MATLAB Graphical User Interface Development Environment (GUIDE). Results are then presented to show the usefulness of the proposed algorithm. 2. Problem Formulation Figure 1 shows the network configuration of the dc mi- crogrid under study, where the DERs in the system in- clude a wind turbine with the permanent magnet syn- chronous generator (PMSG), PV arrays, and a fuel cell. The energy-storage system is a battery. Two types of loads are in the system: one is the DC load fed by the DC bus and the other is the AC load connected to the AC Copyright © 2013 SciRes. EPE  G. W. CHANG ET AL. 16 grid. Interconnection between the DC microgrid and the AC grid is through a bi-directional inverter. To ensure a stable operation, the power generation and consumption must be balanced to keep the DC bus voltage within an acceptable range. The inverter and battery are responsi- ble for DC voltage regulation in the grid-connected and islanding modes, respectively. In the grid-connected mode, the battery acts like a constant current source and can be in charge, discharge, or non-operated mode. In the islanding mode, the inverter is mainly responsible for maintaining a stable voltage to the AC loads. 2.1. Photovoltaic Array Model The single-diode equivalent PV model shown in Figure 2 describes the v-i characteristic of PV arrays. In this model, the series resistance (RS) and the parallel resis- tance (RP) represent the effect PV conversion efficiency [5]. The equation describing the v-i characteristic is 0 () exp() 1 s s PH P qv iRv iR ii ikTA R (1) where i is the output current of the PV, iPH is the current generated by the incident light, i0 is the reverse saturation or the leakage current of diodes, q is the electron charge, v is the output voltage of the PV, k is Boltzmann constant, Figure 1. A typical configuration of DC microgrid. Figure 2. Equivalent single-diode PV mode. T is the temperature in Kelvin, A is the ideal factor of the PV (A = 1~1.5), RP is the series resistance, and RS is the parallel resistance. The parameters needed in the equiva- lent PV model are iPH, i0, RP, RS, and A; they can be ob- tained from the datasheets and the procedure for calcu- lating both series and parallel resistances [6, 7]. 2.2. Wind Turbine Model To model the permanent magnet synchronous generator (PMSG) of the wind turbine, the parameters of the PMSG are required to establish the detailed wind turbine models, which include the numbers of poles, dq-axis inductances, rotor resistance, etc. However, these pa- rameters are usually not provided by manufactories, the measurement-based wind turbine models can be obtained by establishing a look-up table of wind speed versus output power characteristic curve to represent wind tur- bine power characteristic [8]. 2.3. Models of Fuel Cell and Battery The fuel cell stack model shown in Figure 3 [9] is com- monly used and the parameters can be obtained from the datasheet shown in Figure 4, where Eoc is the open cir- cuit voltage, i0 is the exchange current, A is the Tafel slope, N is the number of cells, and Td is the response Figure 3. A commonly used model for the fuel cell [9]. 0 10 20 30 40 50 60 70 020406080100 120 140 160 Current (A) Voltage (V ) 0 1000 2000 3000 4000 5000 6000 7000 Power (W) Stack IP Curve Stack IV Curve Figure 4. Current-power (i-p) and current-voltage (i-v) cha- racteristic curves of a 5-kW fuel cell. Copyright © 2013 SciRes. EPE  G. W. CHANG ET AL. 17 time. The simplified model is based on the equivalent circuit of a fuel cell stack and represents a particular fuel cell stack operating at nominal conditions of temperature and pressure. Battery models in SPS include four prede- fined types: lead-acid, lithium ion, nickel metal hydride and nickel cadmium. Parameters of models are battery types, nominal voltage, rated capacity and initial charge state. 3. Short-term DER Scheduling of the DC Microgrid 3.1. Objective Function and Constraints The short-term DER scheduling of the dc microgrid is to achieve its minimum operation cost. If the microgrid includes N controllable DERs over a study period of T time steps, the objective function to be minimized under grid-connected and islanding modes can be expressed by (2) and (3), respectively. ,, 11 [(( ))()()] TN nn tgridgridtbattbattt tn CFPFPFP , , , (2) , 11 [(( ))()] TN nn tbattbatt t tn CFPFP (3) where Pn,t is the output power of the nth DER in the t-th time step. Pgrid,t and Pbatt,t are the output power of the connected grid (i.e. electric utility) and the energy-stor- age device, respectively. Fn, Fgrid, and Fbatt are cost func- tions associated with the nth DER, power sell or purchase of the electric utility, and energy-storage device, respec- tively. The constraints must be met at each time step are listed in (4)-(8). ,,, , 1 N ntgrid tbatt tload tunctrl t n PP P P P (4) min max ,nntn PPP (5) min max , g ridgridtgrid PP P (6) min max arg ,argch ebatttdische PPP (7) min 1maxtt SOCSOCSOC SOC (8) In (4)-(8), (4) is the power balance requirement during the t-th time step, which ensures a stable operation. Punctrl,t is output power of uncontrollable DERs (i.e., wind generation and PV arrays) during the t-th time step, and Pload,t is total active power of dc and ac loads; (5) is gen- eration limits for the n-th DER, where and are minimum and maximum generation, respectively. Equation (6) is inequality constrain of power from utility, and min n Pmax n P min g rid P and max g rid P are minimum and maximum power limitation. Equation (7) is associated with the charging and discharging power limits of the battery. In (8), the state-of-charge (SOC) of the battery must meet its nor- mal operation constraints, where SOCmin and SOCmax are the lower and upper energy storage limits for the battery. ΔSOCt is the change of SOC during the t-th time step. 3.2. Proposed Solution Procedure for the DER Scheduling Problem To solve the described short-term DER scheduling prob- lem for the micro grid in both islanding and grid-con- nected modes, it is assumed that, at each time step, the forecasts of power generation from uncontrollable DERs (i.e. PV and wind generator), the utility electricity price, the load consumption, the initial value of battery SOC and the microgrid operation mode are provided. In the grid-connected mode, the scheduling problem of (2)-(7) will be solved and the battery output and the power pur- chase from the connected utility grid at each time step will be determined at the minimum microgrid operation cost. In the islanding mode, the microgrid is discon- nected form the utility grid. Consequently, the problem is without considering the Pgird terms in the objective func- tion and constraints and is then solved. For both opera- tion modes, the scheduling problems are solved by the Matlab Optimization toolbox (quadratic programming solver) implemented with MATLAB GUIDE. Figure 5 illustrates the flowchart of the proposed solution proce- dure for both microgrid operation modes. 4. Case Study In this study, the simulations for an actual dc microgrid with grid-connected and islanding modes for 48 time steps (each time step spans over 15 minutes) are per- formed to show the scheduling results. The associated cost functions and constraints are listed in (9)-(17). 2 () 0.774.9419.36 FC FCFCFC FPP P (9) 0.5 5 FC kW PkW (10) _()3 g rid ingridgrid F PP (11) _()5 g rid outgridgrid F PP (12) 5 grid kW PkW5 (13) _arg ()1.5 batt chebattbatt F P P (14) _arg ()1.6 batt dischebattbatt F PP (15) 10 10 batt kW PkW (16) 1 85% 90% tt SOC SOC (17) where (9) and (10) are the fuel cell cost function and as- sociated generation limits. In (11)-(16), positive value of Pgrid and Pbatt implies that the electric power flows into the microgrid. Copyright © 2013 SciRes. EPE  G. W. CHANG ET AL. Copyright © 2013 SciRes. EPE 18 4.1. Case 1: Grid-Connected Mode 4.2. Case 2: Islanding Mode Figure 6 shows the forecasting curves of load demands and uncontrollable DERs for input to the problem. Figures 7 and 8 show the connected utility grid power purchase/sell (indicated by Taipower), DER generation and battery output with and without optimization, respec- tively. Table 1 indicates that optimal operation cost can be achieved by selling and purchasing power to/from the connected utility at different time steps based on the fo- recasted input. The cost saving without optimization is about 13% more than that with optimization. In this case, the load forecasting curve is shown in Fig- ure 9 and the generation forecasts of uncontrollable DERs are the same those of Case 1. Figures 10 and 11 show the connected utility grid power purchase/sell (in- dicated by Taipower), DER generation and battery output with and without optimization, respectively. By observ- ing Table 2, the cost saving with optimization is much less than that of Case 1. This is because that the islanding operation is without power purchase and sold to the util- ity grid. N ntbattbatttgridgridtnn T t PFPFPF 1 ,,, 1 )]()())(([min N ntunctrltloadtbatttgridtn PPPPP 1 ,,,,, max , minntnn PPP max , min gridtgridgrid PPP max arg, min arg edischtbattech PPP max1min SOCSOCSOCSOC tt N ntbattbatttnn T t PFPF 1 ,, 1 )]())(([min N ntunctrltloadtbatttn PPPP 1 ,,,, max , min ntnn PPP max arg, min arg edi schtbattech PPP max1min SOCSOCSOCSOC tt Figure 5. Flowchart of scheduling optimization program for grid-connected and islanding operations of the dc microgrid. 0 2 4 6 8 10 15913 17 2125 29 33374145 Time Step kW 0 2 4 6 159 131721252933374145 Time Step kW WT PV (a) (b) Figure 6. Forecasts of (a) load demand, and (b) uncontrollable DERs. 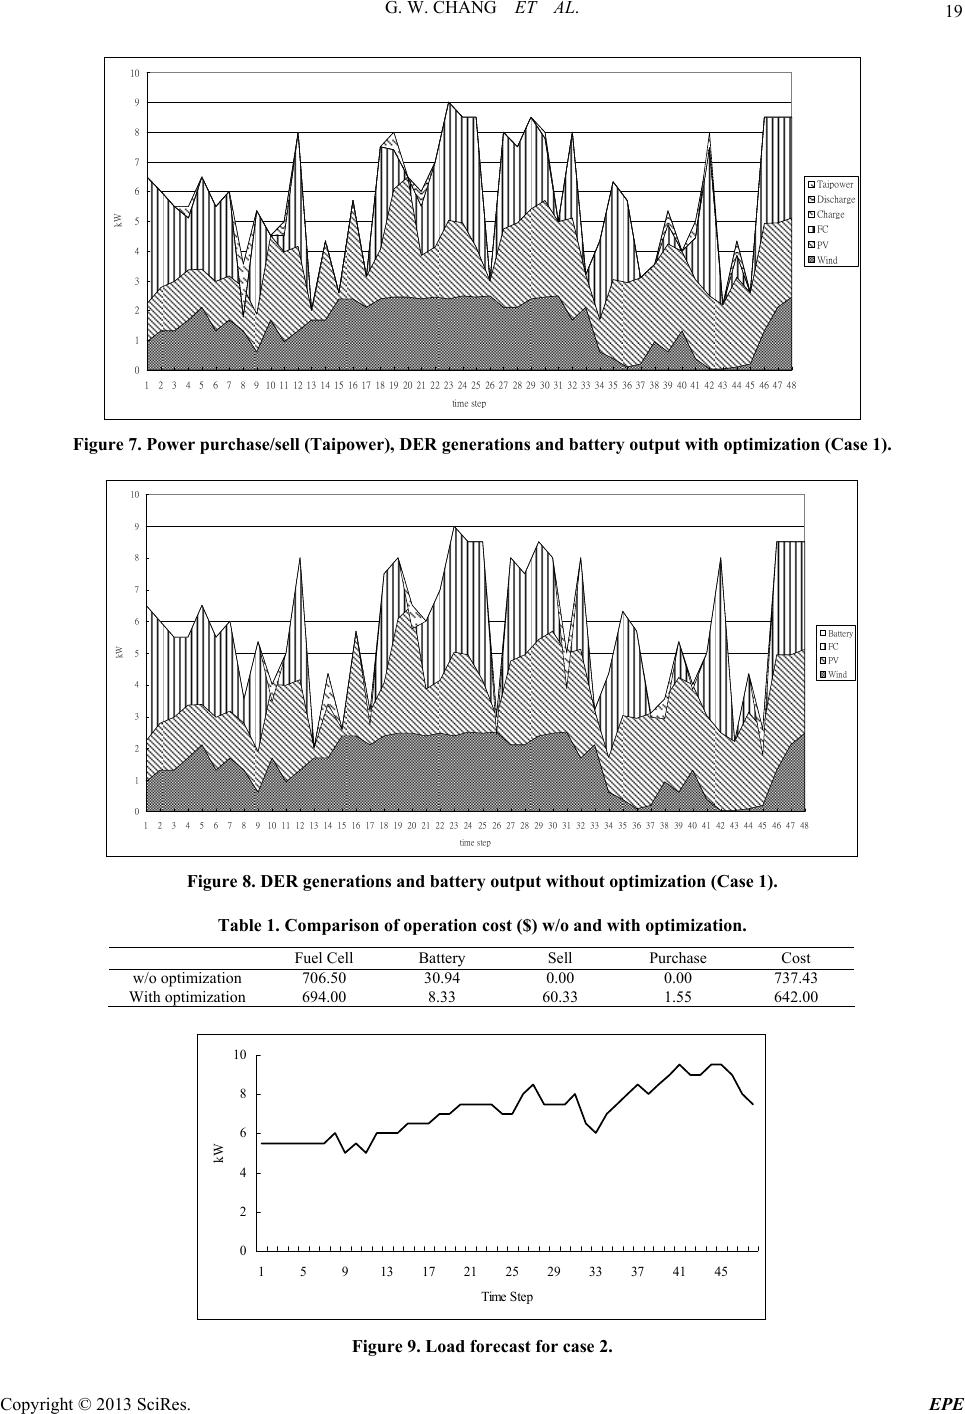 G. W. CHANG ET AL. 19 0 1 2 3 4 5 6 7 8 9 10 1 2 3 4 5 6 7 8 910111213141516171819202122232425262728293031323334353637 3839 4041 42 43 4445 4647 48 time step kW Taip ower Discharge Charge FC PV Wind Figure 7. Power purchase/sell (Taipower), DER generations and battery output with optimization (Case 1). 0 1 2 3 4 5 6 7 8 9 10 12345678910 11 1213 14 15 16 17 18 1920 21 22 23 2425 26 27 2829 30 31 32 33 34 3536 37 38 39 40 41 42 43 44 4546 47 48 time step kW Battery FC PV Wind Figure 8. DER generations and battery output without optimization (Case 1). Table 1. Comparison of operation cost ($) w/o and with optimization. Fuel Cell Battery Sell Purchase Cost w/o optimization 706.50 30.94 0.00 0.00 737.43 With optimization 694.00 8.33 60.33 1.55 642.00 0 2 4 6 8 10 159 131721252933374145 Time Step kW Figure 9. Load forecast for case 2. Copyright © 2013 SciRes. EPE 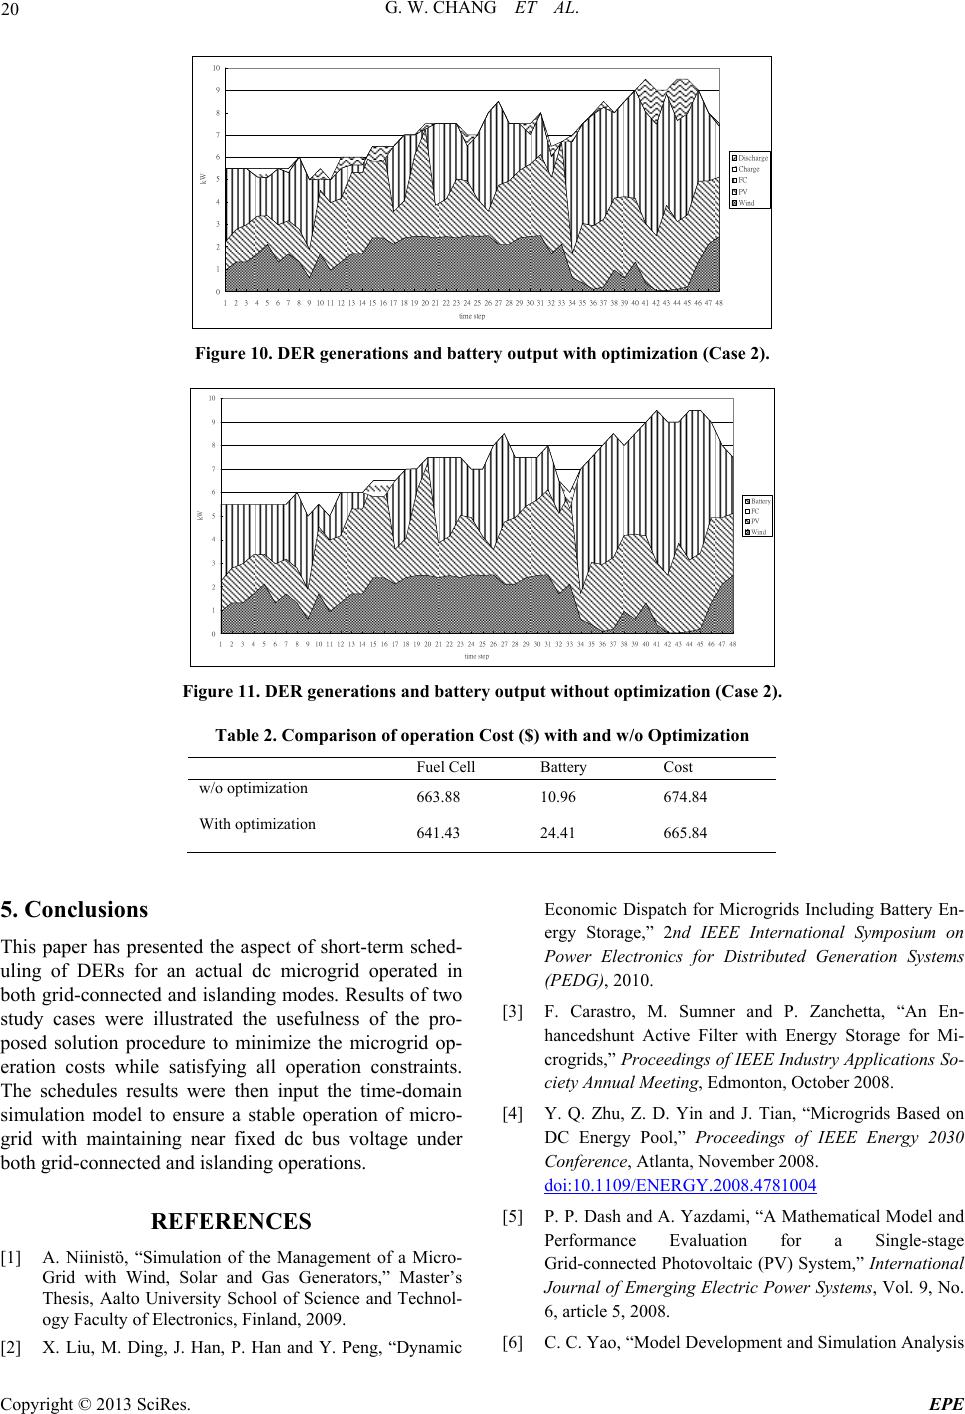 G. W. CHANG ET AL. Copyright © 2013 SciRes. EPE 20 0 1 2 3 4 5 6 7 8 9 10 1 2 34 5 6 7 8 910111213141516171819202122232425262728293031323334353637 38 39 4041 42 43 4445 46 47 48 time step kW Discharge Charge FC PV Wind Figure 10. DER generations and battery output with optimization (Case 2). 0 1 2 3 4 5 6 7 8 9 10 12345678910 11 12 13 14 15 16 17 18 19 2021 2223 24 25 26 27 28 2930 31 3233 34 353637 3839 40 41 4243 4445 46 4748 time step kW Battery FC PV Win d Figure 11. DER generations and battery output without optimization (Case 2). Table 2. Comparison of operation Cost ($) with and w/o Optimization Fuel Cell Battery Cost w/o optimization 663.88 10.96 674.84 With optimization 641.43 24.41 665.84 5. Conclusions This paper has presented the aspect of short-term sched- uling of DERs for an actual dc microgrid operated in both grid-connected and islanding modes. Results of two study cases were illustrated the usefulness of the pro- posed solution procedure to minimize the microgrid op- eration costs while satisfying all operation constraints. The schedules results were then input the time-domain simulation model to ensure a stable operation of micro- grid with maintaining near fixed dc bus voltage under both grid-connected and islanding operations. REFERENCES [1] A. Niinistö, “Simulation of the Management of a Micro- Grid with Wind, Solar and Gas Generators,” Master’s Thesis, Aalto University School of Science and Technol- ogy Faculty of Electronics, Finland, 2009. [2] X. Liu, M. Ding, J. Han, P. Han and Y. Peng, “Dynamic Economic Dispatch for Microgrids Including Battery En- ergy Storage,” 2nd IEEE International Symposium on Power Electronics for Distributed Generation Systems (PEDG), 2010. [3] F. Carastro, M. Sumner and P. Zanchetta, “An En- hancedshunt Active Filter with Energy Storage for Mi- crogrids,” Proceedings of IEEE Industry Applications So- ciety Annual Meeting, Edmonton, October 2008. [4] Y. Q. Zhu, Z. D. Yin and J. Tian, “Microgrids Based on DC Energy Pool,” Proceedings of IEEE Energy 2030 Conference, Atlanta, November 2008. doi:10.1109/ENERGY.2008.4781004 [5] P. P. Dash and A. Yazdami, “A Mathematical Model and Performance Evaluation for a Single-stage Grid-connected Photovoltaic (PV) System,” International Journal of Emerging Electric Power Systems, Vol. 9, No. 6, article 5, 2008. [6] C. C. Yao, “Model Development and Simulation Analysis  G. W. CHANG ET AL. 21 of Three-Phase Grid-Connected Photovoltaic Systems,” Master’s Thesis, Department Electric Engineering, Na- tional Taiwan University, Taipei, Taiwan, 2010. [7] M. G. Villalva, J. R. Gazoli and R. Filho, “Comprehen- sive Approach to Modeling and Simulation of Photo- voltaic Arrays,” IEEE Transactions on Power Electronics, Vol. 24, No. 5, 2009, pp. 1198-1208. doi:10.1109/TPEL.2009.2013862 [8] F. A Mohamed, “Microgrid Modeling and Online Man- agement, Ph.D. Dissertation, Department of Automation and Systems Technology,” Helsinki University of Tech- nology Espoo, Finland, 2008. [9] “SimPowerSystems Toolbox Users’ Manual,” Version 5.2, MathWorks Corp., 2010. Copyright © 2013 SciRes. EPE |