

Paper Menu >>
Journal Menu >>
 American Journal of Analytical Chemistry, 2013, 4, 594-599 http://dx.doi.org/10.4236/ajac.2013.410070 Published Online October 2013 (http://www.scirp.org/journal/ajac) Optimization of Fermentation Medium for Producing α-Hydroxyphenylacetic Acid by Using Plackett-Burman Design and Response Surface Methodology* Zhiguo Hou1, Bingmei Chen1, Jing Lan1, Yueman Liu1, Xiaoping Xu1#, James Yu Gu2, Junjie Gu3 1Collage of Chemistry and Chemical Engineering, Fuzhou University, Fujian, Fuzhou, China 2Department of Chemical Engineering, University of Ottawa, Ottawa, Canada 3Department of Mechanical and Aerospace Engineering, Carleton University, Ottawa, Canada Email: #[email protected] Received May 9, 2013; revised June 9, 2013; accepted July 10, 2013 Copyright © 2013 Zhiguo Hou et al. This is an open access article distributed under the Creative Commons Attribution License, which permits unrestricted use, distribution, and reproduction in any medium, provided the original work is properly cited. ABSTRACT Plackett-Burman design and response surface methodology were applied in order to optimize the fermentation medium of (R)-α-hydroxyphenylacetic acid ((R)-HPA) producing Bacillus sp. HZG-19. The factors playing important roles in the production of (R)-HPA were selected based on Plackett-Burman design. The path of steepest ascent was undertaken to optimize said fermentation medium. Finally, the optimal levels of the factors with the greatest change in regard to product yield were further optimized using Box-Behnken and response surface analysis. The optimal conditions were found to be as follows: casein peptone 30.49 (g × L−1), glycerol 14.09 (g × L−1), KH2PO4 0.1345 (g × L−1), K2HPO4 0.01 (g × L−1), CaCl2 0.1 (g × L−1), MnSO4 0.01 (g × L−1). Under the optimal conditions described above, the yield of (R)-HPA reached 63.30%, which indicated an increase of 14.9%, as compared to the yield obtained before optimization. Keywords: α-Hydroxyphenylacetic Acid; Fermentation Medium; Biotransformation; Response Surface Analysis 1. Introduction α-Hydroxyphenylacetic acid (mandelic acid) (HPA) and its derivatives are key intermediates for the production of various pharmaceuticals, such as semi-synthetic penicil- lins and cephalosporins [1-3]. It is also used as a chiral resolving agent and chiral synthon for the synthesis of anti-tumor and anti-obesity agents [4]. Many methods have been reported for the preparation of enantiomeri- cally pure (S)-or (R)-α-Hydroxyphenylacetic acid [5-9]. For example, the synthesis of enantiopure α-Hydroxy- phenylacetic acid has been investigated through dias- tereomeric crystallization [10]. It has also been prepared by the chemo-enzymatic routes [11], from methyl man- delate by lipase-catalyzed hydrolysis [12], or from ki- netic resolution [13]. However, these approaches are lim- ited in their industrial application due to the expensive catalysts, limited efficiency and low yields. Recently we have reported a new bacterial strain, Ba- cillus sp. HZG-19, which is capable of degrading phenyl- glyoxylic acid (PGA) and affording (R)-HPA with high optical purity. Numerous variables will have an effect on the production of HPA, hence, factors playing important roles in the production of pure enantimomeric (R)-HPA are crucial for large scale production. Plackett-Burman, Box-Behnken design and response surface methodology are inexpensive and accurate methods for further opti- mization of the fermentation medium. 2. Materials and Methods 2.1. Strain and Chemicals The strain (Bacillus sp. HZG-19) was preserved in the lab of Chemical Engineering Department, Fuzhou Uni- versity. (R)-HPA and (S)-HPA were purchased from Sigma (St. Louis, MO USA). Phenylglyoxylic acid (PGA, >98%) was supplied by Pharmaceutical & Chemical Co., Ltd of Taizhou, China. Methyl alcohol of HPLC grade was purchased from Merck, Germany. Hydroxypropyl- *The work was supported by the Doctoral Fund of Ministry of Educa- tion (No. 20103514110002) and the Major Plan Project of Science and Technology of Fujian Province (No. 2009N0046). #Corresponding author. C opyright © 2013 SciRes. AJAC  Z. G. HOU ET AL. 595 β-cyclodextrin (HP-β-CD) was supplied by Fluka (Neu Ulm, Germany). All other chemicals were obtained from local suppliers and of reagent grade. 2.2. Medium Seed medium (g × L−1): casein peptone 10, beef extract 5, maltose 10, NaCl2, pH 7.2. Fermentation medium (FM) (g × L−1): casein peptone 20, glycerol 10, K2HPO4 0.01, KH2PO4 0.1, CaCl2 0.1, MnSO4 0.01, pH 7.2. Medium for slant culture (SM): same as seed medium with 2% (w/v) of agar. 2.3. Culture Conditions The strain, Bacillus sp. HZG-19, was inoculated into 20 ml seed medium in 50 ml Erlenmeyer flasks and cultured aerobically at 32˚C on a shaker (180 rpm). When the cells reached logarithmic phase, cultures were then in- oculated (1%, v/v) into 50 ml flasks containing 20 ml of FM medium at the same fermentation conditions. PGA solution, with a final concentration of 15 mM, was added directly into the fermentation broth under aseptic condi- tions. After 24 h of incubation, the supernatant that was obtained after centrifugation from the medium and was subjected to HPLC analysis and HPCE analysis to de- termine the concentration and purity of the HPA gener- ated. 2.4. Analytical Methods The concentrations of substrate and product were deter- mined by HPLC using a reverse phase column (Agilent HC-C 18, Ø 4.6 mm × 250 mm, 5 μm). The mobile phase is composed of methanol and phosphate buffer (25 mmol/L) (15:85, v/v) containing 6 mmol/L of tetrabu- tylammonium bromide (pH 6.8) at the rate of 1.0 ml/min. A UV detector (at 220 nm) was employed for quantifica- tion. The yield of HPA is expressed as: Yield%CHPA CPGA100%, where CHPA and CPGA represent the concentration of the HPA generated and initial concentration of PGA, respectively. The concentration of (R)-HPA and (S)-HPA were determined by HPCE. Detection was made at 214 nm using a buffer solution of Tris-phosphoric acid (100 mmol/L, pH 7.6) containing 150 g/L of hydroxypropyl- β-cyclodextrin. A voltage of 20 KV was applied at a temperature of 20˚C. Enantiomeric excesse.e.% RSRS 100%, (S)-HPA, respectively. where [R] and [S] are the concentration of (R)-HPA and 3. Results and Discussion is extremely useful in ation of experi- m Table 1. Design matrix and experimental results of Plack- 123(X4)X 5(X6) X7 (X8) X9Yield/% 3.1. Plackett-Burman Design The Plackett-Burman (PB) design screening and selecting for the most vital factors within a large candidate pool [14]. The experiments were carried out according to the design matrix shown in Table 1, with each row representing one trial while each column represents a single variable. The six factors listed are: casein peptone, glycerol, KH2PO4, K2HPO4, CaCl2, MnSO4, respectively. Three variables (X4, X6, X8) are dummy variables employed to evaluate the standard er- rors of the experiment. Elements (1) and (−1) are repre- sentative of the relative amounts each variable factor, either high or low, within each experimental trial. Yield of HPA is considered as response value. Levels selection and significance evalu ental variables are summarized in Table 2. Generally, effects with a confidence level of greater than 95% are considered to be actual effects, whereas a confidence level of less than 95% indicates that the effect may have resulted due to chance. As shown in Table 2, the confi- dence level of factors casein peptone (X1), glycerol (X2) and KH2PO4 (X3) are shown to be above 95% and con- sidered to be significant. The rest of the factors, K2HPO4 (X5), CaCl2 (X7) and MnSO4 (X9) had a confidence of below 95% in HPA production and hence, were consid- ered insignificant. The high level of X5, X7 and the low level of X9 were selected during further optimization studies. ett-Burman design. Run XX X 1 1−11 −1−1−1 1 1 1 59.52 2 11−11 −1−1 −1 1 160.71 3 −11 1 −11 −1 −1 −1 152.83 4 1−111 −11 −1 −1 −1 61.72 5 11−11 1 −1 1 −1 −162.34 6 111−11 1 −1 1 −1 61.31 7 −1111 −11 1 −1 156.63 8 −1−111 1 −1 1 1 −1 54.02 9 −1−1−11 1 1 −1 1 142.12 10 1−1−1−11 1 1 −1 151.32 11 −11−1−1−11 1 1 −1 51.90 12 −1−1−1−1−1−1 −1 −1 −145.05 Eapeafo ilichmoch exerimnt ws perrmedn tripates, te sae belw. Copyright © 2013 SciRes. AJAC  Z. G. HOU ET AL. 596 Table 2. Levels selection and significance evaluation of ex- perimental variables. Levels Code Low (−gh (1) T-test Pr > |t| Significancy 1) Hi X1 20 13.1833 0.0057 1* 30 X2 10 15 7.7648 0.0162 3* X3 0.1 0.15 7.9100 0.0156 2* X5 0.01 0.015 −2.8302 0.1054 6 X 0. 7 0. − 1 0.15 2.9269 0.0996 5 X9 0.01 015 3.2172 0.0845 4 *Ine thatignificanf m5%nce. eepest ascent search g/L)glycerol (g/L) KH2PO4 (g/L)Yield (%) dicat the scy is oore than 9 confide 3.2. Steepest Ascent Design to Approach the Optimal Region The steepest ascent method was applied in order to in- vestigate optimal substrate concentration, by slowly in- creasing substrates along the path of steepest ascent until no further increase in response is observed [15]. Based on the experimental results of PB, casein peptone, glyc- erol and KH2PO4 should be increased due to their posi- tive effect (positive value for t). Table 3 represents the design and results of the steepest ascent search experi- ment. As shown in Table 3, optimal fermentation me- dium should be around run 2, so the level of run 2 is con- sidered as center point in the follow-up response surface experiment. 3.3. Response Surface Analysis (RSM) and Establishment of Optimum Fermentation Medium RSM is a statistical method by which one can find the best conditions in a multi-factor system [16]. Among RSM, Box-Behnken design (BBD) method and central composite design are more frequently used than the oth- ers. When the number of the experimental factors does not exceed 5, Box-Behnken method is more economic. Casein peptone, glycerol and KH2PO4 were determined to be the main factors as shown through the PB experi- ment. X1, X2, X3 represent casein peptone, glycerol, KH2PO4 respectively and the yield of HPA shows the response value. Factor levels were determined by steepest ascent experiment. In order to investigate the optimum levels of those variables and study their interactions, a three-factor three-level BBD was applied. A total of 15 experiments were performed in triplicates, 12 of which used different factors while 3 trials were used as controls. Controls were used to estimate experi- mental error. Table 4 illustrates the coded and non-coded values of the experimental variables, with results of the BBD experiments given in Table 5. Table 3. Design and results of the st experiment. Runcasein peptone ( 1 25 12.5 0.125 54.12 2 28 13.5 0.135 61.92 3 31 14.5 0.145 59.37 4 34 15.5 0.155 54.10 5 37 16.5 0.165 52.35 Table 4. The coded and non-coded values of the experi- Coded level mental variables. Factors Code −1 0 1 casein peptone (g/L)X1 25 28 31 glycerol (g/L) X2 12.5 13.5 14.5 KH2PO4 (g/L) X3 0.125 0.135 0.145 Table 5. Design and results of BBD experiments. Run X1 23 X X Yield/% 1 −1 −1 0 55.53 2 −1 1 0 57.04 3 1 −1 0 56.3 4 1 1 0 62.43 5 0 −1 −1 54.13 6 0 −1 1 50.39 7 0 1 −1 56.06 8 0 1 1 56.89 9 −1 0 −1 52.78 10 1 0 −1 58.78 11 −1 0 1 52.68 12 1 0 1 56.42 13 0 0 0 61.83 14 0 0 0 62.02 15 0 0 0 61.93 ased on the experimental results of BBD (Table 5) an 2 12 B d regression analysis, a quadratic polynomial equation was established to identify the relationship between yield and variables. The model of coded units can be expressed as: 11 2 31 2 132 23 2 3 Y61.92667 1.9875X2.00875X 0.67125X1.652083X1.155X X 0.565X X2.449583X1.1425XX 5.109583X (1) where Y1 is the yield of HPA, X1, X 2 and X3 represent casein peptone, glycerol and KH2PO4, respectively. Copyright © 2013 SciRes. AJAC  Z. G. HOU ET AL. Copyright © 2013 SciRes. AJAC 597 eter- m was reliable with an R2 value of 0.9913. It suggested that model was unable to explain only 0.87% of the total variations. A low value of coefficient of the variation (C. V.) (1.0298) clearly indicated a very high degree of pre- cision and a good deal of reliability of the experimental values. Analysis of variance (ANOVA) is important in d ining the adequacy and significance of the quadratic model. ANOVA summary was shown in Table 6. The F- value of 63.1957 implies that the model was significant. A p value of <0.0001 indicated that there was only a 0.01% chance that model’s large F-value could occur due to noise. Values of “prob > F” less than 0.0500 indicated the significant model terms. The mathematical model Figures 1-2 show the response and contour curves for casein peptone, glycerol and KH2PO4. Contour curves Figure 1. Response surface plot and contour plot for HPA yield (%) as a function of casein peptone and KH2PO4 (X1 and X3 represent casein peptone and KH2PO4, respectively). Figure 2. Response surface plot and contour plot for HPA yield (%) as a function of glycerol and KH2PO4 (X2 and X3 repr sent glycerol and KH2PO4, respectively). e- 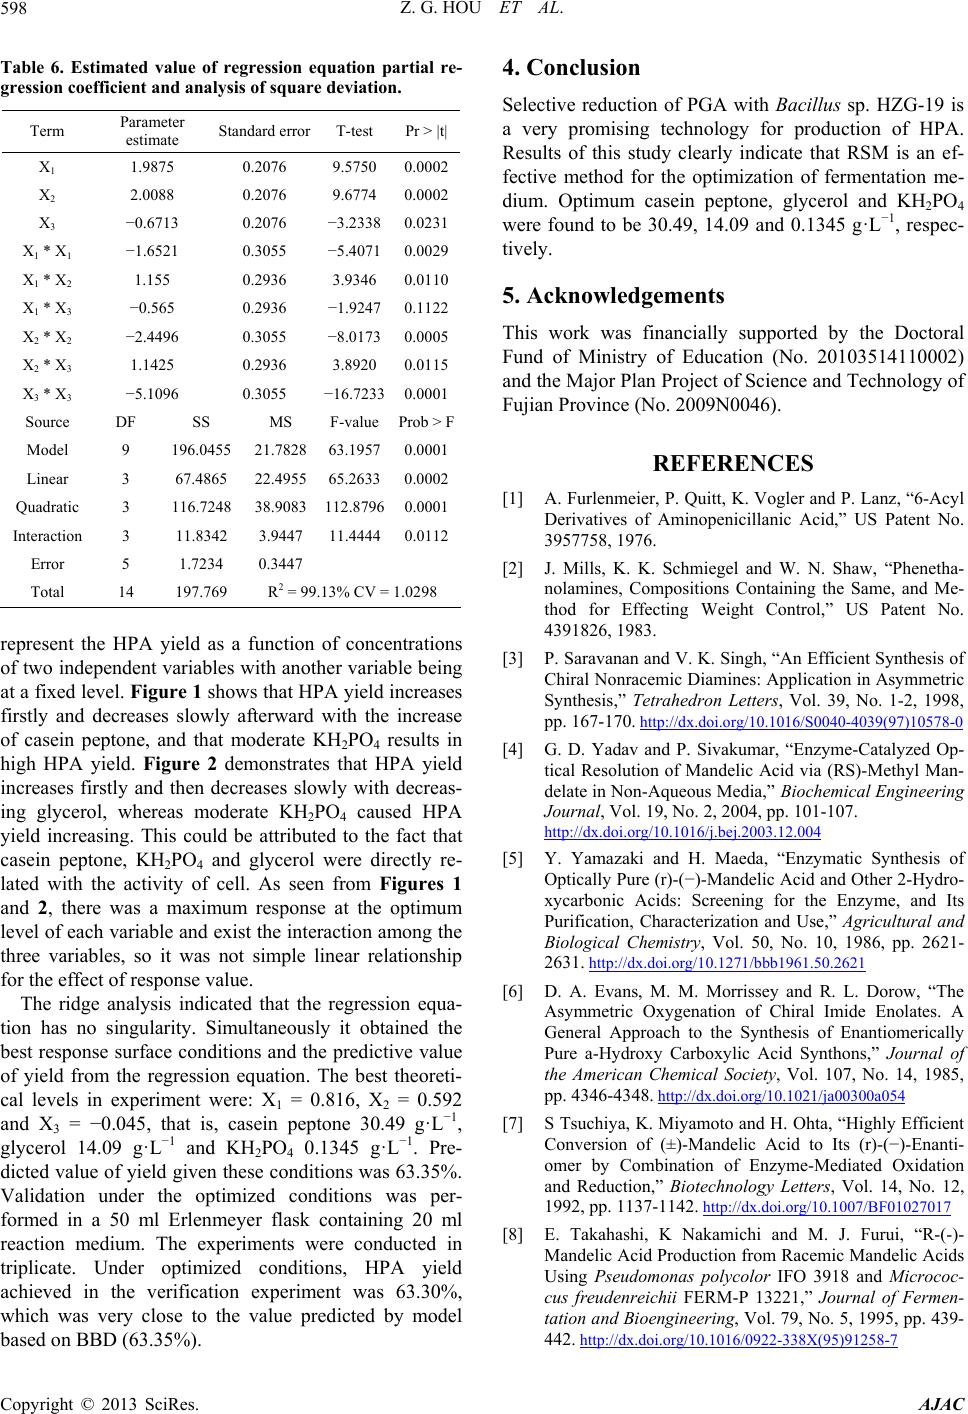 Z. G. HOU ET AL. 598 Table 6. Estimated value of regression equation partial re- ression coefficient and analysis of squareg deviation. |t|Term Parameter estimate Standard error T-test Pr > X1 1.9875 0.2076 9.5750 0.0002 X2 2.0088 0.2076 9.6774 0.0002 X3 − − X1 − − − − DF SS P 196.55 21.8 Quadr 112. I 197. 13% CV = 1.0298 0.6713 0.2076 3.2338 0.0231 1 * X−1.6521 0.3055 −5.4071 0.0029 X1 * X2 1.155 0.2936 3.9346 0.0110 X1 * X3 0.565 0.2936 1.9247 0.1122 X2 * X2 2.4496 0.3055 −8.0173 0.0005 X2 * X3 1.1425 − 0.2936 3.8920 0.0115 X3 * X3 5.1096 0.3055 16.7233 0.0001 Source MSF-valuerob > F Model 9 0478263.19570.0001 Linear 3 67.4865 116. 22.4955 65.26330.0002 atic 3 7248 38.9083 87960.0001 nteraction 3 11.8342 3.9447 11.44440.0112 Error 5 1.7234 0.3447 2 Total 14 769 R = 99. rep the fu f two independent variables with another variable bei neously it obtained the be logy for production of HPA. dy clearly indicate that RSM is an ef- ork was financially supported by the Doctoral Fund of Ministry of Education (No. 20103514110002) Science and Technology of er and P. Lanz, “6-Acyl Derivatives of Aminopenicillanic Acid,” US Patent No. 3957758, 1976 [2] J. Mills, K. K Shaw, “Phenetha- doi.org/10.1016/S0040-4039(97)10578-0 resentHPA yield as anction of concentrations ng [ o at a fixed level. Figure 1 shows that HPA yield increases firstly and decreases slowly afterward with the increase of casein peptone, and that moderate KH2PO4 results in high HPA yield. Figure 2 demonstrates that HPA yield increases firstly and then decreases slowly with decreas- ing glycerol, whereas moderate KH2PO4 caused HPA yield increasing. This could be attributed to the fact that casein peptone, KH2PO4 and glycerol were directly re- lated with the activity of cell. As seen from Figures 1 and 2, there was a maximum response at the optimum level of each variable and exist the interaction among the three variables, so it was not simple linear relationship for the effect of response value. The ridge analysis indicated that the regression equa- tion has no singularity. Simulta st response surface conditions and the predictive value of yield from the regression equation. The best theoreti- cal levels in experiment were: X1 = 0.816, X2 = 0.592 and X3 = −0.045, that is, casein peptone 30.49 g·L−1, glycerol 14.09 g·L−1 and KH2PO4 0.1345 g·L−1. Pre- dicted value of yield given these conditions was 63.35%. Validation under the optimized conditions was per- formed in a 50 ml Erlenmeyer flask containing 20 ml reaction medium. The experiments were conducted in triplicate. Under optimized conditions, HPA yield achieved in the verification experiment was 63.30%, which was very close to the value predicted by model based on BBD (63.35%). Selective reduction of PGA with Bacillus sp. HZG-19 is a very promising techno 4. Conclusion Results of this stu fective method for the optimization of fermentation me- dium. Optimum casein peptone, glycerol and KH2PO4 were found to be 30.49, 14.09 and 0.1345 g·L−1, respec- tively. 5. Acknowledgements This w and the Major Plan Project of Fujian Province (No. 2009N0046). REFERENCES [1] A. Furlenmeier, P. Quitt, K. Vogl . . Schmiegel and W. N. nolamines, Compositions Containing the Same, and Me- thod for Effecting Weight Control,” US Patent No. 4391826, 1983. 3] P. Saravanan and V. K. Singh, “An Efficient Synthesis of Chiral Nonracemic Diamines: Application in Asymmetric Synthesis,” Tetrahedron Letters, Vol. 39, No. 1-2, 1998, pp. 167-170. http://dx. [4] G. D. Yadav and P. Sivakumar, “Enzyme-Catalyzed Op- tical Resolution of Mandelic Acid via (RS)-Methyl Man- delate in Non-Aqueous Media,” Biochemical Engineering Journal, Vol. 19, No. 2, 2004, pp. 101-107. http://dx.doi.org/10.1016/j.bej.2003.12.004 [5] Y. Yamazaki and H. Maeda, “Enzymatic Synthesis of Optically Pure (r)-(−)-Mandelic Acid and Other 2-Hydro- xycarbonic Acids: Screening for the Enzyme, and Its Purification, Characterization and Use,” Agricultural and Biological Chemistry, Vol. 50, No. 10, 1986, pp. 2621- 2631. http://dx.doi.org/10.1271/bbb1961.50.2621 [6] D. A. Evans, M. M. Morrissey and R. L. Dorow, “The Asymmetric Oxygenation of Chiral Imide Enolates. A General Approach to the Synthesis of Enantiomerically Pure a-Hydroxy Carboxylic Acid Synthons,” Journal of the American Chemical Society, Vol. 107, No. 14, 1985, pp. 4346-4348. http://dx.doi.org/10.1021/ja00300a054 [7] S Tsuchiya, K. Miyamoto and H. Ohta, “Highly Efficient Conversion of (±)-Mandelic Acid to Its (r)-(−)-Enanti- omer by Combination of Enzyme-Mediated Oxidation and Reduction,” Biotechnology Letters, Vol. 14, No. 12, 1992, pp. 1137-1142. http://dx.doi.org/10.1007/BF01027017 [8] E. Takahashi, K Nakamichi and M. J. Furui, “R-(-)- Mandelic Acid Production from Racemic Mandelic Acids Using Pseudomonas polycolor IFO 3918 and Micrococ- cus freudenreichii FERM-P 13221,” Journal of Fermen- tation and Bioengineering, Vol. 79, No. 5, 1995, pp. 439- 442. http://dx.doi.org/10.1016/0922-338X(95)91258-7 Copyright © 2013 SciRes. AJAC 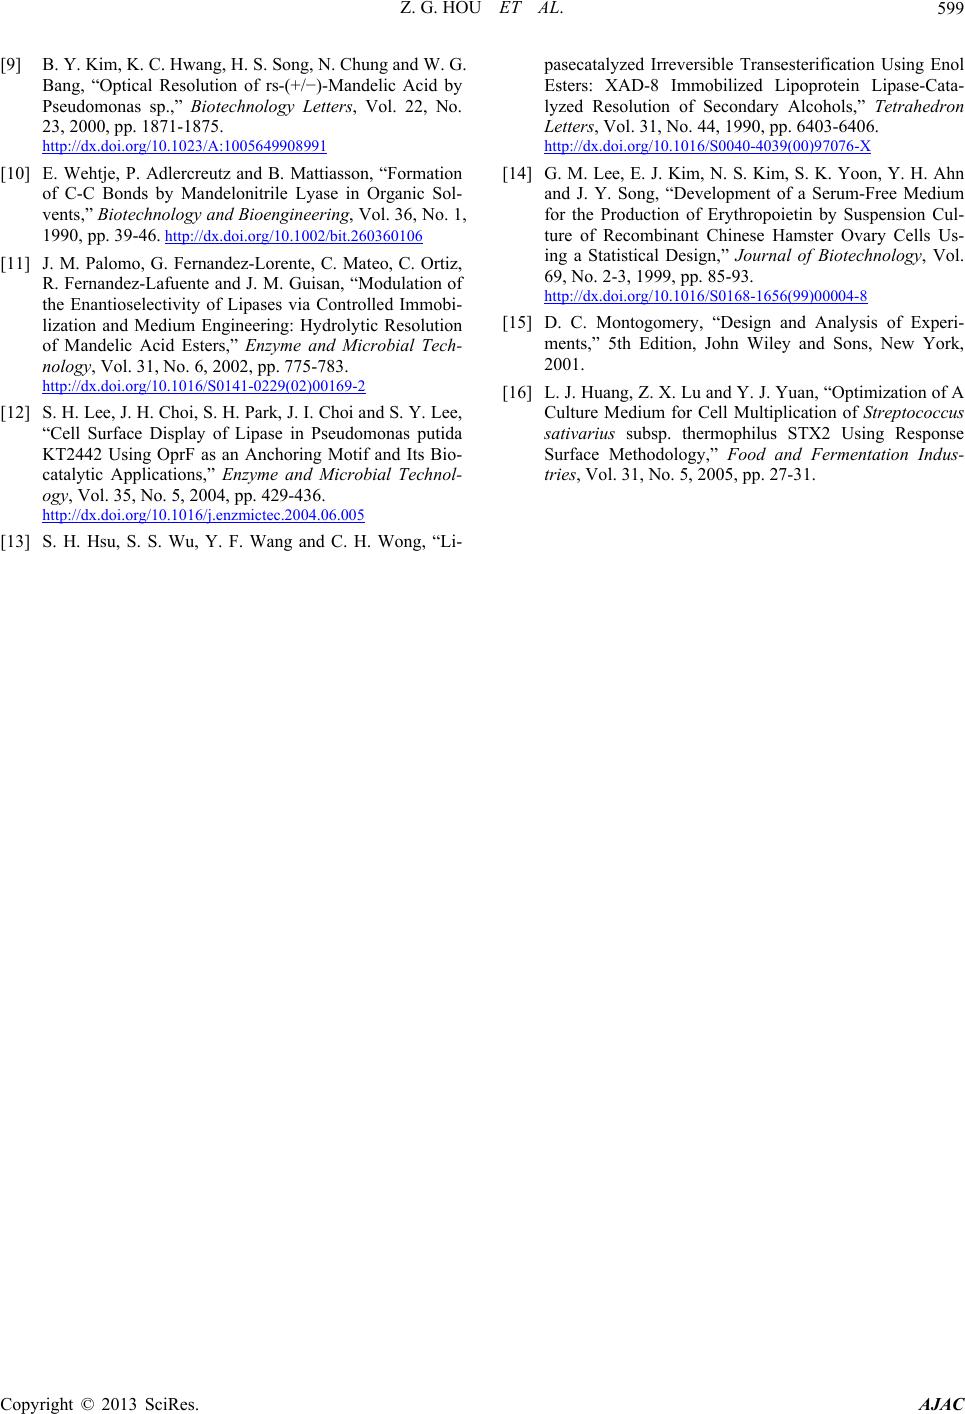 Z. G. HOU ET AL. 599 [9] B. Y. Kim, K. C. Hwang, H. S. Song, N. Chung and W. G. Bang, “Optical Resolution of rs-(+/−)-Mandelic Acid by Pseudomonas sp.,” Biotechnology Letters, Vol. 22, No. 23, 2000, pp. 1871-1875. http://dx.doi.org/10.1023/A:1005649908991 [10] E. Wehtje, P. Adlercreutz and B. Mattiasson, “Formation of C-C Bonds by Mandelonitrile Lyase in Organic Sol- vents,” Biotechnology and B 1990, pp. 39-46. ioengineering, Vol. 36, 260360106 No. 1, http://dx.doi.org/10.1002/bit. [11] J. M. Palomo, G. Fernandez-Lorente, C. Mateo, C. Ortiz, R. Fernandez-Lafuente and J. M. Guisan, “Modulation of the Enantioselectivity of Lipases via Controlled Immobi- lization and Medium Engineering: Hydrolytic Resolution of Mandelic Acid Esters,” Enzyme and Microbial Tech- nology, Vol. 31, No. 6, 2002, pp. 775-783. http://dx.doi.org/10.1016/S0141-0229(02)00169-2 [12] S. H. Lee, J. H. Choi, S. H. Park, J. I. Choi and S. Y. Lee, “Cell Surface Display of Lipase in Pseudomonas putida KT2442 Using OprF as an Anchoring Motif and Its Bio- catalytic Applications,” Enzyme and Microbi al Technol- ogy, Vol. 35, No. 5, 2004, pp. 429-436. http://dx.doi.org/10.1016/j.enzmictec.2004.06.005 [13] S. H. Hsu, S. S. Wu, Y. F. Wang and C. H. Wong, “Li- pasecatalyzed Irreversible Transesterification Using Enol Esters: XAD-8 Immobilized Lipoprotein Lipase-Cata- lyzed Resolution of Secondary Alcohols,” Tetrahedron Letters, Vol. 31, No. 44, 1990, pp. 6403-6406. http://dx.doi.org/10.1016/S0040-4039(00)97076-X [14] G. M. Lee, E. J. Kim, N. S. Kim, S. K. Yoon, Y and J. Y. Song, “Development of a Serum-Fr . H. Ahn ee Medium for the Production of Erythropoietin by Suspension Cul- ture of Recombinant Chinese Hamster Ovary Cells Us- ing a Statistical Design,” Journal of Biotechnology, Vol. 69, No. 2-3, 1999, pp. 85-93. http://dx.doi.org/10.1016/S0168-1656(99)00004-8 [15] D. C. Montogomery, “Design ments,” 5th Edition, John Wiley and Sons, and Analysis of Experi- New York, Medium for Cell Multiplication of Streptococcus 2001. [16] L. J. Huang, Z. X. Lu and Y. J. Yuan, “Optimization of A Culture sativarius subsp. thermophilus STX2 Using Response Surface Methodology,” Food and Fermentation Indus- tries, Vol. 31, No. 5, 2005, pp. 27-31. Copyright © 2013 SciRes. AJAC |