

Paper Menu >>
Journal Menu >>
 Open Journal of Civil Engineering, 2013, 3, 39-45 http://dx.doi.org/10.4236/ojce.2013.33B007 Published Online September 2013 (http://www.scirp.org/journal/ojce) Copyright © 2013 SciRes. OJCE Pedestrian Countdown Signals: What Impact on Safe Crossing? Janusz Supernak, Vinay Verma, Iga Supernak Department of Civil, Construction and Environmental Engineering, San Diego State University, San Diego, USA Email: [email protected] Received July 2013 ABSTRACT This paper examines safety impacts of a Pedestrian Countdown Signal (PCS) installed on a busy downtown intersection in San Diego, California. Crossing episodes of over 5000 pedestrians were videotaped and analyzed using multivariate statistical methods. Details of timing of pedestrian crossing as well as information about vehicular traffic and signal timing were carefully coded for each pedestrian. Significant safety benefits of the PCS system were found on the long crossings over a street with high vehicular volumes: most pedestrians were able to effectively increase their walking speed to complete their crossing without committing the exit violation —even if they have already committed the entry violation. However, on the short crossing with light vehicular traffic, PCS was generally ineffective in preventing the entry violations from becoming exit violations. Over there, many pedestrians felt safe enough to walk over a short crossing with no apparent vehicular traffic in sight instead of waiting for a green signal. The length of crossing and vo- lume of interfering vehicu lar traffic were consistently found the most significant variables affecting the crossing viola- tion rates of different categories of pedestrians. Crossing violation rates were the highest for runners, bicyclists and old- er males. Crossing violation charac teristics were found to be consistent over time. Keywords: Pedestrian Safety; Countdown Signals; Multivariate Analysis; Safety Impacts 1. Introduction PCS systems aim at improving pedestrian safety at the intersections: information about the number of seconds remaining for a safe crossing should help pedestrians to make a correct decision whether to start crossing or to wait for the next Steady Walk (SW) signal. It could also alert them to speed up their walking to safely complete their crossing maneuver in time and avoid any conflict with the vehicular traffic. Generally, PCS systems proved to bring tangible bene- fits in terms of reducing the percentage of finishing of the pedestrian crossings on Don’t Walk (DW) signal (il- legal exit). However, several studies indicated that PCS may actually increase the percentage of pedestrians who start crossing on Flashing Don’t Walk (FDW) signal (il- legal entry) as they may realize that they still have enough time to complete their crossing safely. A large San Francisco, CA study [1] found that PCS brought an impressive 52% reduction in pedestrian injury as well as statistically significant decrease in exit violations and in running or aborting crossing. At the same time, there was a slight (and statistically not significant) increase in the entry violations. The observed vehicle-pedestrian con- flicts decreased but not to the statistically significant le v- el. P edestrians were found to increase their speed to clear intersection in time. Similar positive results were re- ported in the Monterey, CA [2] and Las Vegas, NV [3] studies. But in the Montgomery County, study [4], the PCS performance was found to be somewhat mixed: only three out of five intersections studied found decrease in the exit violations. Even less impressive are results from the Lake Buena Vista, FL study: PCS installation re- sulted in more rather than less exit and entry violations there [5]. A before-after study performed at the city-first PCS-equipped intersection in downtown San Diego found that the new system brought a statistically signifi- cant decrease in percentage of illegal exits but also in- crease (although not statistically significant) in illegal entries [6]. International studies generally confirm the benefits of the PCS systems. For example, in Shanghai, China, PCS installation dramatically increased the proportion of suc- cessful crossing; the resulting safety improvement was experienced primarily by the older people [7]. A study from Auckland, New Zealand, concluded that PCS sys- tems favorably affect pedestrian crossing behavior if placed at suitable locations but may lead to increase in risky crossing behavior at some unsuitable locations [8].  J. SUPERNAK ET AL. Copyright © 2013 SciRes. OJCE 40 Most commonly, PCS installations begin the count- down procedure on the start of FDW interval rather than on the SW interval. However, some cities follow the op- posite procedure. Although there may be still discussion on which version of the PCS system may be preferred by the pedestrians, it is quite clear by now that the pede- strians overwhelmingly favor intersections equipped with PCS systems over those without PCS. Review of the literature indicates some diversity of conclusions reflecting not only any potential differences in pedestrian behavior over the wide range of local cir- cumstances but also some methodological issues related to study design and the actual analytical methods applied. This paper reports on an effort undertaken at San Diego State University (SDSU) to better understand the pede- strian crossing behavior at an intersection equipped with a PCS system [9]. Availability of the newly installed PCS system in downtown San Diego created not only an incentive to study its effectiveness but also created an opportunity to look into the core “anatomy” of the pede- strian crossing behavior through careful recording and coding of over 5000 crossing episodes made by a diver- sified gr oup of pedes trians. 2. Study Objectives The main goal of the SDSU study reported in this paper was to evaluate the long term effect of pedestrian count- down signals on the intersection crossing behavior of various groups of pedestrians in the context of pedestrian safety. Data collection was conducted using a video camera. The relevant data from each individual crossing episode were extracted from the video tapes and coded into a spreadsheet format suitable for analysis. Finally, the data were analyzed using statistical methods to sys- tematically study the pedestrian behavior at that PCS- equipped intersection. The following research questions were posted: 1) How common are pedestrian crossing violations? 2) Who are the violators? 3) Where do the violations happen? 4) When do the violations happen? 5) Are violations af- fected by the geometry of the crossing? 6) Are vio lations affected by the vehicular traffic? 7) Are violations con- sistent over time? 8) Do PCS systems reduce the most dangerous violation: illegal exit? 9) Do pedestrians use PCS displays to adjust their walking behavior to com- plete their intersection crossing in time? 3. The Venue The selected intersection is located at Broadway and Second Avenue in the downtown San Diego. It is sur- rounded by Westgate Hotel building, San Diego City Hall, NBC San Diego, Speckles Theater, and several stores and restaurants. A major trolley station is nearby. The study intersection has high pedestrian traffic vo- lumes during the day. The vehicular traffic volumes are high on Broadway but light on the Second Avenue. The study intersection is not equipped with pedestrian push buttons. The pedestrian crossing cycles are activated once per traffic cycle. Data was collected in the morning peak period time 8:00 to 10:00. One crosswalk was se- lected for one specific day. Video recording was done for three weeks from Monday to Thursday. Pedestrian video- tape records were examined carefully to properly code the behavior of each pedestrian on Excels spreadsheets. To assure privacy, no specific person was ever targeted or identified. Broadway Street is almost two times wider than the Second Avenue. The Broadway crossing distance is 25.8 m (86 feet) whereas the Second Avenue crossing dis- tance is 14.4 m (48 feet). At the time of the videotaping in August 2009, the c ycle length on the study inter se ction was c = 70 seconds. Cycle phasing for pedestrians was set as follows: Broadway Crossing: Walk: 7 sec; FDW: 21 sec and DW: 42 sec; Total: 70 sec. Second Avenue Crossing: Walk: 20 sec; FDW: 10 sec and DW: 40 sec; To tal: 70 sec. Assuming the conservative walking speed standard of 1.0 m/sec (3.5 ft/sec), a pedestrian would need almost 26 seconds to cross Broadway; a person who starts crossing at the beginning of the SW indication will have just 28 seconds to complete his/her crossing. If the 1.2 m/sec (4.0 ft/sec) speed standard was applied, the pedestrian would need 21.5 second s to cros s. This mean s that a slow walking pedestrian who enters legally at the end of his/ her SW phase may have difficulty to exit on time since the FDW signal is just 21 seconds long. The pedestrian timing plan for the Second Avenue crossing appears problematic. Assuming the 1.0 m/sec walking speed, a pedestrian would need almost 14 seconds to cross Second Avenue but the FDW phase there was only 10 seconds long. Thus, a pedestrian who starts crossing legally at the end of the SW indication may not have enough time to exit legally. Even if 1.2 m/sec standard was applied, the pedestrian would need 12 seconds to cross, more than the duration of the FDW phase. This problematic timing plan on the Second Ave- nue design (too long SW phase and too short FDW phase) may well be one of the contributing factors to Exit viola- tions on that crossing. 4. Pedestrian Data Organization 4.1. Pedestrian Crossing Situations Every pedestrian’s intersection crossing behavior can be  J. SUPERNAK ET AL. Copyright © 2013 SciRes. OJCE 41 classified as one of the four following situation s : Situation 1: Non Violation; Legal E ntry and Le gal Exit. Situation 2: Illegal Entry but Legal Exit. Situation 3: Legal Entry but Illegal Exit. Situation 4: Illegal Entry and Illegal Exit. In order for the Entry to be legal, it has to start on Steady Walk (SW) signal. In order for the Exit to be le- gal, it has to be completed on Steady Walk (SW) or Flashing Don’t Walk (FDW) signal. 4.2. Definition of Crossing Violations In order to effectively record and process the observed incidents of intersection crossing done by each individual pedestrian, the raw data was organized on a spreadsheet to record for each pedestrian the following pieces of in- formation : 1) date; 2) cycle number; 3) crossing identi- fication (Broadway or Second Avenue); and 4) person category number. The following crossing-related information was ex- tracted from the video for each pedestrian P: Tw = duration of the Steady Walk (SW) phase (sec). Tfdw = duration of the FDW phase (sec). to = time gap between the start of SW phase and the moment pedestrian P started his/her crossing (sec). t1 = time used by pedestrian P to reach the median of the intersection (sec). t2 = time used by pedestrian P to traverse the distance between the intersection median and the intersection end (sec). The following condition constitutes the Illegal Entry by pedestr i an P: w0 Tt0−< (1) The following condition constitutes the Illegal Exit by pedestrian P: ( ) wfdw0 1 2 TTttt 0+− ++< (2) If pedestrian P is increasing his/her speed as his/her intersection crossing progresses, the following condition is expected to be met: 21 tt0−< (3) In order to examine the effect of PCS on safe crossing, there is a need to identify those pedestrians who have already committed Entry Violation (entered on FDW) and were heading for the Exit Violation if their speed was not adjusted (increased). For this particular subset of pedestrians the condition t0 > Tw needs to meet the following additional condition: 01w fdw t 2t TT+>+ (4) If their speed was not adjusted, the original time t1 would be repeated on the second half of the intersection. However if the speed increase had sufficiently reduced t2, the Exit Violation could be avoided. Analysis of the intersection crossing episodes made by various categories of pedestrians at the study intersection in downtown San Diego proved that the vast majority of them crossed the intersection with a speed much faster than the design speed of 1.0 m/sec (3.5 feet/sec). Thus, despite the rather tight timing plan, Situation 3: legal entry yet illegal exit proved to be a very rare case. Dur- ing the three weeks of videotaping of 5504 crossing epi- sodes, this situation was encountered only once. For that reason, Situation 3 was not analyzed as a separate case. Thus, the study intersection exhibited only two distinct violation cases, consistently used in the analysis pre- sented in this paper: 1) Entry Violation: Illegal Entr y bu t still Legal Exit. 2) Exit Violation: Illegal Exit following Illegal Entry. 5. Analysis 5.1. Initial Definition of Pedestrian Ca t egories Twelve pedestrian categories were arbitrarily defined based on pedestrians’ age (below 18; 18 - 40; 40 - 65, above 65), gender (male, female) and their specific status (handicapped, runners, bicyclists). Their crossing beha- vior was videotaped and coded. Representations of the defined categories are quite uneven: for example, the Younger Males Category amounts for a half of all pede- strians in the sample. Categorization according to age and handicap was done consistently, based on the best possible i nt erpreta t ion of the vi deo data. 5.2. Comparison of Violation Proportions for the Twelve Pedest rian Categories A total of 5504 pedestrians were observed and classified into 12 categories. The three performance outcomes: Non-Violation; Entry Violation; and Exit Violation pro- portions were examined for the following variables: pe- destrian categories; time-of-day periods (peak/off-peak); days of the week (M, Tu, W, and Th); weeks (1, 2, and 3); length of crossing (short/long) and corresponding vehi- cular traffic (light, heavy) as well as corresponding tim- ing plans for the two crossings (short FDW/long FDW). The starting analysis was performed for the initial twelve categories of pedestrians to identify similarities and differences among them in terms of their intersection crossing behavior. A pair-wise comparisons of the entry and exit violation proportions was made to evaluate whether the performance measures between different those groups are statistically significant. The null hypo- thesis tested in all cases is that there is no difference be- tween groups, with the a lter native hypothesis that there is a statistically significant difference among them. 01 2 Hp p =: (5)  J. SUPERNAK ET AL. Copyright © 2013 SciRes. OJCE 42 12 Hp p a≠: (6) A two-tailed z test was performed at a confidence level of 95% with the corresponding critical z value (zα/2) of 1.96. Various groups of pedestrians were stratified ac- cording to several variables, and pair-wise proportion comparisons were performed to have preliminary know- ledge about the significance of those variables in de- scribing variations in Entry and Exit Violations propor- tions. The z-test brought the following initial results: 1) With both crossings analyzed jointly, older males were committing the Entry Violation more frequently than their younger male counterparts and that difference was significant. The same was also true for the Exit Vi- olation: older males were exiting illegally with higher frequency than their younger male counterparts but this difference was not significant. It is likely that younger males were able to adjust their walking speed more ef- fectively than their older counterp arts. 2) Persons performing sports activities (runners, bi- cyclists) were committing both Entry and Exit Violation more frequently than their “regular” pedestrian counter- parts. 3) For both Entry and Exit Violations, there was a sta- tistically significant difference in their frequency be- tween short and long crossing. The length of crossing is just one of the differences between those two crossings. There are two more differences: a) The long pedestrian crossing on Broadway is against heavy vehicular traffic whereas the short crossing over the Second Avenue has a very light vehicular traffic; and b) The FDW phase over Broadway is long whereas FDW phase over the Second Avenue is short. 4) Both Violation types are more frequent during the peak period (8 - 9 am) than during the off peak period (9 - 10 am), as expected. Rushing to work may be the rea- son for more frequent violations during the pea k pe riod. 5.3. Comparison of Violation Proportions for the Six Pedestrian Categories Initial statistical analysis: comparison of violation pro- portions for the twelve pedestrian categories helped to identify those categories of pedestrians who were the most common violators. However, some of the categories were not represented with enough observations despite the relatively long (three weeks) observation period. For example, people with handicap amounted to just one case out of 5504 observations; a much larger observation pe- riod and a larger sample would have been needed to ob- tain statistically valid results concerning this group of pedestrians at the study intersection. For the purpose of the further analysis, some of the “old” categories 1 through 12 were merged to create six “new” categories A through F. A common sense judg- ment was used to create this new categorization of pede- strians. Definitions of the new categories and respective Entry and Exit Violation proportions are presented in Table 1 and can be summarized as follows: 1) Pedestrians crossing the study intersection in down- town San Diego were predominantly younger males and females: they accounted for 88% of the entire sample of pedestrians. 2) The overall Entry Violation proportions were quite high (around 30%) for both crossings. The highest Entry Violation rates were for the runners and bicyclists, and for older males, particularly on the short crossing. 3) The overall Exit Violation proportions were quite small (around 6%) on the long crossing but remained substantial on the short crossing (ar ound 20%). 4) On the long crossing, 78% of the Entry Violations did not lead into consequent Exit Violations. But on the short crossing, this number was only 34%. 5) Significant reduction in Violation frequency be- tween the intersection entry and the exit on the long crossing may be partially attributed to the PCS system; more detailed analysis follows to test this hypothesis . 5.4. Chi-Square Analysis Chi-square analysis was performed on the new categories to evaluate whether pedestrian behavior represented by the proportions among the three possible outcomes (No Violation, Entry Violation, Exit Violation) varied with different pedestrian categories, weeks, time of the day, day of the week or length of crossing. The null hypothe- sis tested in all cases is that there is no difference in pro- portions between the strata, with the alternative hypothe- sis that there is a statistically significant difference be- tween the strata: Table 1. Crossing violation proportions for six person ca- tegories. Pedestrian Long crossing Short crossing Category Entry Exit Ent ry Exit Violation Violation Violation Violation A. Children 30.8% 0.0% 8.5% 5.1% B. Younger Males 29.5% 7.8% 30.0% 20.4% C. Younger Females 20.6% 3.3% 30.0% 18.6% D. Older Males 34.1% 3.9% 42.7% 28.9% E. Older Females 26.1% 4.3% 34.5% 23.8% F. Runners, Bicyclists 31.6% 5.3% 61.3% 48.4% Overall 26.6% 5.8% 31.0% 20.6% 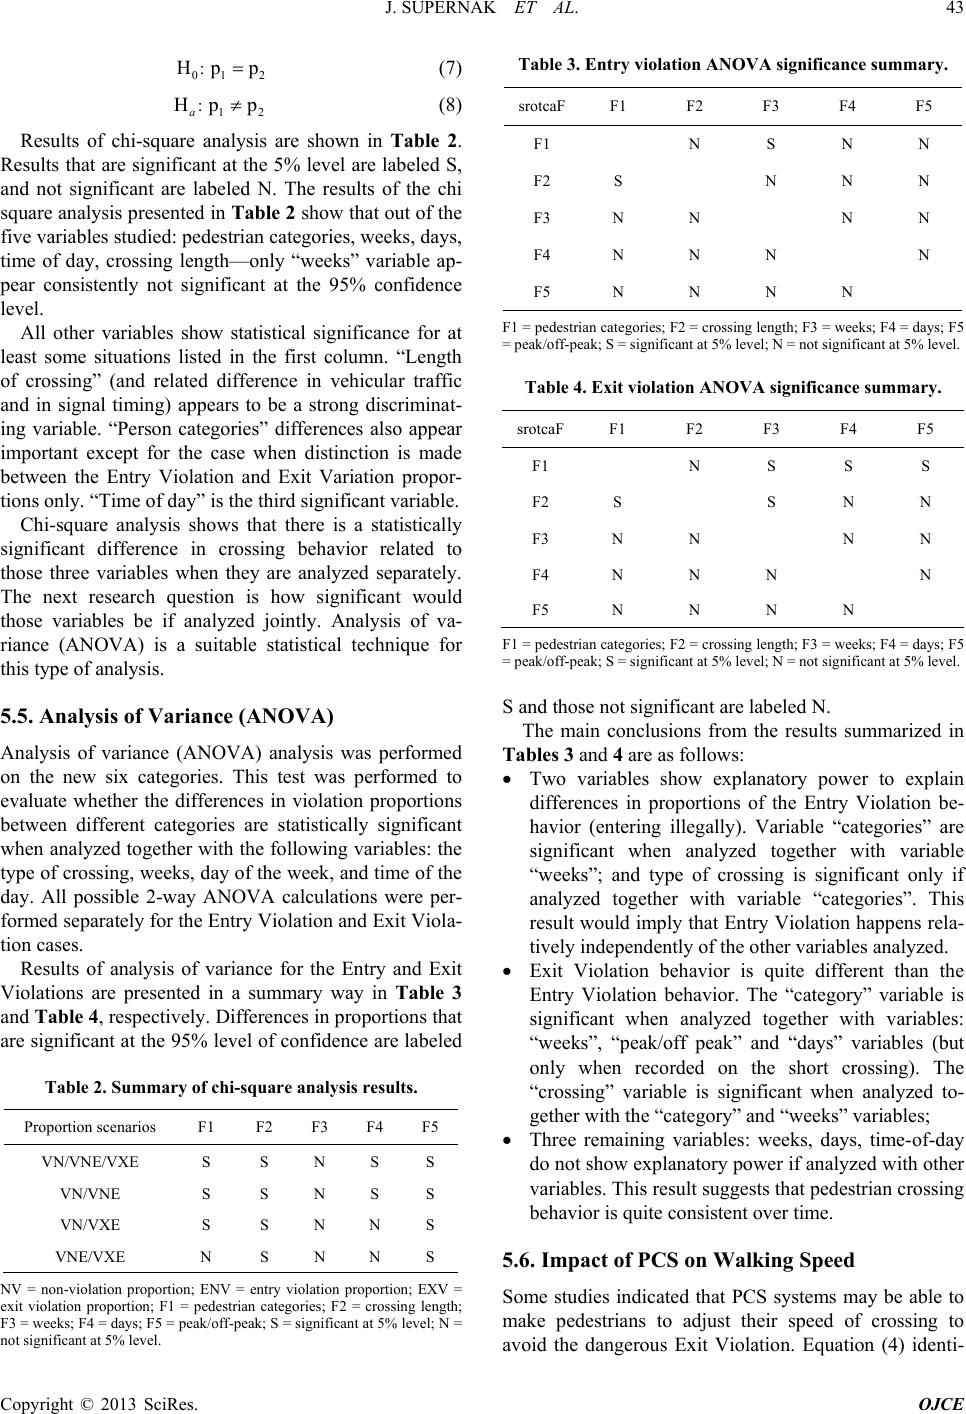 J. SUPERNAK ET AL. Copyright © 2013 SciRes. OJCE 43 01 2 Hp p= : (7) 12 Hp p a≠: (8) Results of chi-square analysis are shown in Table 2. Results that are significant at the 5% level are labeled S, and not significant are labeled N. The results of the chi square analysis presented in Table 2 show that o ut of the five variables studied: pedestrian categories, weeks, days, time of day, crossing length—only “weeks” variable ap- pear consistently not significant at the 95% confidence level. All other variables show statistical significance for at least some situations listed in the first column. “Length of crossing” (and related difference in vehicular traffic and in signal timing) appears to be a strong discriminat- ing variable. “Person categories” differences also appear important except for the case when distinction is made between the Entry Violation and Exit Variation propor- tions only. “Time of day” is the third significant variable. Chi-square analysis shows that there is a statistically significant difference in crossing behavior related to those three variables when they are analyzed separately. The next research question is how significant would those variables be if analyzed jointly. Analysis of va- riance (ANOVA) is a suitable statistical technique for this type of analysis. 5.5. Analysis of Variance (ANOVA) Analysis of variance (ANOVA) analysis was performed on the new six categories. This test was performed to evaluate whether the differences in violation proportions between different categories are statistically significant when analyzed together with the following variables: the type of crossing, weeks, day of the week, and time of the day. All possible 2-way ANOVA calculations were per- formed separately for the Entry Violation and Exit Viola- tion cases. Results of analysis of variance for the Entry and Exit Violations are presented in a summary way in Table 3 and Table 4, respectively. Differences in proportions that are significant at the 95% level of confidence are labeled Table 2. Summary of chi-square analysis results. Proportion scenarios 1F 2F 3F 4F 5F VN/VNE/VXE S S N S S VN/VNE S S N S S VN/VXE S S N N S VNE/VXE N S N N S NV = non-violation proportion; ENV = entry violation proportion; EXV = exit violation proportion; F1 = pedestrian categories; F2 = crossing length; F3 = week s; F4 = days; F5 = peak/off-peak; S = signif ican t at 5% level; N = not significant at 5% level. Table 3. Entry violation ANOVA significance summary. srotcaF 1F 2F 3F 4F 5F 1F N S N N 2F S N N N 3F N N N N 4F N N N N 5F N N N N F1 = pedestrian cate gories ; F2 = crossing length; F3 = weeks; F4 = days; F5 = peak/off-peak; S = significant at 5% level; N = not significant at 5% level. Table 4. Exit violation ANOVA significance summary. srotcaF 1F 2F 3F 4F 5F 1F N S S S 2F S S N N 3F N N N N 4F N N N N 5F N N N N F1 = pedestrian cate gories ; F2 = crossing length; F3 = weeks; F4 = days; F5 = peak/off-peak; S = significant at 5% level; N = not significant at 5% level. S and those not significant are labeled N. The main conclusions from the results summarized in Tables 3 and 4 are as follows: • Two variables show explanatory power to explain differences in proportions of the Entry Violation be- havior (entering illegally). Variable “categories” are significant when analyzed together with variable “weeks”; and type of crossing is significant only if analyzed together with variable “categories”. This result would imply that Entry Violation happens rela- tively independently of the other variables analyzed. • Exit Violation behavior is quite different than the Entry Violation behavior. The “category” variable is significant when analyzed together with variables: “weeks”, “peak/off peak” and “days” variables (but only when recorded on the short crossing). The “crossing” variable is significant when analyzed to- gether with the “category” and “weeks” variables; • Three remaining variables: weeks, days, time-of-day do not show explanatory power if analyzed with other variables. This result sugges ts that pedestr ian cro ssing behavior is quite consistent over time. 5.6. Impact of PCS on Walking Speed Some studies indicated that PCS systems may be able to make pedestrians to adjust their speed of crossing to avoid the dangerous Exit Violation. Equation (4) identi-  J. SUPERNAK ET AL. Copyright © 2013 SciRes. OJCE 44 fies those pedestrians who committed Entry Violation (entered on FDW) and were heading for the Exit Viola- tion if their speed was not adjusted (increased). Out of 5402 pedestrians studied, 1084 of them (252 on Broadway and 832 on the Second Avenue) were those who committed the Entry Violation and were on track to also commit the Exit Violation. One hundred and fifty two (152) out of the 252 pede- strians (60.3%) who made a long crossing across Broad- way (high volume of auto traffic), and started late enough to potentially commit Exit Violation, had in- creased their speed by observing PCS display and com- pleted their crossing in time before the steady DW indi- cation. Potential for speed adjustment was also studied for the pedestrians on short crossing (Second Avenue). But in that case, only 77 pedestrians out of 832 (9.3%) who committed Entry Violation were able to effectively adjust their speed to avoid Exit Violation and finish their cross- ing on time. Two reasons were likely responsible for that: 1) light vehicular traffic that made the short crossing ep- isode look safe even if it is illegal, and 2) problematic signal design that offered a very short crossing time for pedestrians who entered on the Flashing Don’t Walk or even late on the Steady Walk phase. 5.7. Impacts of Other Fa ctors 5.7.1. Effect of Vehicular Traffic Pedestrian behavior is naturally affected by the vehicular traffic density. High vo lume of veh icular traffic may lead into dangerous pedestrian-vehicle conflicts, and reason- able pedestrians would try to avoid them. This may be one of the reasons why pedestrians were committing Exit Violation on the short Second Avenue crossing more frequently than on the long and busy Broadway crossing . Videotape analysis clearly revealed that auto traffic was much more intense on Broadway than on the Second Avenue. Gaps between consecutive cars were short on Broadway, potentially discouraging pedestrians from making risky crossing decisions. But on the Second Ave- nue, auto traffic was very light with much larger gaps between consecutive automobiles. Cars were counted on the Second Avenue to determine time gaps between them during the pedestria n FDW and DW phases, and revealed that 41% of auto gaps there were longer than 8 seconds. This means that almost every second cycle had zero cars interfering with the pedestrians on that short crossing. 5.7.2. Enforcement Issue During the three weeks of the videotaping, there was no indication of any enforcement action against those who jaywalked. Lack of enforcement may have been a con- tributing factor to the magnitude of crossing violations at the study intersection. 5.7.3. Pl atooning Some pedestrian crossing violations may be caused by platooning. When a large group of pedestrian is trying to cross, some pedestrians may actually block other pede- strians, delay them and potentially contribute to their crossing violations. However, no episode of pedestrian platoon-related delay was observed on either Broadway or Second Avenue crossing. 6. Summary of Findings 1) Pedestrian Countdown Signals (PCS) appear effec- tive in reducing exit violations where there is a long crossing with a long Flashing Don’t Walk phase count- down (the Broadway case in this study). In case of short crossing with a short FDW phase, they appear to be ra- ther ineffective (the Second Avenue case in this study). Auto traffic may also effect the violations among pede- strians: for the higher volume auto traffic on the long crossing fewer violations were recorded as compared to lighter traffic on the short crossing. 2) The exit violations proportions are greatly reduced on the long crossing over a major arterial (Broadway). This reduction is much smaller on the short crossing over a street with a low traffic volume (Second Avenue). 3) PCS system is proved to influence speed adjustment of pedestrians who can effectively avoid the consequen- tial exit violation; this is primarily observed on the long crossing where 2/3 of pedestrians heading for the exit violation are effectively able to avoid it and exit the in- tersection timely. 4) Pedestrian population is heterogeneous in term of its intersection crossing behavior, and proper market segmentation appears useful in understanding differences in violation frequencies among various groups of pede- strians. In downtown San Diego, the groups with the highest crossing violation rates are runners and bicyclists as well as older males. 5) Pedestrian violations are more frequent during the rush hours than outside that period but this difference is not statistically significant. Pedestrian intersection cross- ing behavior is consistent from day to day and from week to week. 6) Pedestrian behavior is affected by multiple factors such as composition of the population, intersection geo- metry, traffic intensity and signal design. In order to properly capture those various effects, multivariate ana- lysis is useful. 7) Analysis based on videotaping and detailed coding of the relevant elements of the intersection crossing of every individual is a tedious but effective procedure to better understand subtleties of pedestrian intersection crossing behavi or. 8) More studies of the same kind would be needed to verify validity of those findings at some other sites, par-  J. SUPERNAK ET AL. Copyright © 2013 SciRes. OJCE 45 ticularly at locations with higher percentage of such groups like: children and adolescents or elderly and han- dicapped pedestrians. REFERENCES [1] F. Markovitz, S. Sciortino, J. Fleck and B. Yee, “Pedes- trian Countdown Signals: Experience with an Extensive Pilot Installation,” ITE Journal, 2006. [2] J. Leonard, M. Juckes and B. Clement, “Safety & Behav- ior: Behavioral Evaluation of Pedestrians and Motorists towards Pedestrian Countdown Signals, Report by Des- sau-Soprin Inc. for the City of Monterey, California,” 1999. [3] S. S. Pulugurtha and S. S. Nambisan, “Effectiveness of Pedestrian CountdowAZSn Timers to Enhance Safety in Las Vegas,” Institute of Transportation Engineers District 6 Annual Meeting, Sacramento, June 2004. [4] J. L. Botha, A. A. Zaby s hny, J. E. Day , R. L. Northous e , J. O. Rodriguez and T. L. Nix, “Pedestrian Countdown Sig- nals Study in the City of San Jose: Final Report to the CaliforniaTraffic Control Devices Committee,” 2002. [5] H. Huang and C. Zeeger, “The Effect of Pedestrian Count- down Signals in Lake Buena Vi sta,” Report for the Florida Department of Transportation, 2000. [6] J. Supernak and S. Chavez, “Evaluation of Two Pedes- trian Countdown Systems at the Crosswalks in the City of San Diego,” Report for the City of San Diego, 2005. [7] W. J. Ma, Z. Z. Wu and X. G. Yang, “Empirical Analysis of Pedestrian Countdown Signals in Shanghai,” TRB 88th Annual Meeting Compendium of Papers, Washington DC, 11-15 January 2009, 11 p. [8] A. Hooper, V. Vencatachellum and M. Tse, “Trial of Pe- destrian Signals Incorporating a Numerical Countdown Display in Auckland CBD,” Presented at the IPENZ Transportation Group Conference, Tauranga, 2007. www.ipenz.org.nz/ipenztg/papers/2007/C4a_HooperVenc atTse.pdf [9] V. Verma, “Effectiveness of Countdown Pedestrian Sys- tems in Downtown San Diego,” M.S. Thesis, San Diego State University, 2012. |