

Paper Menu >>
Journal Menu >>
 Open Journal of Civil Engineering, 2013, 3, 18-25 http://dx.doi.org/10.4236/ojce.2013.33B004 Published Online September 2013 (http://www.scirp.org/journal/ojce) Copyright © 2013 SciRes. OJCE 3-D Modelling of the Confederation Bridge Using Data of Full Scale Tests Lan Lin Department of Building, Civil and Environmental Engineering, Concordia University, Montreal, Canada Email: [email protected] Received July 2013 ABSTRACT Long-span bridges are special structures that require advanced analysis techniques to examine their performance. This paper presents a procedure developed to model the Confederation Bridge using 3-D beam elements. The model was validated using the data collected before the opening of the bridge to the public. The bridge was instrumented to con- duct fullscale static and dynamic tests. The static tests were to measure the deflection of the bridge pier while the dy- namic tests to measure the free vibrations of the pier due to a sudden release of the static load. Confederation Bridge is one of the longest reinforced concrete bridges in the world. It connects the province of Prince Edward Island and the province of New Brunswick in Canada. Due to its strategic location and vital role as a transportation link between these two provinces, it was designed using higher safety factors than those for typical highway bridges. After validating the present numerical model, a procedure was developed to evaluate the performance of similar bridges subjected to traffic and seismic loads. It is of interest to note that the foundation stiffness and the modulus of elasticity of the concrete have significant effects on the structural responses of the Confederation Bridge. Keywords: 3-D Numerical Modeling; Finite Element Technique; Static Tests; Dynamic Tests; Acceleration Time History; Fourier Analysis; Full Scale Tes t; Seis mic Evalu ation; Confederation Bridge 1. Introduction The Confederation Bridge was built in June 1997 to con- nect the province of Prince Edward Island and the prov- ince of New Brunswick in Canada. The length of the bridge is 12.9 km, which makes it one of the longest re- inforced concrete bridges in the world. The bridge is lo- cated in a region known for severe and harsh environ- mental conditions. In fact, the bridge is covered by ice approximately three to four months every year; this be- side the heavy storms with winds in excess of 100 km/h, which is often experienced at the bridge site. The Confederation Bridge was designed for a lifespan of 100 years, which is twice the life span suggested by the Canadian Standard Association(CSA) [1], and the Ontario Highway Bridge Design Code (OHBDC) [2]. This is because of the strategic importance of the Con- federation Bridge to the community. A comprehensive research program was undertaken to monitor and study the behaviour of the bridge during construction and during its operation. The objective of this program was to record valuable data on the per- formance of the bridge under dynamic loads including seismic, wind, traffic, and ice loads. This paper presents a 3-D numerical model, developed to simulate the performance of the Confederation Bridge under static and dynamic loads. The data collected from the full scale tests were used to validate the model. The methodology presented in this paper can be followed for evaluation of existing condition for similar and other bridges subjected to these sever loading conditions. 2. Description of the Bridge Figure 1 presents a sketch showing the layout of the Confederation Bridge. The bridge consists of two ap- proach bridges at its ends and a main bridge between them. The approach bridge at the Prince Edward Island end (i.e., the east end) is 555 m long and has 7 piers, andhas 7 piers, and that at the New Brunswick end (i.e., the west end) is 1 275 m long and has 14 piers. The long- est span of the approach bridges is 93 m. The main bridge is 11,080 m long and has 44 piers, designated P1 to P44. Out of the 45 spans of the main bridge, 43 spans are 250 m long and the two end spans are 165 m long. The height of the columns of this part of the bridge ranges from 38 to 75 m. The cross section of the bridge girder is a single-cell trapezoidal box. The depth of the girder of the main bridge varies from 4.5 m at mid spans to 14 m at piers. The width of the bridge deck is 11 m. 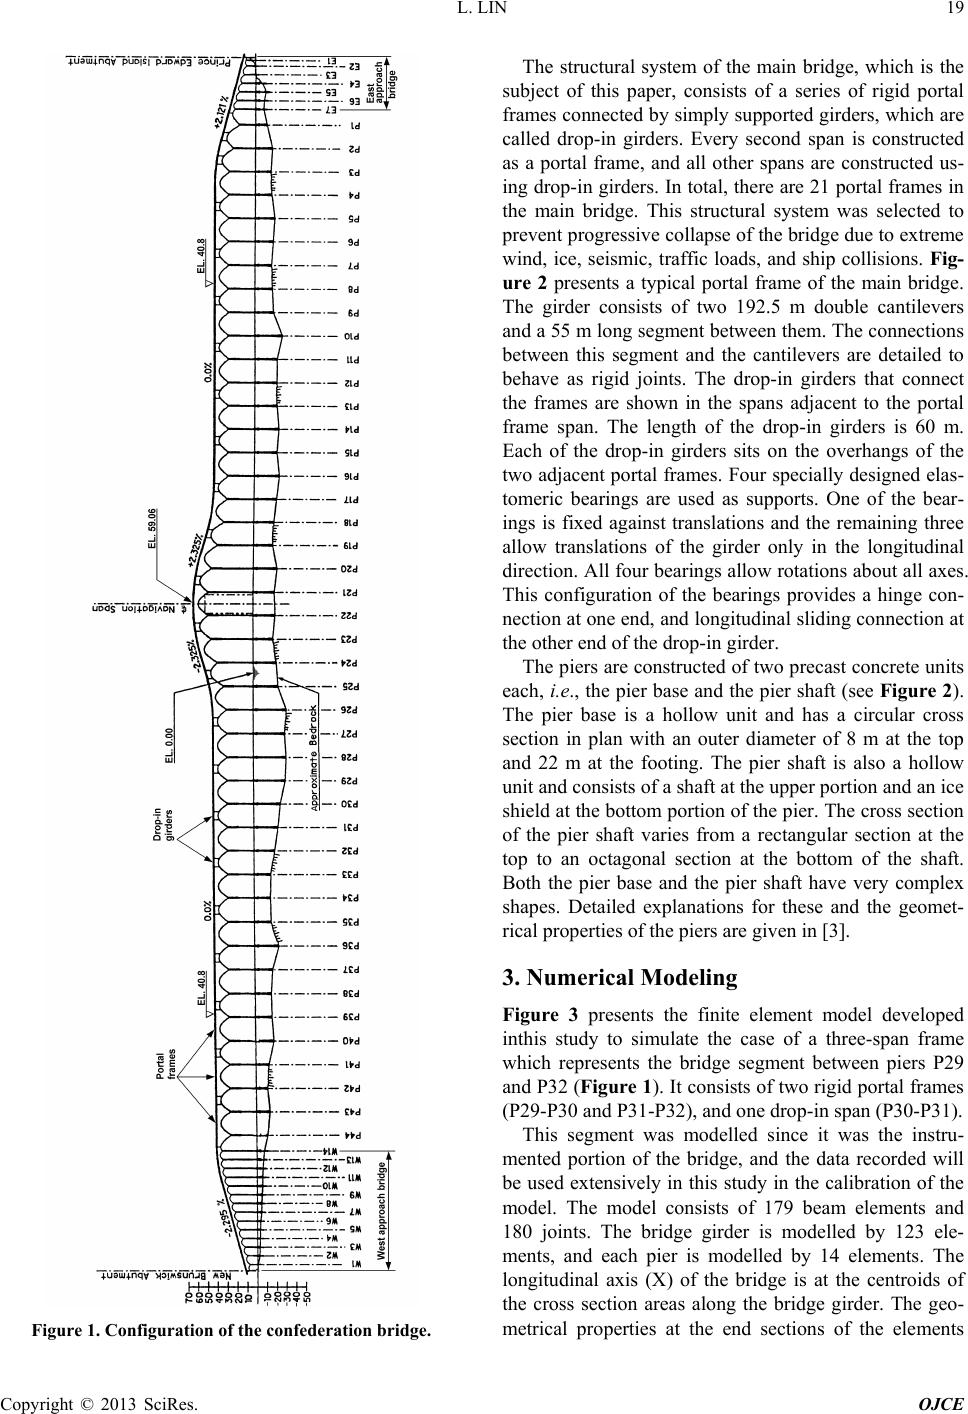 L. LIN Copyright © 2013 SciRes. OJCE 19 Figure 1. Configuration of the confederation bridge. The structural system of the main bridge, which is the subject of this paper, consists of a series of rigid portal frames connected by simply supported girders, which are called drop-in girders. Every second span is constructed as a portal frame, and all other spans are constructed us- ing drop-in girders. In total, there are 21 portal frames in the main bridge. This structural system was selected to prevent progressive collapse of the bridge due to extreme wind, ice, seismic, traffic loads, and ship collisions. Fig- ure 2 presents a typical portal frame of the main bridge. The girder consists of two 192.5 m double cantilevers and a 55 m long segment between them. The connections between this segment and the cantilevers are detailed to behave as rigid joints. The drop-in girders that connect the frames are shown in the spans adjacent to the portal frame span. The length of the drop-in girders is 60 m. Each of the drop-in girders sits on the overhangs of the two adjacent portal frames. Four specially designed elas- tomeric bearings are used as supports. One of the bear- ings is fixed against translations and the remaining three allow translations of the girder only in the longitudinal direction. All four bearings allow rotation s about all axes. This configuration of the bearings provides a hinge con- nection at one end, and longitudinal sliding connection at the other end of the drop-in girder. The piers are constructed of two precast concrete units each, i.e., the pier base and the pier shaft (see Figure 2). The pier base is a hollow unit and has a circular cross section in plan with an outer diameter of 8 m at the top and 22 m at the footing. The pier shaft is also a hollow unit and consists of a shaft at the upper portion and an ice shield at the bottom portion of the pier. The cross section of the pier shaft varies from a rectangular section at the top to an octagonal section at the bottom of the shaft. Both the pier base and the pier shaft have very complex shapes. Detailed explanations for these and the geomet- rical properties of the piers are given in [3]. 3. Numerical Modeling Figure 3 presents the finite element model developed inthis study to simulate the case of a three-span frame which represents the bridge segment between piers P29 and P32 (Figure 1). It consists of two rigid portal frames (P29-P30 and P31-P32), and one drop-in span (P30 -P31). This segment was modelled since it was the instru- mented portion of the bridge, and the data recorded will be used extensively in this study in the calibration of the model. The model consists of 179 beam elements and 180 joints. The bridge girder is modelled by 123 ele- ments, and each pier is modelled by 14 elements. The longitudinal axis (X) of the bridge is at the centroids of the cross section areas along the bridge girder. The geo- metrical properties at the end sections of the eleme nt s 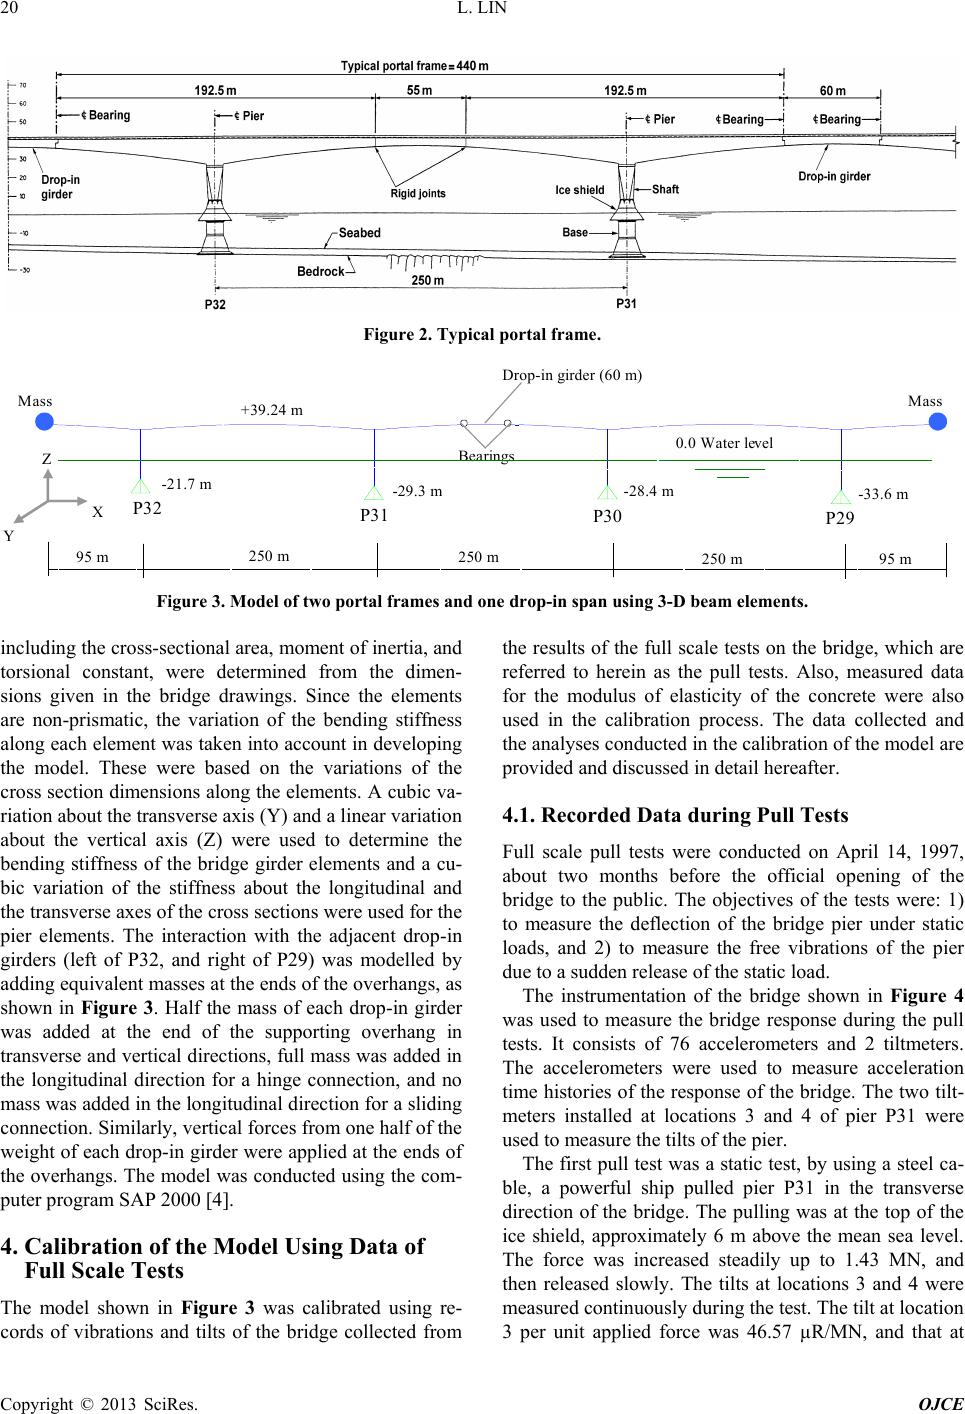 L. LIN Copyright © 2013 SciRes. OJCE 20 Figure 2. Typical portal frame. Bearin gs -21.7 m P32 -29 .3 m P31 -28.4 m P30 Drop -in girder (6 0 m) -33.6 m P29 0.0 Water level +39 .24 m 250 m 95 m 250 m 250 m 95 m Mas s X Y Z Mas s Figure 3. Model of two portal frames and one drop-in span using 3-D beam elements. including the cross-sectional area, moment of inertia, and torsional constant, were determined from the dimen- sions given in the bridge drawings. Since the elements are non-prismatic, the variation of the bending stiffness along each element was taken into account in developing the model. These were based on the variations of the cross section dimensions along the elements. A cubic va- riation about the transver s e axis (Y) and a linear variation about the vertical axis (Z) were used to determine the bending stiffness of the bridge girder elements and a cu- bic variation of the stiffness about the longitudinal and the transverse axes of the cross sections were used for the pier elements. The interaction with the adjacent drop-in girders (left of P32, and right of P29) was modelled by adding equivalent masses at the ends of the overhangs, as shown in Figure 3. Half the mass of each drop-in girder was added at the end of the supporting overhang in transverse and vertical directions, full mass was added in the longitudinal direction for a hinge connection, and no mass was added in the longitudinal direction for a sliding connection. Similarly, vertical forces from one half of the weight of each drop-in girder were applied at the ends of the overhangs. The model was conducted using the com- puter program SAP 2000 [4]. 4. Calibration of the Model Using Data of Full Scale Tests The model shown in Figure 3 was calibrated using re- cords of vibrations and tilts of the bridge collected from the results of the full scale tests on the bridge, which are referred to herein as the pull tests. Also, measured data for the modulus of elasticity of the concrete were also used in the calibration process. The data collected and the analyses conducted in the calibration of the model are provided and discussed in detail hereafter. 4.1. Recorded Data during Pull Tests Full scale pull tests were conducted on April 14, 1997, about two months before the official opening of the bridge to the public. The objectives of the tests were: 1) to measure the deflection of the bridge pier under static loads, and 2) to measure the free vibrations of the pier due to a sudden release of the static load. The instrumentation of the bridge shown in Figure 4 was used to measure the bridge response during the pull tests. It consists of 76 accelerometers and 2 tiltmeters. The accelerometers were used to measure acceleration time histories of the response of the bridge. The two tilt- meters installed at locations 3 and 4 of pier P31 were used to measure the tilts of the pier. The first pull test was a static test, by using a steel ca- ble, a powerful ship pulled pier P31 in the transverse direction of the bridge. The pulling was at the top of the ice shield, approximately 6 m above the mean sea level. The force was increased steadily up to 1.43 MN, and then released slowly. The tilts at locations 3 and 4 were measured continuously dur ing the test. T he tilt at location 3 per unit applied force was 46.57 µR/MN, and that at 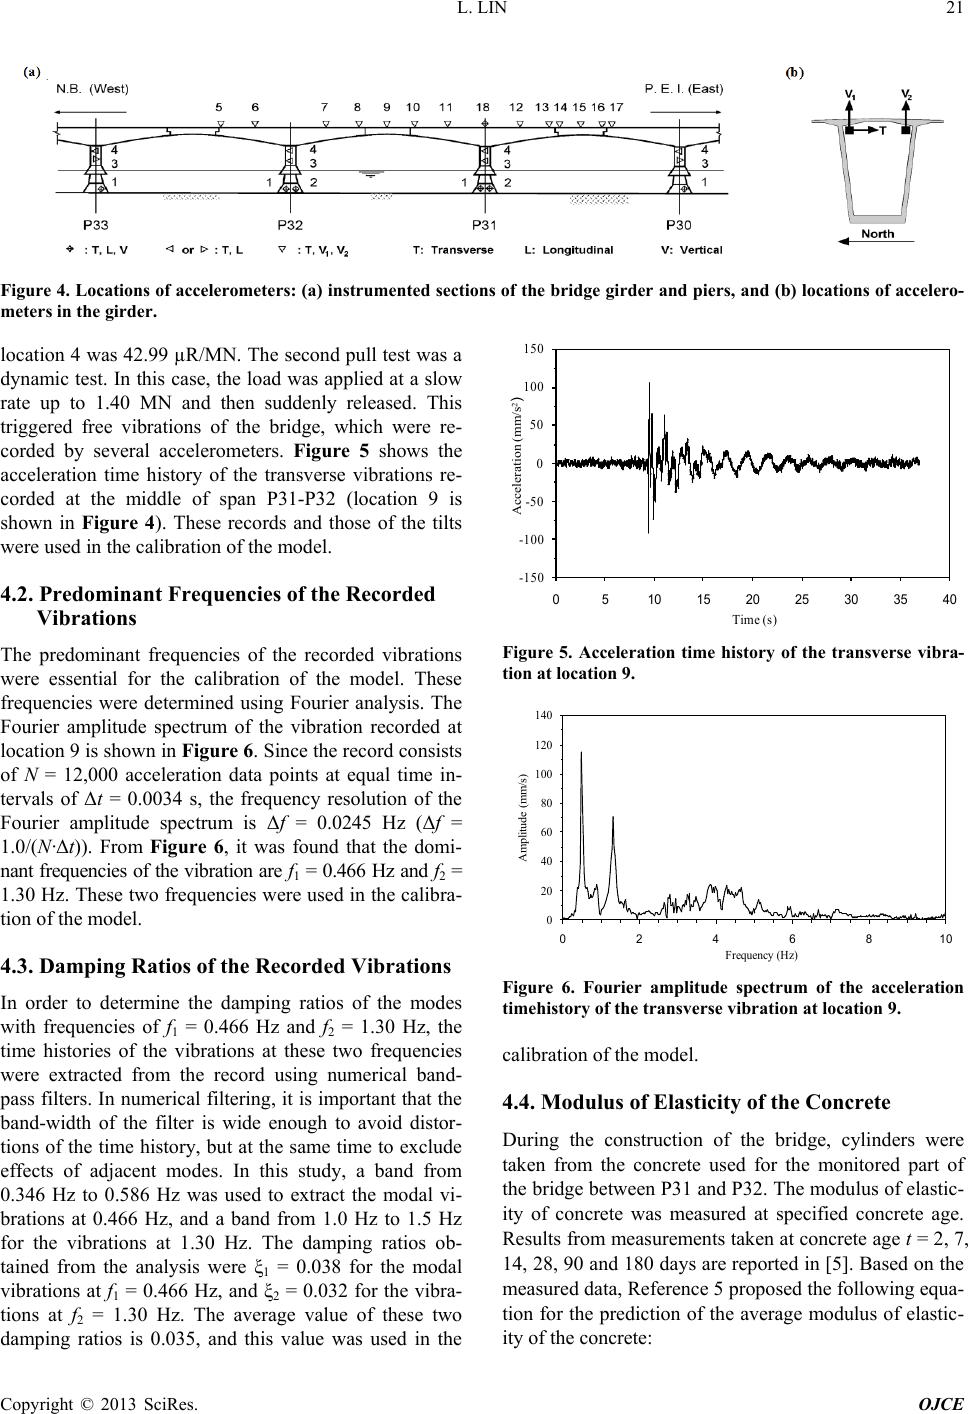 L. LIN Copyright © 2013 SciRes. OJCE 21 Figure 4. Locations of accelerometers: (a) instrumented sections of the bridge girder and piers, and (b) locations of accelero- meters in the girder. location 4 was 42.99 µR/MN. The second pull test was a dynamic test. In this case, the load was applied at a slow rate up to 1.40 MN and then suddenly released. This triggered free vibrations of the bridge, which were re- corded by several accelerometers. Figure 5 shows the acceleration time history of the transverse vibrations re- corded at the middle of span P31-P32 (location 9 is shown in Figure 4). These records and those of the tilts were used in the calibration of the model. 4.2. Predominant Frequencies of the Recorded Vibrations The predominant frequencies of the recorded vibrations were essential for the calibration of the model. These frequencies were determined using Fourier analysis. The Fourier amplitude spectrum of the vibration recorded at location 9 is shown in Figure 6. Since the record consists of N = 12,000 acceleration data points at equal time in- tervals of Δt = 0.0034 s, the frequency resolution of the Fourier amplitude spectrum is Δf = 0.0245 Hz (Δf = 1.0/(N·Δt)). From Figure 6, it was found that the domi- nant f requencies of the vibrat ion are f1 = 0.466 Hz and f2 = 1.30 Hz. These two frequencies were used in the calibra- tion of the model. 4.3. Damping Ratios of the Recorded Vibrations In order to determine the damping ratios of the modes with frequencies of f1 = 0.466 Hz and f2 = 1.30 Hz, the time histories of the vibrations at these two frequencies were extracted from the record using numerical band- pass filters. In numerical filtering, it is important that the band-width of the filter is wide enough to avoid distor- tions of the time history, but at the same time to exclude effects of adjacent modes. In this study, a band from 0.346 Hz to 0.586 Hz was used to extract the modal vi- brations at 0.466 Hz, and a band from 1.0 Hz to 1.5 Hz for the vibrations at 1.30 Hz. The damping ratios ob- tained from the analysis were ξ1 = 0.038 for the modal vibrations at f1 = 0.466 Hz, and ξ2 = 0.032 for the vibra- tions at f2 = 1.30 Hz. The average value of these two damping ratios is 0.035, and this value was used in the -150 -100 -50 0 50 100 150 05 10 15 20 25 30 35 40 Acceleration (mm /s 2 ) Time (s) Figure 5. Acceleration time history of the transverse vibra- tion at location 9. 0 20 40 60 80 100 120 140 0246810 Amplitude (mm/s) Frequency (Hz) Figure 6. Fourier amplitude spectrum of the acceleration timehistory of the transverse vibration at location 9. calibration of the model. 4.4. Modulus of Elasticity of the Concrete During the construction of the bridge, cylinders were taken from the concrete used for the monitored part of the bridge between P31 and P32. The modulus of elastic- ity of concrete was measured at specified concrete age. Results from measurements taken at concrete age t = 2, 7, 14, 28, 90 and 180 days are reported in [5]. Based on the measured data, Reference 5 proposed the following equa- tion for the prediction of the average modulus of elastic- ity of the concrete:  L. LIN Copyright © 2013 SciRes. OJCE 22 Ec(t) = Ec(28){exp[s(1 - (28/t)1/2)]}1/2 (1) in which Ec(t) is the elastic modulus at age t, Ec(28) = 38.7 GPa is the average elastic modulus at age t = 28 days, and s = 0.25 is a coefficient for normal hardening cement assumed for the concrete used in the bridge. 4.5. Calibration of the Model The calibration was conducted using the model shown in Figure 3. Since the calibration was based on the meas- ured data during the pull tests, it was important that the masses of the bridge model correspond to those of the bridge during the pull tests. As reported by [6], the barri- ers and the pavement had not yet been in place at the time of the pull tests. Therefore these masses were not included in the calibration of the model. Given the avai- lable data described in Sections 4.1 to 4.4, the following parameters were used as reference parameters in the ca- libration of the model: • Tilts at locations 3 and 4 of pier P31 recorded during the static pull test, • Acceleration time history of the transverse vibrations at location 9 (Figure 5) recorded during the dynamic pull test, • Predominant frequencies of the recorded vibrations at locati on 9, • Damping ratios of the predominant modes of the re- corded vi br a t ions, and • Modulus of elasticity of the concrete of 40,000 MPa corresponding to the age of the concrete at the time when the pull tests were conducted. It was determined by using Equation 1. The parameter that was varied in the calibration of the model was the foundation stiffness. While the soil under the foundations of the piers is designated “rock” in the design drawings, it is believed that they may have certain soil-structure interaction effects, which is appropriate to consider them in analyzing the dynamic behaviour of the bridge. Rotational springs (at the bases of the piers) in the longitudinal and transverse directions were intro- duced in the model to represent the foundation stiffness. The calibration consisted of iterative performing the fol- lowing sequence of tasks: 1) The selection (in the first iteration), or the adjust- ment (in the subsequent iterations) of the rotation al stiff- ness of the springs; 2) Static analysis of the model by applying a horizon- tal force of 1 MN to pier P31, 6 m above the mean sea level, in the transverse direction of the model; 3) Using the results from 2), the tilts at locations 3 and 4 of pier P31 were computed, and compared with the values measured during the static pull test; 4) Time-history analysis of the model by applying a loading representative of that used in the dynamic pull test. The loading was applied to pier P31, 6 m above the mean sea level, in the transverse direction of the model; 5) Fourier analysis of the response time history of the model at location 9 to compute the Fourier amplitude spectrum. This spectrum was compared with that of the vibrations recorded at location 9 during the dynamic pull test (Figure 6). It should be mentioned herein that in case of differ- ences between the computed and measured tilts in task 3) of a given iteration were larger than those in the previous iteration, then tasks 4) and 5) were not proceeded, and a new itera t ion was undertake n. 4.5.1. C om parison of Tilts Results for the tilts of selected iterations of the calibra- tion process are given in Table 1. The table shows the rotational stiffness used in the iterations and the corre- sponding tilts at locations 3 and 4 resulted from the static analysis of applying a horizontal force of 1 MN to pier P31, 6 m above the mean sea level. For comparison, the tilts measured during the static pull test are also given in the table. It can be noted that the stiffness of the founda- tion between 3.35 MN·m/µR and 4.45 MN·m/µR pro- vides tilts that are quite close to the measured tilts. The differences between the computed and the measured tilts were less than 3%. Tabl e 1 also sho ws t hat the computed tilts corresponding to fixed-base conditions are signifi- cantly smaller than the measured values. This was ex- pected since the bridge structure with rigid bases is stiffer than that with flexible bases. 4.5.2. Time-History Analysis of the Model For each of the foundation stiffness considered in the calibration process, a time-history analysis was con- ducted to compute the response time histories of the mo- del. The load was assumed to increase linearly from 0 to 1.4 MN in 15 s, and then it was kept constant for 10 s, Table 1. Foundation stiffness used in selected iterations and computed tilts at locations 3 and 4. Foundation stiffness (MN·m/μR) Computed tilts (in μR) and differences (in %) between computed and measured values Location 3 Difference Location 4 Difference ∞(Fixed-bases) 34.78 −19.1(1) 38.15 −18.1 5.05 40.71 −5.3 44.72 −4.0 4.45 41.70 −3.0 45.54 −2.0 4.05 42.29 −1.6 46.36 -0.5 3.35 43.77 +1.8 48.00 +3.0 2.65 46.34 +7.8 50.67 +8.8 Measured values 42.99 46.59 (1)Difference wi th negat ive sig n indicates t hat the co mputed v alue is small er than the measured value.  L. LIN Copyright © 2013 SciRes. OJCE 23 and then was decreased linearly to zero in 0.13 s. The load was applied to pier P31, 6 m above the mean sea level, in the transverse direction of the model. The time -history analysis was conducted using a modal damping of 3.5%. A time interval of integration of 0.005 s was used in the time-history analysis. Note that the loading used in the analysis was representative of that applied load during the dynamic pull tests. Figure 7 shows the computed acceleration time history of the re- sponse of the bridge girder at location 9. Comparing this time history with the recorded vibrations (Figure 5), it can be noted that the computed response was in a good agreement with the measured response. 4.5.3. C om parison of F ou r i er Amplitude Spe c tra For each of the foundation stiffness, Fourier amplitude spectrum was computed for the acceleration time history of the transverse response at location 9 obtained from the dynamic analysis. This spectrum was compared with the spectrum of the measured vibrations (Figure 5). It was found that the foundation stiffness of 3.35 MN·m/µR provided satisfactory match of the predominant frequen- cies of the computed and measured responses at location 9. Figure 8 shows the Fourier amplitude spectrum of the -150 -100 -50 0 50 100 150 0510 15 20 25 30 35 40 A ccelerat ion. (mm/s 2 ) Time (s) Figure 7. Computed acceleration time history of the trans- verse response at location 9. 0 20 40 60 80 100 120 140 012345678910 A mpl i tude ( mm/s) Fr equency (Hz) Figure 8. Fourier amplitude spectrum of the acceleration time history of the transverse response at location 9. computed response for found ations tiffness of 3.35 MN·m/µR. It can be seen that this spectrum is quite close to that of the measured vibrations (Figure 6). The first two predominant frequencies of the computed response are fr1 = 0.513 Hz and fr2 = 1.277 Hz, which are very close to the corresponding predominant frequencies of f1 = 0.466 Hz and f2 = 1.30 Hz of the measured vibration. Based on the analyses of the Fourier amplitude spectra and those of the tilts, the foundation stiffness of 3.35 MN·m/µR was adopted to represent the foundation con- ditions of the bridge. This value was used in the further analyses in this study. 4.6. Dynamics Characteristics of the Evaluation Model An evaluation model was developed in this study using the results from the calibration process. In this model, a foundation stiffness of 3.35 MN· m/µR was incorp orated, and a modulus of elasticity of the concrete of 40,000 MPa was used. Also the masses of the barriers and the pavement were included also in the model. Table 2 shows the natural periods of the first ten modes obtained from dynamic analysis of the model. For illustration, the vibrations of th e first five modes are pre- sented in Figure 9. It can be noted that all the five modes represent transverse vibrations. In the study it was found that the vibrations of one of the rigid frames are domi- nant in the majority of the modes. For example, the vi- brations of frame P29-P30 are dominant in the 1st, 4th and 5th modes (See Figure 9). This is due to the fact that the connection between the frames is relatively week, and each frame may vibrate independently at its own fre- quency. Detailed discussion on the dynamic characteris- tics of the evaluation model is given in [7]. It is neces- sary to report here in that a similar model was developed by Lau et al. [8] using the computer program COSMOS [9]. The natural periods and mode shapes of that model are very close to those of the model developed in this study. It is useful to mention that certain variations of the dynamic properties of the model are expected due to dif- ferent effects. For example, the modulus of elasticity increases with the age of concrete and varies due to tem- perature changes. Also, the responses used in the calibra- tion of the model are substantially smaller than those from expected seismic motions at the bridge location. A comprehensive inv estigation of the possible variations of the dynamic properties due to the foregoing effects con- ducted by [7] showed that these variations are insignifi- cant from the practical point of view, therefore, the model developed as described above is considered ap- propriate for the evaluation of the bridge under seismic loads. The results from a comprehensive seismic analysis of the bridge are given in [7].  L. LIN Copyright © 2013 SciRes. OJCE 24 Table 2. Natural periods of the first 10 modes of the bridge model. Mode No. Period (s) Mode type 1 3.13 Trensverse 2 2.99 Trensverse 3 2.72 Trensverse 4 2.48 Trensverse 5 2.22 Trensverse 6 2.13 Longitudinal 7 2.08 Trensverse 8 2.01 Longitudinal 9 1.54 Vertical 10 1.43 Vertical Figure 9. Mode shapes of the bridge model. Figure 9. Mod e shape s of the bridge model. 5. Conclusions 3-D numerical model was developed using the beam elements to simulate one of the longest reinforced con- crete bridges in the world under dynamic loading. The model was validated using the results of full scale static and dynamic tests conducted on Confederation Bridge connecting the province of Prince Edward Island and the New Brunswick in Canada. Tilts at two locations along the height of pier were measured during the static test and the acceleration time history of the deck in the transverse direction at the mid- dle span was recorded during the dynamic test. The pa- rameters used in the calibration of the numerical model include the dominant frequencies of the recorded vibra- tions, damping ratio, modulus of the elasticity of the concrete, tilts of the pier, and the rotational stiffness of the foundation. In this study it was found that the model with the damping ratio of 3.5%, modulus of elasticity of concrete of 40,000 MPa, and rotational stiffness of the foundation of 3.35 MN·m/µR provided similar tilts, ac- celeration time history, and Fourier amplitude spectra like those based on the measured data. This model has been further used for the assessment of Confederation Bridge for seismic loads. The following can be con- cluded from this study: • The damping ratio, modulus of the elasticity of con- crete, and the rotational stiffness of foundation are important parameters in developing numerical models of long-span bridges. • The modulus of the elasticity of concrete has larger effect on the natural periods of the bridge than the foundation stiffness. Therefore, a value representative the current condition of the concrete is appropriate in the evaluation of the performance of an existing bridge. • The results of the present investigation showed that the vibration of one of the rigid frames in the bridge dominating the modes has given the bridge configura- tion. This observation is valuable for modelling part or the entire bridges. The procedure presented in this paper may be used to model and evaluate the performance of a new or an ex- isting bridge subjected to dynamic loads. REFERENCES [1] CSA, “Design of Highway Bridge,” Standard CAN/CSA- S6-88, Canadian Standard Association, Rexdale, Ontario, 1988. [2] MTO, “Ontario Highway Bridge Design Code,” Ministry of Transportation of Ontario, Downsview, Ontario, 1991. [3] G. Tadros, “The Confederation Bridge: An Overview,” Canadian Journal of Civil Engineering, Vol. 24, No. 6, 2001, pp. 850-866. http://dx.doi.org/10.1139/cjce-24-6-850 [4] CSI, “SAP2000 Integrated Software for Structural Analy- sis and Design,” Computers and Structures Inc., Berkeley, California. [5] A. Ghali, M. Elbadry and S. Megally, “Two-Year Deflec- tions of the Confederation Bridge,” Canadian Journal of Civil Engineering, Vol. 27, No. 6, 2000, pp. 1139-1149. http://dx.doi.org/10.1139/l00-050 [6] T. G. Brown and K. R. Croasdale, “Confederation Bridge Ice Force Monitoring Joint Industry Project Annual Re- port-1997,” IFN Engineering Ltd., Calgary, Alberta.  L. LIN Copyright © 2013 SciRes. OJCE 25 [7] L. Lin, “Seismic Evaluation of the Confederation Bridge,” Canadian Journal of Civil Engineering, Vol. 37, No. 6 2009, pp. 821-833. http://dx.doi.org/10.1139/L10-019 [8] D. T. Lau, T. Brown, M. S. Cheung and W.C. Li, “Dy- namic Modelling and Behavior of the Confederation Bridge,” Canadian Journal of Civil Engineering, Vol. 31, No. 2, 2004, pp. 379-390. http://dx.doi.org/10.1139/l03-106 [9] SRAC, “COSMOS-Finite Element Analysis Software,” Structural Research and Analysis Corporation (SRAC), Santa Monica, California. |