

Paper Menu >>
Journal Menu >>
 Open Journal of Civil Engineering, 2013, 3, 1-7 http://dx.doi.org/10.4236/ojce.2013.33B001 Published Online September 2013 (http://www.scirp.org/journal/ojce) Copyright © 2013 SciRes. OJCE Significance Analysi s of Fl e x ur al Be h aviour of Hybrid Sandwich Panels Jauhar Fajrin, Yan Zhuge, Frank Bullen, Hao Wang Centre of Excellence in Engineering Composite (CEEFC), University of Southern Queensland Toowoomba, Toowoomba, Australia Email: [email protected] Received June 2013 ABSTRACT This paper presents the significance analysis of a new type of hybrid composite sandwich wall panel which can be manufactured as modular panelised system. Two different types of natural fibers reinforced plastics (NFRP) laminate were incorporated into the new sandwich panel as an intermediate layer. The significance analysis in this research has been carried out using analysis of variance (ANOVA). As the aim of the analysis is to select the most appropriate natu - ral fiber composites for the intermediate layer, the experiments were arranged as a single factor experiment in which 3 levels of a factor have been examined. The factor refers to the type of intermediate layer used in the sandwich panel. The result of this study shows that the incorporation of intermediate layer has significantly enhanced the load carrying capacity of the sandwich panels. Keywords: Hybrid Structure; Sandwich Panels; Significance Analysis; Natural F iber Composites; Buil ding Construction 1. Introduction Providing accommodation on a large scale at relatively affordable price has always been a challenging task not only for government but also for housing industry. There are two key factors in order to solve these two challenges. The first factor is to reduce the weight of the stru cture to maintain affordable prices. In building construction, the self-weight of a structure represents a large proportion of the total load on a structure. The reduction of self-weight of structure by adopting appropriate material results in the reduction of element cross section, size of foundation and supporting elements thereby reduce the overall cost of the housing construction. The second factor is to util- ize the panelized housing system to encourage the mass production of houses. A panelized housing system is a form of construction in which all housing components are pre-fabricated at factory and shipped to the site for erection. With this construction system, a house can be built faster than stick-built homes. In most cases, pane- lized homes can be assembled in a matter of days which means that lesser labor is needed and more homes can be built. Other advantages of panelized homes are such as the system can eliminate costing delays, less weather damage during construction and also precision engi- neered to the highest quality. In order to meet these challenges, a research project has been carried out aimed at developing a new type of hybrid composite sandwich wall panel which can be manufactured as modular panelised system. The typical sandwich panel used in building application commonly consists of metal skins and soft core. Although oriented strand board (OSB) is commonly employed for the skin of sandwich structure in structural insulated panels (SIPs), the observed shortcomings of this typical skin such as mould build-up and disintegration in the presence of flood water [1] have reduced their usage. In this study, metal based skins such as aluminium or steel are adopted. Metal skins are actually preeminent choice for their many advantages, but the price is always a concern. Consequently, reducing the thickness of the skin as much as possible is the only way to keep a competitive and reasonable overall cost. However, using thinner skins may result in the early failure of sandwich structure, such as face wrinkling or inundation. The sustainable hybrid concept offered in this research has been considered as a practical solution where an intermediate layer made from natural fibers reinforced plastics (NFRP) laminate was introduced. Natural fibers are a major renewable resource material throughout the world especially in the tropics. Statistical significance is a mathematical tool that is commonly used to determine whether the outcome of an experiment is the result of a relationship between specific factors or merely the result of chance [2]. Commonly, such concept is used in the fields in which research is conducted through experimentation. It is frequent to  J. FAJRIN ET AL. Copyright © 2013 SciRes. OJCE 2 summarize statistical comparisons by declarations of statistical significance or non -significance [2]. In a scien- tific research, a hypothesis is proposed prior to data col- lection and analyses. The statistical analysis of the data will produce a number that is statistically significant if it falls below a certain percentage called the confidence level or level of significance. Further, Reference [2] ex- plains that statistical significance is used to reject or ac- cept what is called the null hypothesis, which usually states that there is no relationsh ip between two variables. In a simple expression, statistical sign ificance means that there is a good re lat ionshi p exis ti ng bet ween two variables. This paper focuses on the significance analysis of the experimental results on the flexural behaviour of the sand- wich pane l s develope d by the authors. 2. Significance Analysis Although significance or statistical analysis is rarely found as a primary approach in composite sandwich pan- el research, it has actually been extensively used in the field of composite material research. A number of re- searches reported in the literature provide the idea of how it was applied to composite material research. A study on the significance effect of microwave curing on tensile strength of carbon fibre composites was reported by [3]. The statistical analysis employed was two-way analysis of variance (ANOVA) using statistical software SPSS 14.0. The results showed that the curing time and mi- crowave process had significant effect on the tensile strength of the carbon fibre composites. Reference [4] reported their work on the optimization of processing variables in wood-rubber composite panels manufactur- ing process. The results of experiments were statistically analysed using response surface method (RSM). The Design-Expert statistical software was employed to de- termine the significant factors that affected the properties of the composite panels. It was concluded that the den- sity and the interaction of different variables were the significant factors affecting the final properties of the boards. Reference [5] used design of experiments (DoE) to study the significance of low energy impact on modal parameters for composite beams. The experiment was designed as a 5 × 2 full factorial design. The results showed that damping ratio is more sensitive parameter for the damage detection than the natural frequency. Reference [6] reported their work on the mechanical and absorption properties of woven jute/banana hybrid com- posites. Statistical analysis using one-way ANOVA was employed to analyze the results of tensile, flexural and impact tests of various composite configurations. The results suggested that th e layering pattern had significant effect on the mechanical properties of the composites. A response surface methodology (RSM), which is a statistical design of experiment method, was employed by [7] to analyze the factors influencing deflection in sandwich panels subjected to low-velocity impact. The results revealed that the deflection increased with the increasing of height of fall the mass of impactor. The deflection was only slightly increased with the incr easing in the core thickness. It is worth to note that when a statistical test res ulted in a significant outcome it means that a finding has a chance of being true due to the relation between variables, not just really a chance occurrence. Statistical signific- ance does not always mean that the finding is important or that it has any decision-making utility, so that the re- searcher must always examine both the statistical and the practical significance of any research finding. 3. Experimental Program Before the significance analysis is performed, the flex- ural testing program will be briefly reviewed in the fol- lowing sections. 3.1. Testing Specimens The sandwich samples were cut and shaped into a span length of 450 mm and the size of 550 × 50 × 22 mm for length, width and thickness, respectively. An aluminium 5005 H34 sheet with the thickness of 0.5 mm was used as the skins for all samples. An expanded polystyrene (EPS) is used for the core of this hybrid sandwich panel. The thickness of EPS core for control level was 21 mm and 15 mm for the other two levels to maintain a constant overall thickness of 22 mm. Several types of natural fiber composites have been investigated and the two best per- formed natural fibers were employed as the intermediate layer; jute and hemp fiber composites with a thickness of 3 mm. Each level was replicated 5 times; hence the total of samples tested was 15 samples. The arrangements of the flexural test specimens are shown in Table 1. Sandwich panel specimens were manually prepared using a pressing system. All constituent parts were cut into the same length and width and glued together using structural grade adhesive. The NFCs intermediate layers were sanded-up using sanding machine to obtain uniform thickness while alu minium sheet were roughed manually using sandpaper. The EPS core was sliced using hot knife foam cutter to obtain the required thickness. When all constituents ready, they were glued and placed in the pressure system. The process of sample preparation is shown in Figure 1. 3.2. Testing Results The static flexural test was conducted in accordance with  J. FAJRIN ET AL. Copyright © 2013 SciRes. OJCE 3 the ASTM C 393-00 standard which is a standard test method for flexural properties of sandwich constructions. The testing set up is shown in Figure 2. The failure loads and deflections of specimen tested under flexural testing scheme in this experiment are listed in Table 2. For a simplicity reason, the signific- ance analysis in this paper is only made for the data of load. As it can be seen from Table 2 that the coefficient variation (CV) of the actual data ranges from 9.39 to 16.05. The CV values in this range are considered as fairly acceptable. The ratio of mean to standard deviation or CV should be of the order of 3 or more, but the value of 33% has often been stated as the permissible upper limit of CV (Patel et al., 2001). The fluctuation in the distribution of exp erimental data can be easily observed in Figure 3. It is clearly shown in the figure that each level of samples has at least one out- lier data. Removing these values, by conducting norma- lization process, will produce more consistent or less fluctuated data. For example, the failure loads of speci- men 2 in CTR and JFC samples, and specimen 4 for HFC samples are considered as an outlier, with the value of 415 N, 473 N and 734 N, respectively. The experimental data resulting from the normaliza- tion process are presented in Table 3. As it can be noticed in Table 3, the coefficient varia- tion of CTR, JFC and HFC for loads has now reduced to 3.83%, 5.17% and 8.7%, respectively. The previous CV value for each level prior to the normalization process was 15.23%, 9.39% and 11.68% for CTR, JFC and H FC, respectively. The following significance analysis will use data provided from the normalization process as listed in Table 3. Table 1. Experimental arrangements for flexural testing. Samples Code Skin Intermediate Layer Core 0.5mm 3 mm 15 mm CTR Aluminium None EPS (21 mm) JFC Aluminium Jute EPS HFC Aluminium Hemp EPS Figure 1. Sandwich panel f ab rication pr oc ess. Figure 2. Testing set up. Table 2. Failure loads deflections of specimens un der flexural test. Samples number Treatments based upon intermediate layer used CTR JFC HFC P (N) δ (mm) P (N) δ (mm) P (N) δ (mm) 1 321 11.92 414 56 628 42.24 2 415 15.4 473 62.18 579 36.37 3 307 12.18 379 45.22 524 47.04 4 293 9.89 378 56.53 481 37.86 5 302 13.2 414 64 635 35.09 Average 327.60 12.52 411.60 56.79 569.40 39.72 Stdev 49.90 2.01 38.64 7.34 66.53 4.90 CV 15.23 16.05 9.39 12.93 11.68 12.34  J. FAJRIN ET AL. Copyright © 2013 SciRes. OJCE 4 Figure 3. Dot-plot diagram for medium scale samples under flexural test. Table 3. The results of normalization process for medium scale samples. Samples number Treatments based upon intermediate layer used CTR JFC HFC P (N) δ (mm) P (N) δ (mm) P (N) δ (mm) 1 321 11.92 414 56 628 42.24 2 307 12.18 379 45.22 579 36.37 3 293 9.89 378 56.53 524 47.04 4 302 13.2 414 64 635 35.09 Average 305.75 11.80 396.25 55.44 591.50 40.19 Stdev 11.70 1.39 20.50 7.73 51.44 5.53 CV 3.83 11.75 5.17 13.94 8.70 13.76 4. Analysis of Results and Discussion The significance analysis in this research is carried out using analysis of variance (ANOVA) as described in our previous paper [8]. As the aim of the analysis is to select the most appropriate NFCs for the intermediate layer, either jute fibre composite or hemp fibre composite, the experiments were arranged as a single factor experiment in which 3 levels of a factor have been examined. The factor refers to the type of intermediate layer used in the sandwich panel and such factor was leveled as 0, 1 and 2 as required by Minitab 15 software. For the specimens discussed in this paper, level 0 was the conventional sandwich panel without intermediate layer or control level (CTR) while level 1 and 2 refer to as jute fiber composite (JFC) and hemp fiber composite (HFC), re- spectively. For the analysis purpose, the data for ANOVA are tabulated as follows in Table 4. From Table 4, some important parameters for theoret- ical calculations can be determined such as replications (n = 5), total number of samples (N = 12), and number of levels or treatments (a = 3). The results of the theoretical calculations are presented in Table 5, contains all im- portant parameter for further use to make a significance judgment. Such analysis obtained by statistical software Minitab 15 is presented in Table 6. As presented in Tables 5 and 6, the theoretical calcu- lations were in good agreement with the ANOVA results obtained by statistical software Minitab 15. It can be noted here that the mean square between treatments (85311) was few times larger than the mean square within the treatments or error mean square which was only 1068. This indicates that the treatments differ. The other way to make a significance decision is by using the F value (F0). The value of F0, as seen in Tables 5 and 6, was 79.91. Instead, the F value obtained from the F-distribution table for F(0.05;2,9) was 4.26. This value, which called as F table, was obtained by using the signi- ficance level of 95% (α = 0.05), 3 levels (a = 3) and 12  J. FAJRIN ET AL. Copyright © 2013 SciRes. OJCE 5 Table 4. Tabulated data for analysis of variance (ANOVA). Factor levels Observations Totals Averages 1 2 3 4 Level 0 (CTR) 321 307 293 302 1223 305.75 Level 1 (JFC) 414 379 378 414 1584 396.25 Level 2 (HFC) 628 579 524 635 2366 591.50 Table 5. Analysis of variance table for single-factor experimental design. Source of variations Sum of square Degrees of freedom Mean square F0 Between treatments 2 2 1 1 a treatments i i y SS y nN = = − ∑ 1a− treatments MS 0treatments E MS FMS == Error (within treatments) E T treatments SSSS SS= − Na− E MS Total 2 11 () an T ij ij SSy y… = = = − ∑∑ 1N− Table 6. The theoretical results of ANOVA for sandwich panels. Source of variations Sum of square Degrees of freedom Mean square F0 Intermediate lay e r 170621.20 2 85310.58 79.91 Error 9608.50 9 1067.61 Total 180229.70 11 samples (N = 12). Since the value of F0 (79.91) was much higher than the value of F table (4.26), the null hypothesis (H0) should be rejected, meaning that there are a significant difference in the treatment means. For this experiment, the null hypothesis was actually trying to state that the load carrying capacity of all types of tested sandwich panels (CTR, JFC and HFC) were equal. However, the statistical significance analysis showed that the average values of the three types of sandwich panels were significantly different. Since the average values or means of the JFC and HFC was higher than CTR, it can be concluded that the load carrying ca- pacity of hybrid sandwich panels is significantly higher than the conventional sandwich panels. In addition, as the confidence level used in the Minitab analysis was 95%, it means that the finding has a 95% chance of being true. Alternatively, the finding has a 5% of not being true as it was analyzed with the assumption of the probability error (α) of 0.05. A value of P, or frequently called as P-value, could also be used for drawing a conclusion. The rule is that if the P-value is less than α (0.05) which is an error tolerance level, it can be concluded that there has factor levels or treatments that have different means. It is clearly presented in Table 6 that the P-value of me- dium scale specimen was very small, which is approx- imately 0.000. A pairwise comparison between all factor levels might be conducted to support the decisions drawn from ANOVA results. There are several possible test methods for this purpose such as Dunnet’s test, Tukey’s test and Fisher’s test. The three pairwise tests were also con- ducted using Minitab 15 software and the results are dis- cussed as follows. The result of Tukey’s test for medium scale sandwich panels is presented in Table 7. The rule for making a decision is that whenever the Tukey’s confidence inter- vals contain zero number, it means that the means are not different or in other word if none of the Tukey’s confi- dent intervals equals to zero, it indicates that all of the means are different. As can be observed from Table 7, all the confidence intervals have a positive number. The comparison of level 0 to level 1 and level 2 has the value of 25.97 and 221.22 fo r the lower values and 155. 03 and 350.28 for the upper values. While for the comparison of level 0 to level 2, the lower value was 130.72 and 259.78 for the upper value. Since all the confidence intervals included only positive numbers, it can be concluded that all the treatment means differ. This sugges ts that the load carrying capacity of hybrid sandwich panels with JFC and HFC intermediate layer is significantly different with the conventional sandwich panels (CTR). The term of “significantly differ en t” h as the same meaning with “sig- nificantly higher” because the load carrying capacity of hybrid sandwich panels was higher than conventional sandwich panels. The second pairwise comparison method was the 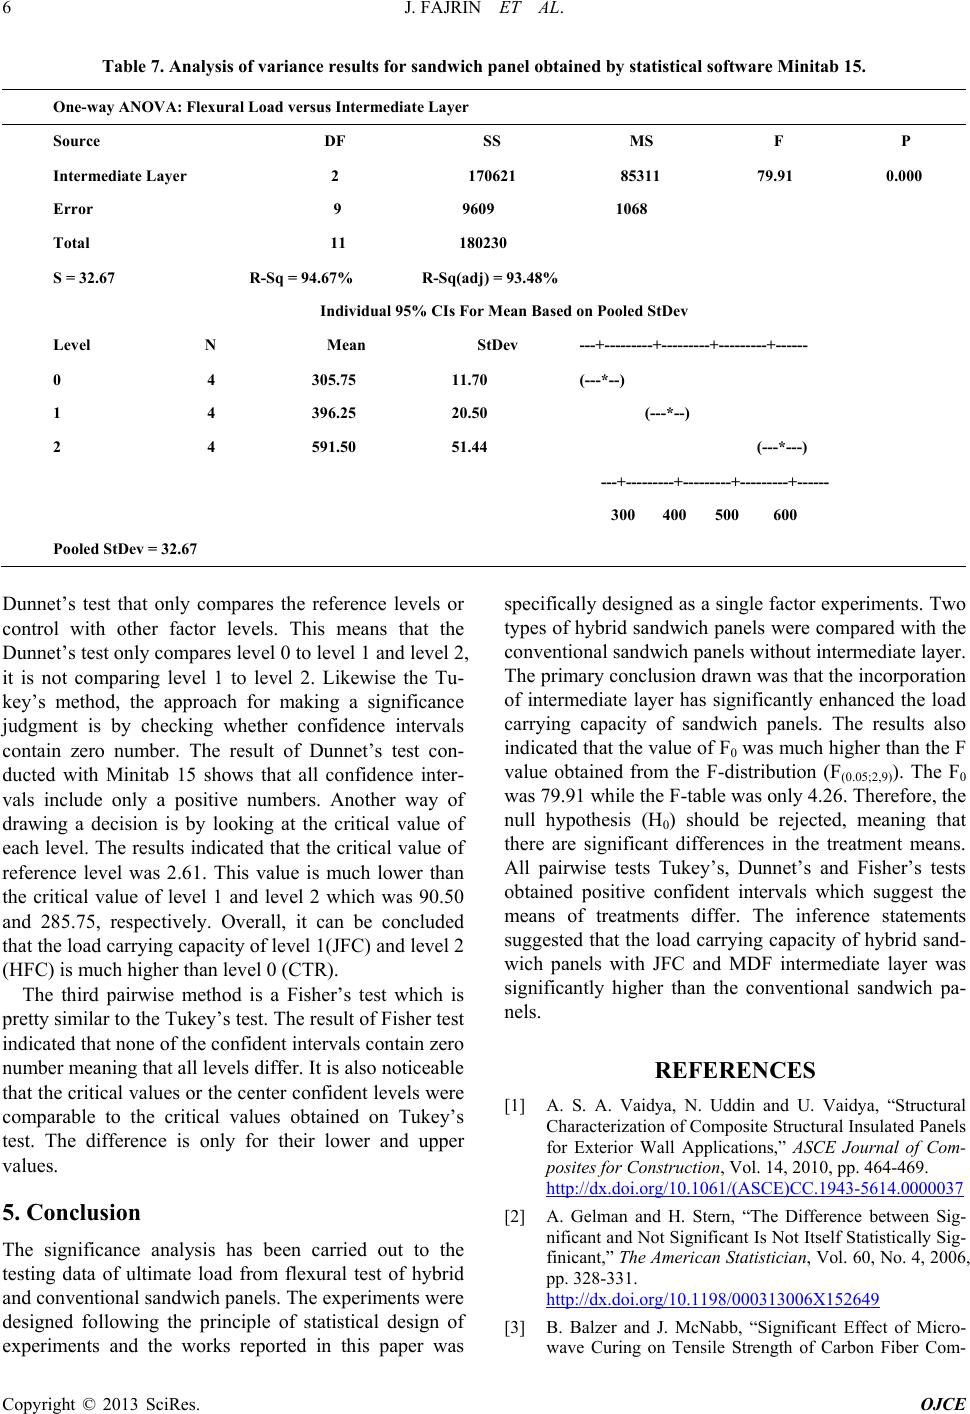 J. FAJRIN ET AL. Copyright © 2013 SciRes. OJCE 6 Table 7. Analysis of variance results for sandwich panel obtained by statistical software Minitab 15. One-way ANOVA: Flexural Load versus Intermediate Layer Source DF SS MS F P Intermediate Layer 2 170621 85311 79.91 0.000 Error 9 9609 1068 Total 11 180230 S = 32.67 R-Sq = 94.67% R-Sq(adj) = 93.48% Individual 95% CIs For Mean Based on Pooled StDev Level N Mean StDev ---+---------+---------+---------+------ 0 4 305.75 11.70 (---*--) 1 4 396.25 20.50 (---*--) 2 4 591.50 51.44 (---*---) ---+---------+---------+---------+------ 300 400 500 600 Pooled StDev = 32.67 Dunnet’s test that only compares the reference levels or control with other factor levels. This means that the Dunnet’s test only compares level 0 to level 1 and level 2, it is not comparing level 1 to level 2. Likewise the Tu- key’s method, the approach for making a significance judgment is by checking whether confidence intervals contain zero number. The result of Dunnet’s test con- ducted with Minitab 15 shows that all confidence inter- vals include only a positive numbers. Another way of drawing a decision is by looking at the critical value of each level. The results indicated that the critical value of reference level was 2.61. This value is much lower than the critical value of level 1 and level 2 which was 90.50 and 285.75, respectively. Overall, it can be concluded that the load carrying capacity of level 1(JFC) and level 2 (HFC) is much higher than level 0 (CTR). The third pairwise method is a Fisher’s test which is pretty similar to the Tukey’s test. Th e result of Fisher test indicated that none of the confident intervals contain zero number meaning that all levels differ. It is also noticeable that the critical values or th e center confident levels were comparable to the critical values obtained on Tukey’s test. The difference is only for their lower and upper values. 5. Conclusion The significance analysis has been carried out to the testing data of ultimate load from flexural test of hybrid and conventional sandwich panels. The experiments were designed following the principle of statistical design of experiments and the works reported in this paper was specifically designed as a single factor experiments. Two types of hybrid sa ndwich panels were compared with the conventional sandwich panels without intermediate layer. The primary conclusion drawn was that the incorporation of intermediate layer has significantly enhanced the load carrying capacity of sandwich panels. The results also indicated that the value of F0 was much higher than the F value obtained from the F-distribution (F(0.05;2,9)). The F0 was 79.91 while the F-table was only 4.26. Therefore, the null hypothesis (H0) should be rejected, meaning that there are significant differences in the treatment means. All pairwise tests Tukey’s, Dunnet’s and Fisher’s tests obtained positive confident intervals which suggest the means of treatments differ. The inference statements suggested that the load carrying capacity of hybrid sand- wich panels with JFC and MDF intermediate layer was significantly higher than the conventional sandwich pa- nels. REFERENCES [1] A. S. A. Vaidya, N. Uddin and U. Vaidya, “Structural Characterization of Composite Structural Insulated Panels for Exterior Wall Applications,” ASCE Journal of Com- posites for Construction, Vol. 14, 2010, pp. 464-469. http://dx.doi.org/10.1061/(ASCE)CC.1943-5614.0000037 [2] A. Gelman and H. Stern, “The Difference between Sig- nificant and Not Significant Is Not Itself Statistically Sig- finicant,” The American Statistician, Vol. 60 , No. 4, 2006, pp. 328-331. http://dx.doi.org/10.1198/000313006X152649 [3] B. Balzer and J. McNabb, “Significant Effect of Micro- wave Curing on Tensile Strength of Carbon Fiber Com-  J. FAJRIN ET AL. Copyright © 2013 SciRes. OJCE 7 posites,” Journal of Industrial Technology, Vol. 24, No. 3, 2008, pp. 2-8. [4] Z. Jun, X. Wang, J. Chang and K. Zheng, “Optimization of Processing Variables in Wood-Rubber Composite Pa- nel Manufacturing Technology,” Journal of Bioresource Technology, Elsevier, Vol. 99, No. 7, 2008, pp. 2384- 2391. http://dx.doi.org/10.1016/j.biortech.2007.05.031 [5] A. Shahdin, L. Mezeix, C. Bouver, J. Morlier and Y. Gourinat, “Fabrication and Mechanical Testing of Glass Fiber Entangled Sandwich Beams: A Comparison with Honeycomb and Foam Sandwich Beams,” Composite Structures, Elsevier, Vol. 90, No. 4, 2009, pp. 404-412. http://dx.doi.org/10.1016/j.compstruct.2009.04.003 [6] N. Venkateshwarah, A. Elayaperumal and G. K. Sathiya, “Prediction of Tensile Properties of Hybrid-Natural Fiber Composites,” Composites Part B: Engineering, Elsevier, Vol. 43, No. 2, 2012, pp. 793-796. http://dx.doi.org/10.1016/j.compositesb.2011.08.023 [7] M. Periasamy, B. Manickam and K. Hariharasubrama- niam, “Impact Properties of Aluminium—Glass Fiber Reinforced Plastics Sandwich Panels,” Materials Re- search, Vol. 15, No. 3, 2012. http://dx.doi.org/10.1590/S1516-14392012005000036 [8] J. Fajrin, Y. Zhuge, F. Bullen and H. Wang, “Flexural Strength of Sandwich Panel with Lignocellulosic Compo- sites Intermediate Layer—A Statistic Approach,” Inter- national Journal of Protective Structures, Vol. 2, No. 4, 2011, pp. 453-464. |