

Paper Menu >>
Journal Menu >>
 International Journal of Geosciences, 2013, 4, 12-17 http://dx.doi.org/10.4236/ijg.2013.45B003 Published Online September 2013 (http://www.scirp.org/journal/ijg) Copyright © 2013 SciRes. IJG Evaluation of Des er ti fic ati on Pro cesses in Seridó Region (NE Brazil) Reinaldo Antonio Petta1, Leila Vespoli de Carvalho2, Stefan Erasmi3, Charles Jones2 1Department of Geology, Federal University of Rio Grande do Norte, Brazil 2Geography Department, Uni versity California Santa Barbara 3Fakultät für Geowissenschaften und Geographie Email: pe [email protected], [email protected], [email protected] Received June 2013 ABSTRACT This paper outlines procedures to analyze the desertification processes in the semi-ar id Seridó Region (NE Brazil). Us- ing the Geosystem theory, the detection of desertification areas was based on environmental indices, digital image processing in multispectral analysis and Geographic Information System (GIS). The first step was to treat the rainfall data and NDVI satellite Modis, aiming at identifying areas which do not present vegetation cover, even during the rainy seasons. The second step was to work on a regional scale using Lan dsat ETM + images (2000-2005) and data collected in the field, as the evaluations of exposed surfaces, that together w ith MDT/SRTM-NASA and thematic maps, allowed to classify the altitude and slope of the relief, soils type, different morphologies and geology, and correlate them with the areas susceptible to desertification process. The integration of the georeferenced data, related to these indicators, allowed the identification of five differ ent levels of susceptibility to desertification (very high, high, moderate, low and very low), and the geographic domain of each class. Based on the analysis of the dynamics of the vegetation cover, we can establish that the main results refer that there is a decrease of the biomass at the region, associated with the dense caatinga vegetation areas, but more important, with the scrub and degraded areas. Keywords: Desertification; Caatinga; MODIS; Landsat; NDVI; Seridó; Brazil 1. Introduction The United Nations Conference on Environment and Development, (Rio-92), officially defined as “Desertifi- cation”, [chapter 12 of Agenda 21], as “land degradation in arid, semi-arid and dry sub-humid areas resulting from various factors, including climatic variations and human activities”. The susceptibility to desertification process according the Agenda 21 [1], affects about one third of the Earth surface (about 36 million km2), or 70% of the dry lands of the world (arid, semi-arid and dry sub-hu- mid), exc luding hy per-arid areas and deserts. Many developing countries suffer from problems such as soil degradation and destruction of natural resources, including Brazil, where the most vulnerable area is located in the NE semi-arid region. This area exceeds 900,000 km2, and a 20 million population, corresponding 44% of the Northeast and nearly 10% of the population of Brazil [2]. This region is characterized by high evapotranspira- tion, the occurrence of periods of drought, narrow soils and reduced water retention capacity, thus limiting their productive potential. All these combined elements lead to very fragile ecosystem, which is worsening mainly due to degradation of vegetation cover and mismanagement of land, due to the predatory exploitation of the particular biomass known as Caatinga, deforestation and burning. The state of Rio Grande do Norte (RN) is the 4th nor- theastern state (on eleven) with number of municipalities included in the semi-arid desertification susceptibility area. About 50% of these municipalities belong to the Seridó Region, located in the most vulnerable area to desertification, with an area of 6,836 km2 and concen- trating the largest number of inhabitants (216.500) of this region. The objective of this study is to identify and map areas of Seridó Region showing advanced process of desertification, using Remote Sensing and Geographic Information Systems (GIS) to quantify and evaluate its impacts and influences on the regional environment. 2. Characterization of the Area The region is located over a Precambrian crystalline basement and shows nucleus of desertification due to geoecological fragility, accentuated by the forms of land use, using a model of development whose economic base is not tied to environmental restrictions. Processes of environmental degradation and desertification in various stages of development are recurring, especially in spots 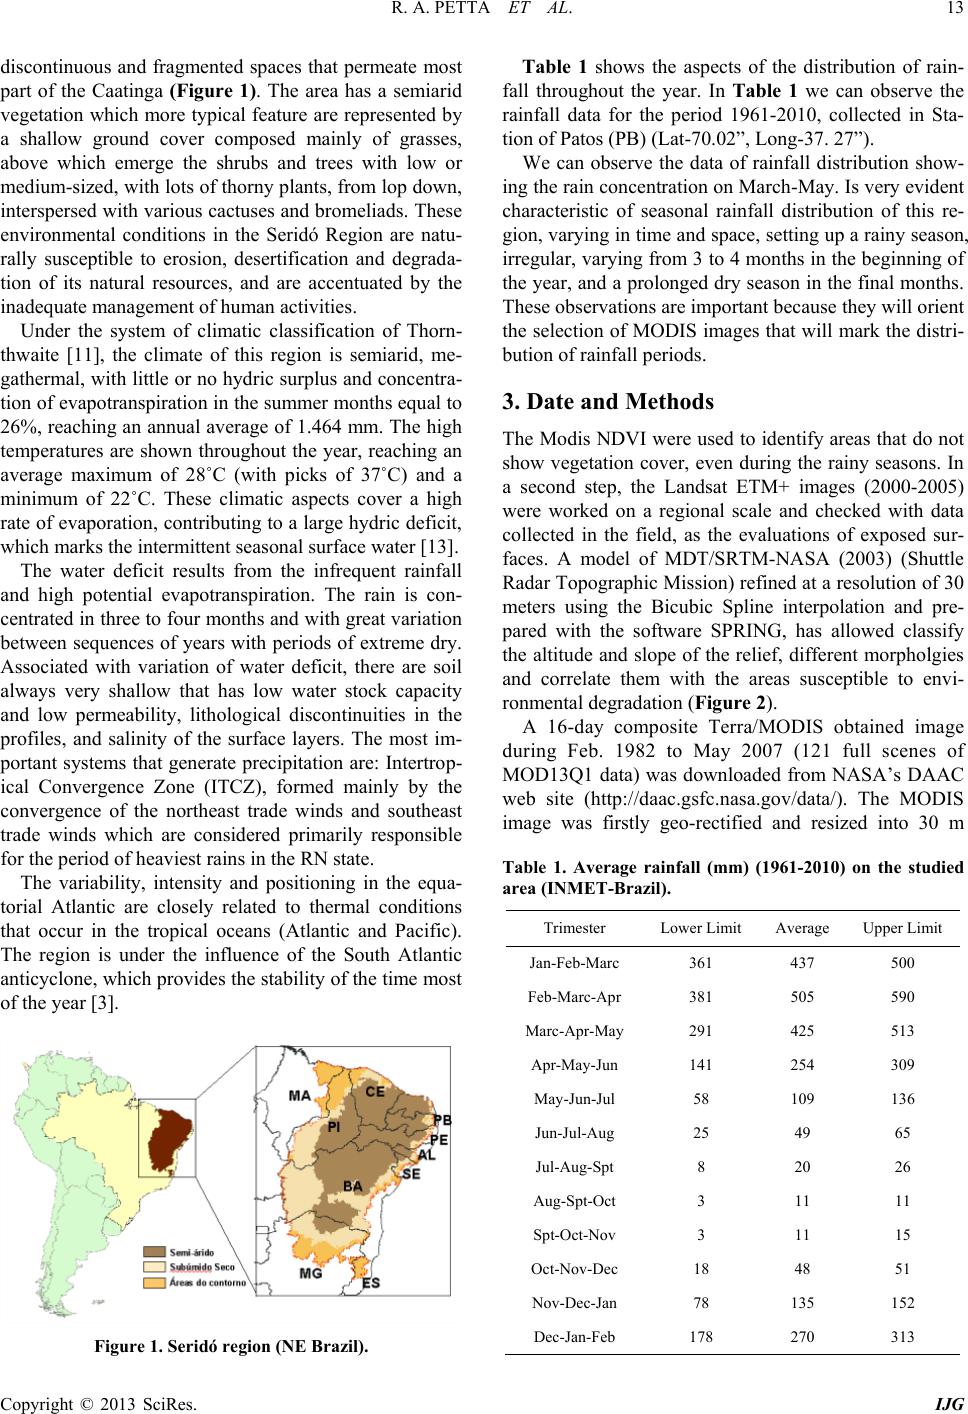 R. A. PETTA ET AL. Copyright © 2013 SciRes. IJG 13 discontinuous and fragmented spaces that permeate most part of the Caatinga (Figure 1). The area has a semiarid vegetation which more typical feature are represented by a shallow ground cover composed mainly of grasses, above which emerge the shrubs and trees with low or medium-sized, with lots of thorny plants, from lop down, interspersed with various cactuses and bromeliads. These environmental conditions in the Seridó Region are natu- rally susceptible to erosion, desertification and degrada- tion of its natural resources, and are accentuated by the inadequate management of human activities. Under the system of climatic classification of Thorn- thwaite [11], the climate of this region is semiarid, me- gathermal, with little or no hydric surplus and concentra- tion of evapotranspiration in the summer months equal to 26%, reaching an annual average of 1.464 mm. The high temperatures are shown throughout the year, reaching an average maximum of 28˚C (with picks of 37˚C) and a minimum of 22˚C. These climatic aspects cover a high rate of evaporation, contributing to a large hydric deficit, which marks the intermittent seasonal surface water [13]. The water deficit results from the infrequent rainfall and high potential evapotranspiration. The rain is con- centrated in three to four months and with great variation between sequences of years with periods of extreme dry. Associated with variation of water deficit, there are soil always very shallow that has low water stock capacity and low permeability, lithological discontinuities in the profiles, and salinity of the surface layers. The most im- portant systems that generate precipitation are: Intertrop- ical Convergence Zone (ITCZ), formed mainly by the convergence of the northeast trade winds and southeast trade winds which are considered primarily responsible for the period of heaviest rains in the RN state. The variability, intensity and positioning in the equa- torial Atlantic are closely related to thermal conditions that occur in the tropical oceans (Atlantic and Pacific). The region is under the influence of the South Atlantic anticyclone, which provides the stability of the time most of the year [3]. Figure 1. Seridó region (NE Brazil). Table 1 shows the aspects of the distribution of rain- fall throughout the year. In Table 1 we can observe the rainfall data for the period 1961-2010, collected in Sta- tion of Patos (PB) (Lat-70.02”, Long-37. 27”). We can observe the data of rainfall distribution show- ing the rain concentration on March-May. Is very evident characteristic of seasonal rainfall distribution of this re- gion, varying in time and sp ace, setting up a rainy se ason, irregular, varying from 3 to 4 months in the beginning of the year, and a prolonged dry season in the final months. These observations are important because they will orient the selection of MODIS images that will mark the distr i- bution of rainfall periods. 3. Date and Methods The Modis NDVI were used to identify areas that do not show vegetation cover, even during the rainy seasons. In a second step, the Landsat ETM+ images (2000-2005) were worked on a regional scale and checked with data collected in the field, as the evaluations of exposed sur- faces. A model of MDT/SRTM-NASA (2003) (Shuttle Radar Topographic Mission) refined at a resolution of 30 meters using the Bicubic Spline interpolation and pre- pared with the software SPRING, has allowed classify the altitude and slope of the relief, different morpholgies and correlate them with the areas susceptible to envi- ronmental degradation (Figure 2). A 16-day composite Terra/MODIS obtained image during Feb. 1982 to May 2007 (121 full scenes of MOD13Q1 data) was downloaded from NASA’s DAAC web site (http://daac.gsfc.nasa.gov/data/). The MODIS image was firstly geo-rectified and resized into 30 m Table 1. Average rainfall (mm) (1961-2010) on the studied area (INMET-Brazil). Trimester Lower Limit Average Upper Limit Jan-Feb-Marc 361 437 500 Feb-Marc-Apr 381 505 590 Marc-Apr-May 291 425 513 Apr-May-Jun 141 254 309 May-Jun-Jul 58 109 136 Jun-Jul-Aug 25 49 65 Jul-Aug-Spt 8 20 26 Aug-Spt-Oct 3 11 11 Spt-Oct-Nov 3 11 15 Oct-Nov-Dec 18 48 51 Nov-Dec-Jan 78 135 152 Dec-Jan-Feb 178 270 313 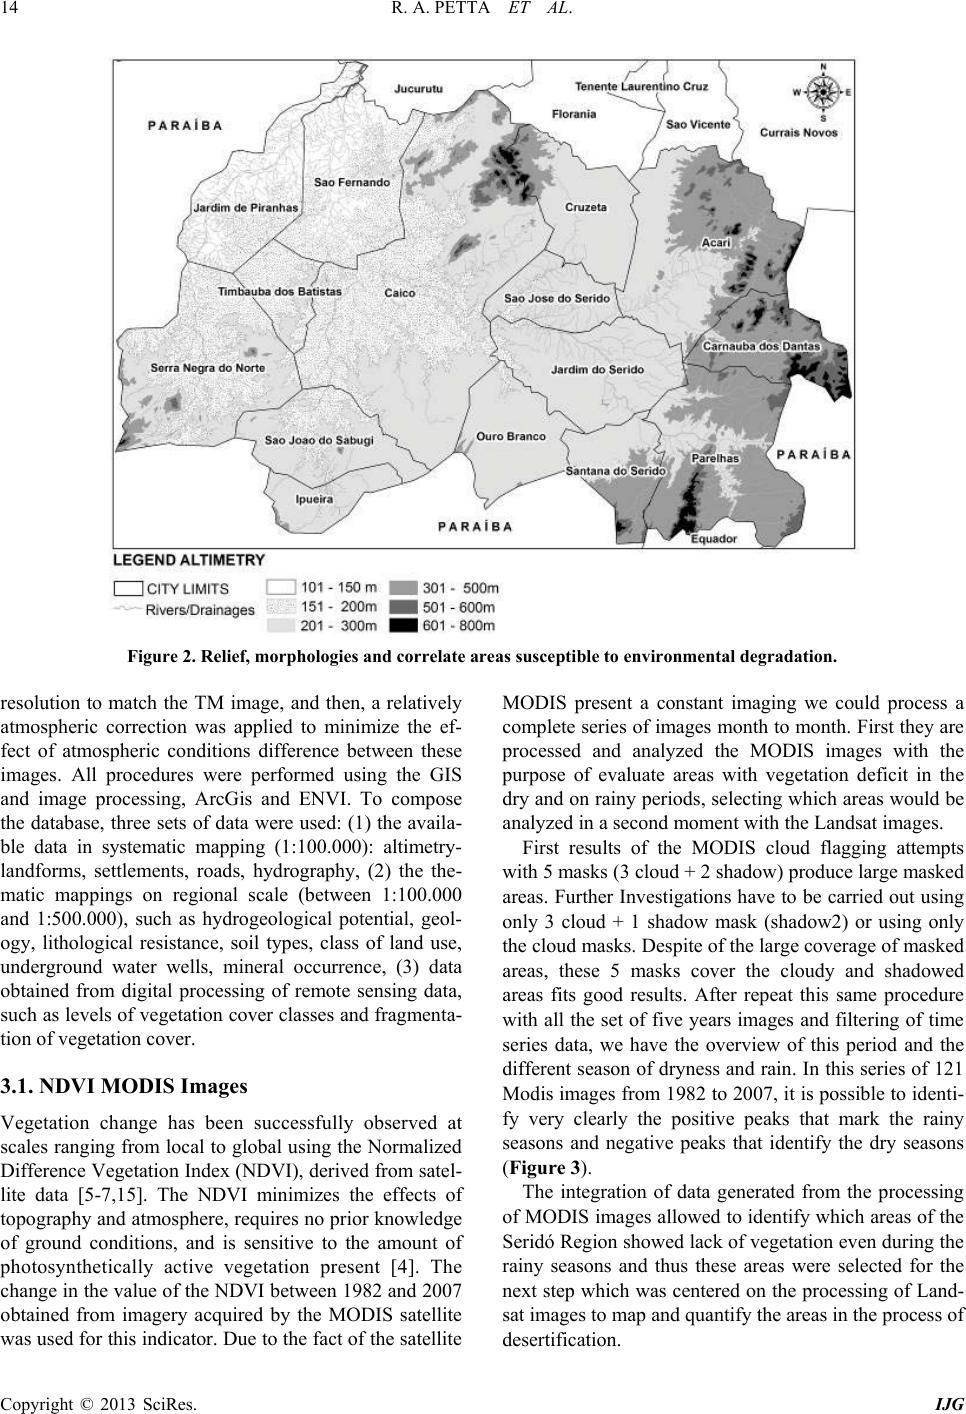 R. A. PETTA ET AL. Copyright © 2013 SciRes. IJG 14 Figure 2. Relief, morphologies and correlate areas susceptible to environmental degradation. resolution to match the TM image, and then, a relatively atmospheric correction was applied to minimize the ef- fect of atmospheric conditions difference between these images. All procedures were performed using the GIS and image processing, ArcGis and ENVI. To compose the database, three sets of data were used: (1) the availa- ble data in systematic mapping (1:100.000): altimetry- landforms, settlements, roads, hydrography, (2) the the- matic mappings on regional scale (between 1:100.000 and 1:500.000), such as hydrogeological potential, geol- ogy, lithological resistance, soil types, class of land use, underground water wells, mineral occurrence, (3) data obtained from digital processing of remote sensing data, such as levels of vegetation cover classes and fragmenta- tion of vegetation cover. 3.1. NDVI MODIS Images Vegetation change has been successfully observed at scales ranging from local to global using the Normalized Difference Vegetation Index (NDVI), derived from satel- lite data [5-7,15]. The NDVI minimizes the effects of topography and atmosphere, requires no prior knowledge of ground conditions, and is sensitive to the amount of photosynthetically active vegetation present [4]. The change in the value of the NDVI between 1982 and 2007 obtained from imagery acquired by the MODIS satellite was used for this indicator. Due to the fact of the sa tellite MODIS present a constant imaging we could process a complete series of images month to month. First they are processed and analyzed the MODIS images with the purpose of evaluate areas with vegetation deficit in the dry and on rainy periods, selecting which ar eas wo uld b e analyzed in a second moment with the Landsat images. First results of the MODIS cloud flagging attempts with 5 masks (3 cloud + 2 shadow) produce large masked areas. Further Investigations have to be carried out using only 3 cloud + 1 shadow mask (shadow2) or using only the cloud masks. Despite of the large coverage of masked areas, these 5 masks cover the cloudy and shadowed areas fits good results. After repeat this same procedure with all the set of five years images and filtering of time series data, we have the overview of this period and the different season of dryness and rain. In this series of 121 Modis images from 1982 to 2007, it is possible to identi- fy very clearly the positive peaks that mark the rainy seasons and negative peaks that identify the dry seasons (Figure 3). The integration of data generated from the processing of MODIS images allowed to id entify which areas of the Seridó Region showed lack of vegetation even during the rainy seasons and thus these areas were selected for the next step which was centered on the processing of Land- sat images to map and quantify the areas in the process of desertification. 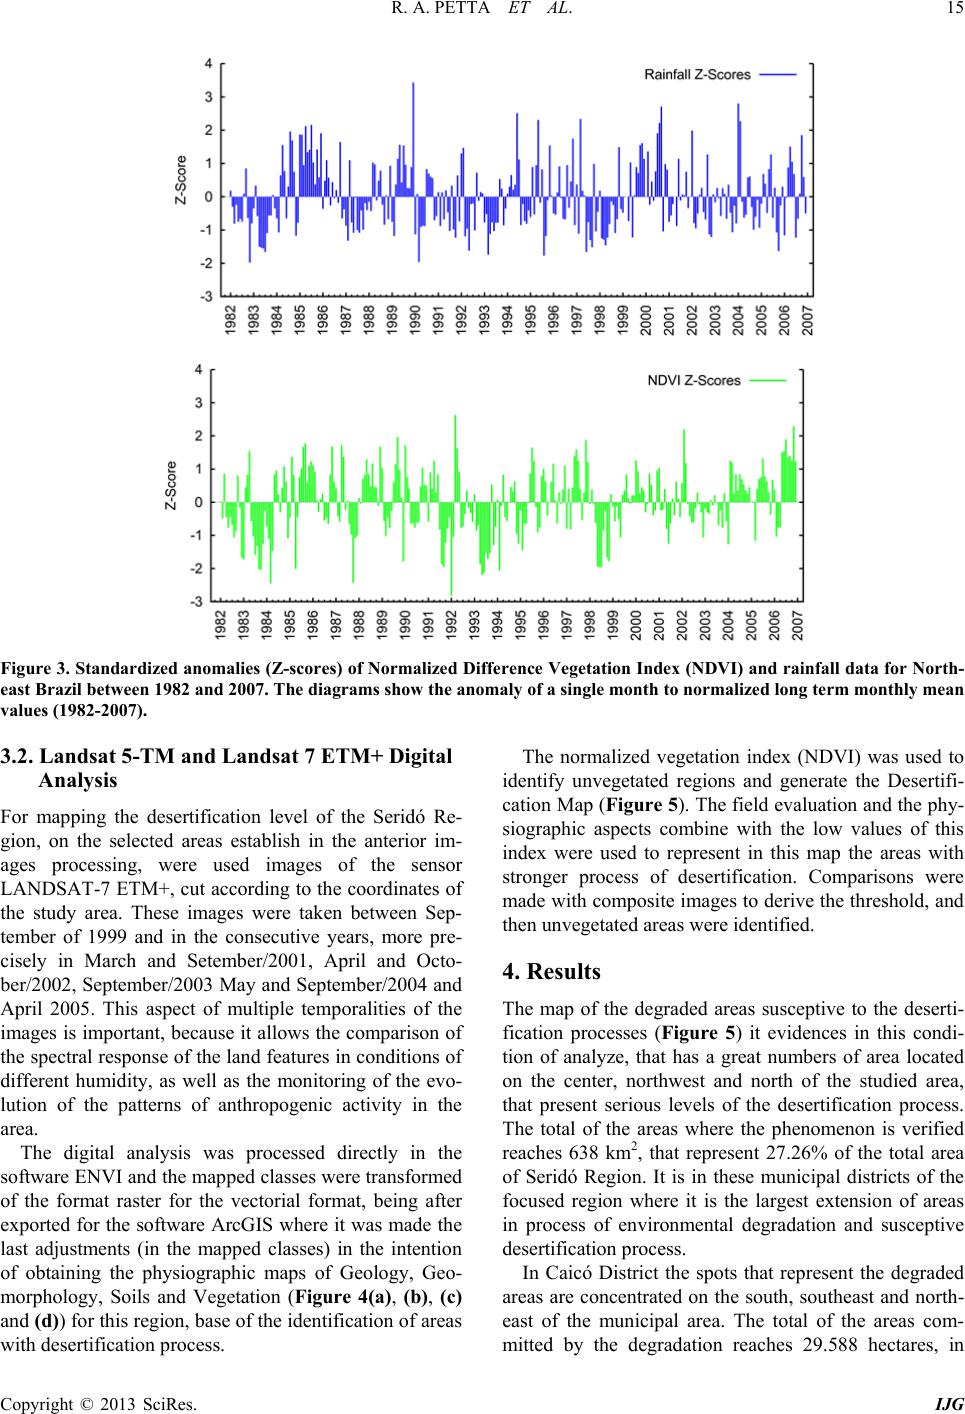 R. A. PETTA ET AL. Copyright © 2013 SciRes. IJG 15 Figure 3. Standardized anomalies (Z-scores) of Normalized Difference Vegetation Index (NDVI) and rainfall data for North- east Brazil between 1982 and 2007. The diagrams show the anomaly of a single month to normalized long term monthly mean values (1982-2007). 3.2. Landsat 5-TM and Landsat 7 ETM+ Digital Analysis For mapping the desertification level of the Seridó Re- gion, on the selected areas establish in the anterior im- ages processing, were used images of the sensor LANDSAT-7 ETM+, cut according to the coordinates of the study area. These images were taken between Sep- tember of 1999 and in the consecutive years, more pre- cisely in March and Setember/2001, April and Octo- ber/2002, September/2003 May and September/2004 and April 2005. This aspect of multiple temporalities of the images is important, because it allows the comparison of the spectral response of the land features in conditions of different humidity, as well as the monitoring of the evo- lution of the patterns of anthropogenic activity in the area. The digital analysis was processed directly in the software ENVI and the mapped classes were transformed of the format raster for the vectorial format, being after exported for the software ArcGIS where it was made the last adjustments (in the mapped classes) in the intention of obtaining the physiographic maps of Geology, Geo- morphology, Soils and Vegetation (Figure 4(a), (b), (c) and (d)) for this region, base of the identification of areas with desertification process. The normalized vegetation index (NDVI) was used to identify unvegetated regions and generate the Desertifi- cation Map (Figure 5). The field evaluation and the phy- siographic aspects combine with the low values of this index were used to represent in this map the areas with stronger process of desertification. Comparisons were made with composite images to derive the threshold, and then unvegetated areas were identified. 4. Results The map of the degraded areas susceptive to the deserti- fication processes (Figu r e 5) it evidences in this condi- tion of analyze, that has a great numbers of area located on the center, northwest and north of the studied area, that present serious levels of the desertification process. The total of the areas where the phenomenon is verified reaches 638 km2, that represent 27.26% of the total area of Seridó Region. It is in these municipal districts of the focused region where it is the largest extension of areas in process of environmental degradation and susceptive desertification process. In Caicó District the spots that represent the degraded areas are concentrated on the south, southeast and north- east of the municipal area. The total of the areas com- mitted by the degradation reaches 29.588 hectares, in  R. A. PETTA ET AL. Copyright © 2013 SciRes. IJG 16 Figure 4. Maps of Geology (4A), Geomorphology (4B), Soils (4C) and Vegetation (4D). Figure 5. Areas in process of desertification (dark spots).  R. A. PETTA ET AL. Copyright © 2013 SciRes. IJG 17 other words, 17.59% of the total area of the municipal district. The municipal district of Serra Negra constitutes, in Medium Seridó, the least affected for the observed environmental phenomenon, presenting dispersed scat- tered spots in all its extension, with a larger concentra- tion on southwest and northeast. In quantitative terms, the degradation areas represent 7.434 hectares, corres- ponding to 11.34% of its total area. The special comparison was done of NDVI indexes derived from Modis and current Vegetation NDVI on Landsat. This study has shown that to compile the maps of different images parameters of the same ecosystems, including desertification depth (through special methods), desertification yearly dynamics (through change/time series analysis), vegetation monthly and seasonal index dynamics (through NDVI change/time series analysis etc. is possible to define and analyze spatial structure of semi-arid ecosystems. REFERENCES [1] Agenda 21, UNCED ONU., 1994. http://www.un.org/esa/dsd/agenda21/res_agenda21_12.sh tml [2] IBGE—Instituto Brasileiro de Geografia e Estatística Contagem da População—Resultados Oficiais, 2010. http://censo2010.ibge.gov.br/ [3] E. Aguado and J. E. Burt, “Understanding Weather and Climate,” 5th Edition, Prentice Hall, Upper Saddle River, New Jersey, 2010. [4] H. A. Barbosa, A. R. Huete and W. E. Baethgen, “A 20- Year Study of NDVI Variability over the Northeast Re- gion of Brazil,” Journal of Arid Environments, Vol. 67, No. 2, 2006, pp. 288-307. [5] H. C. Gurgel and N. J. Ferreira, “Annual and Interannual Variability of NDVI in Brazil and Its Connections with Climate,” International Journal of Remote Sensing, Vol. 24, No. 18, 2003, pp. 3595-3609. http://dx.doi.org/10.1080/0143116021000053788 [6] Y. Julien and J. A. Sobrino, “The Yearly Land Cover Dy- namics (YLCD) Method: An Analysis of Global Vegeta- tion from NDVI and LST Parameters,” Remote Sensing of Environment, Vol. 113, 2009, pp. 329-334. http://dx.doi.org/10.1016/j.rse.2008.09.016 [7] J. P. Malingreau, C. J. Tucker and N. Laporte, “AVHRR for Monitoring Global Tropical Deforestation,” Interna- tional Journal of Remote Sensing, Vol. 10, 1989, pp. 855- 867. http://dx.doi.org/10.1016/j.rse.2008.09.016 [8] G. Palubinskas, R. M. Lucas, G. M. Foody and P. J. Cur- ran, “An Evaluation of Fuzzy and Texture-Based Classi- fication Approaches for Mapping Regenerating Tropical Forest Classes from Landsat TM Data,” International Journal of Remote Sensing, Vol. 4, No. 16, 1995, pp. 747- 759. http://dx.doi.org/10.1080/01431169508954437 [9] B. C. Reed, J. F. Brown, D. Vanderzee, T. R. Loveland, J. W. Merchant and D. O. Ohlen, “Measuring Phenological Variability from Satellite Imagery,” Journal of Vegetation Science, Vol. 5, 1994, pp. 703-714. http://dx.doi.org/10.2307/3235884 [10] C. W. Thornthwaite, “An Approach toward a Rational Classification of Climate,” Geographical Review, Vol. 38, No. 1, 1948, pp. 55-94. http://dx.doi.org/10.2307/210739 [11] C. J. Tucker, J. E. Pinzon, M. E. Brown, D. Slayback, E. W. Pak, R. Mahoney , E. Vermote and N. El Saleous, “An Extended AVHRR 8-km NDVI Data Se t Compa ti ble wit h MODIS and SPOT Vegetation NDVI Data,” Internatio- nal Journal of Remote Sensing, Vol. 26, No. 20, 2005, pp. 4485-5598. http://dx.doi.org/10.1080/01431160500168686 [12] X. Wang, A. S. Auler, R. L. Edwards, H. Cheng, P. S. Cristalli, P. L. Smart, D. A. Richards and C. C. Shen, “Wet Periods in Northeastern Brazil ove r the Past 210 kyr Linked to Distant Climate Anomalies,” Nature, Vol. 432, 2004, pp. 740-743. |