

Paper Menu >>
Journal Menu >>
 Engineering, 2013, 5, 1-5 http://dx.doi.org/10.4236/eng.2013.59B001 Published Online September 2013 (http://www.scirp.org/journal/eng) Copyright © 2013 SciRes. ENG Capacity Worth of Energy Storage System in Renewable Power Gener a tion Pl an t Jinbin Li1,2, Yao Yao1,2 1Hubei Electric Power Research Institute, Wuhan, China 2Key Laboratory of High-Voltage Field-Test Technique of SGCC, Wuhan, China Email: [email protected] Received May 2013 ABSTRACT With the advance in renewable generation technologies, the cost of renewable energy becomes increasingly competitive when compared to fossil fuel-based generation resources. It is economically beneficial to integrate large amounts of renewable capacity in power systems. Unlike traditional generation facilities, however, using renewable resources for generation presents technical challenges in producing continuous power. In this report, an Energy Storage System (ESS) is integrated to smooth the variations in renewable power production and ensure the output power more controllable. Since it requires capital investment for the storage devices, it is important to obtain reasonable estimate of the storage capacities. This project is therefore for mulated as an optimization problem in determining the two dominating factors of the capital cost for the ESS: the power capacity and the energy capacity. The objective is to make the renewable power more reliable and simultaneously maximize the economic benefits that can be obtained from the scheme. To make the results more convincing, analyses in this report start with wind generation, for wind has greater variability and unpre- dictability than other renewable sources. Selection of ESS type is narrowed down to battery energy storage system (BESS) in the scheme. However, the methods presented here are suitable for any type of energy storage methods and are also useful for intermittent renewable energy resources other than wind. Keywords: Wind Power; Energy Storage System; Power Capacity; Energy Capacity 1. Introduction Economic growth and prosperity since the industrial rev- olution have, in large part, been due to the utilization of fossil fuels. The consumption of fossil fuels has nearly doubled every 20 years since 1900 [1]. However, the long-term large combustion of fossil fuels has caused undesirable environment impacts. The burning process emits large amount of carbon dioxide and other gases which cause the “greenhouse effect” and pollution [2]. And, even if we set aside worries about the environment problems fossil fuels have brought to us, it must be ac- knowledged that continuous and economically-priced fossil fuels are fast coming to an end. One obvious wa y to solve the worldwide energy crisis problem is to find new primary sources. Amongst the alternatives, wind energy is very promising. Many coun- tries have set goal for high penetration levels of wind generations. The annual growth rate of global installed wind power capacity has exceeded 26% since 1990s [3]. However, one down side of wind power is its variabil- ity and relative unpredictability. The output of wind power system depends highly on the local natural envi- ronment which is hardly controllable. Hence this form of electricity generation would introduce more uncertainty into the power grid. This presents a challenge when inte- grating large scale wind power into electrical power networks. To counter this, a usual scheme is to use ener- gy storage devices as an energy buffer. It leads to a re- duction in the amount of spinning and standby power reserve needed to mitigate system frequency and voltage excursions due to the variations in the wind power output [4]. 2. Power in Wind and Wind Turbine Model 2.1. Power in the Wind The power in the wind is closely related to the wind speed, the relationship between them is presented as fol- lows [5]: Pw = 0.5ρA v3 (1) where Pw is the power in the wind (W); ρ is the air den- sity (kg/m3); A is the cross-sectional area through which the wind passes (m2); and v is wind speed normal to A (m/s). One expression that is often used to characterize the impact of height on wind speed is the following [5]: 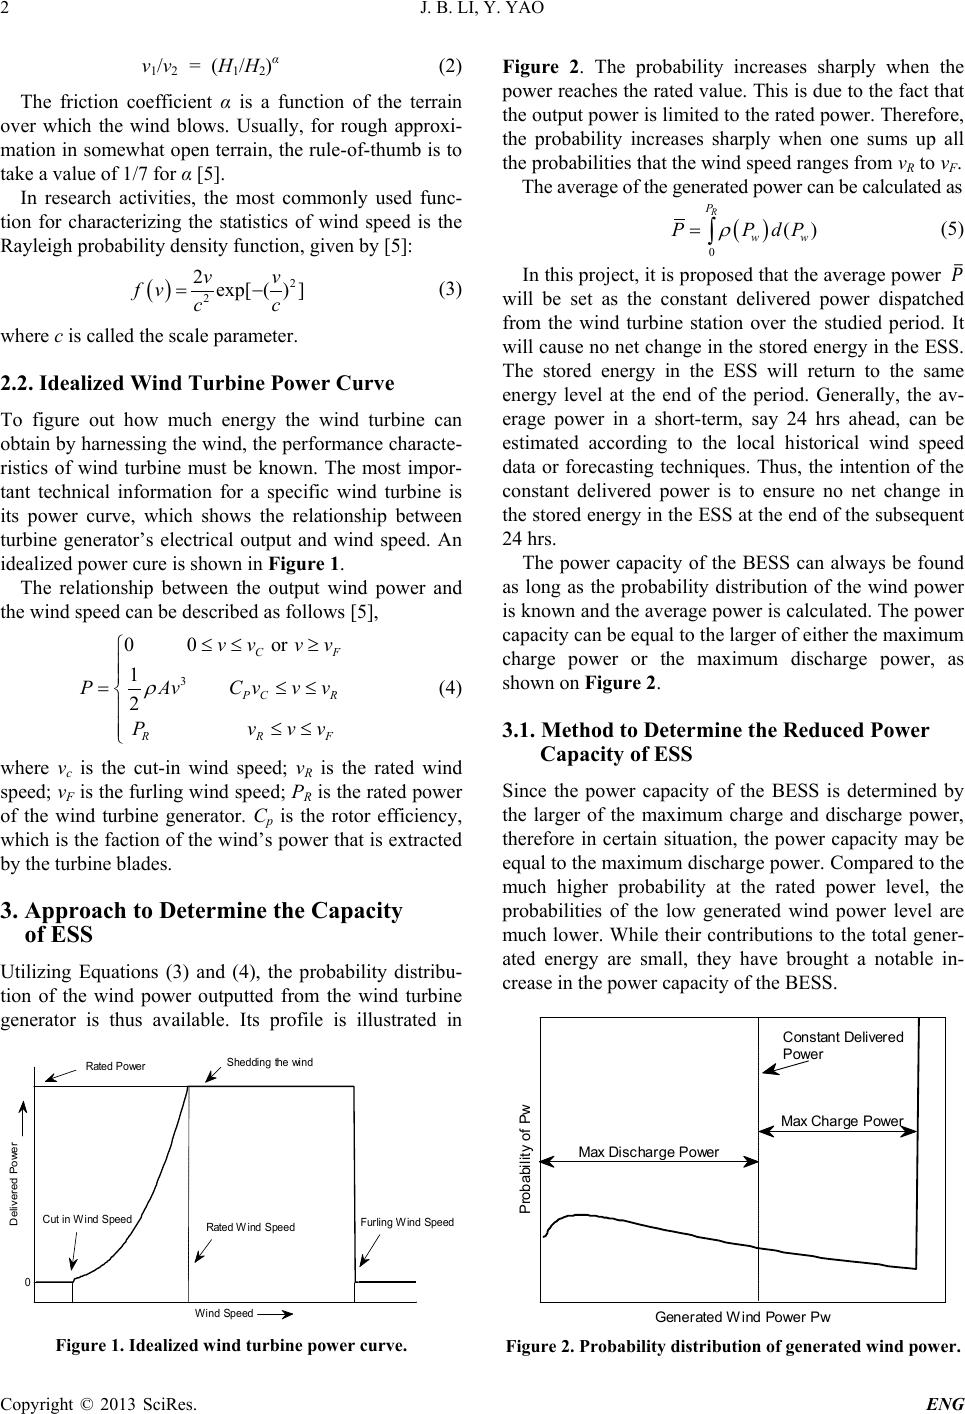 J. B. LI, Y. YAO Copyright © 2013 SciRes. ENG 2 v1/v2 = (H1/H2)α (2) The friction coefficient α is a function of the terrain over which the wind blows. Usually, for rough approxi- mation in somewhat open terrain, the rule-of-thumb is to take a value of 1/7 for α [5]. In research activities, the most commonly used func- tion for characterizing the statistics of wind speed is the Rayleigh probability density fun c tion, given by [5]: ( ) 2 2 2exp[() ] vv fv c c = − (3 ) where c is called the scale parameter. 2.2. Idealized Wind Turbine Power Curve To figure out how much energy the wind turbine can obtain by harnessing the wind, the performance characte- ristics of wind turbine must be known. The most impor- tant technical information for a specific wind turbine is its power curve, which shows the relationship between turbine generator’s electrical output and wind speed. An idealized power cure is shown in Figure 1. The relationship between the output wind power and the wind speed can be described as follows [5], 3 00or 1 2 CF PC R R RF vv vv PAvC vvv Pv vv ρ ≤≤ ≥ = ≤≤ ≤≤ (4) where vc is the cut-in wind speed; vR is the rated wind speed; vF is the furling wind speed; PR is the rated pow er of the wind turbine generator. Cp is the rotor efficiency, which is the faction of the wind’s power that is extracted by the turbine blades. 3. Approach to Determine the Capacity of ESS Utilizing Equations (3) and (4), the probability distribu- tion of the wind power outputted from the wind turbine generator is thus available. Its profile is illustrated in Figure 1. Ide alized wind tur bi ne power curve. Figure 2. The probability increases sharply when the power reaches the rated value. This is du e to the fact that the output power is limited to the rated power. Therefore, the probability increases sharply when one sums up all the probabilities that the wind speed ranges from vR to vF. The average of the generated power can be calculated as ( ) 0 () R P ww PP dP ρ = ∫ (5) In this project, it is proposed that the average power � will be set as the constant delivered power dispatched from the wind turbine station over the studied period. It will caus e no net change in the stored energy in the ESS. The stored energy in the ESS will return to the same energy level at the end of the period. Generally, the av- erage power in a short-term, say 24 hrs ahead, can be estimated according to the local historical wind speed data or forecasting techniques. Thus, the intention of the constant delivered power is to ensure no net change in the stored energy in the ESS at the end of the subsequen t 24 hrs. The power capacity of the BESS can always be found as long as the probability distribution of the wind power is known and the average power is calculated. The power capacity can be equal to the larger of either the maximum charge power or the maximum discharge power, as shown on Figure 2. 3.1. Method to Determine the Reduced Power Capacity of ESS Since the power capacity of the BESS is determined by the larger of the maximum charge and discharge power, therefore in certain situation, the power capacity may be equal to the maximum discharge power. Compared to the much higher probability at the rated power level, the probabilities of the low generated wind power level are much lower. While their contributions to the total gener- ated energy are small, they have brought a notable in- crease in the power capacity of the BESS. Figure 2. Probability distr ibution of gene rat ed wind power. 0 W ind Speed Delivered Power Cut in Wind Speed Shedding the wind Rated Win d Sp eed R ated Power Furling Wind Speed Generated Wi nd Power Pw Probabilit y of Pw Max Discharge Power Constant Delivered Power Max Char ge Power 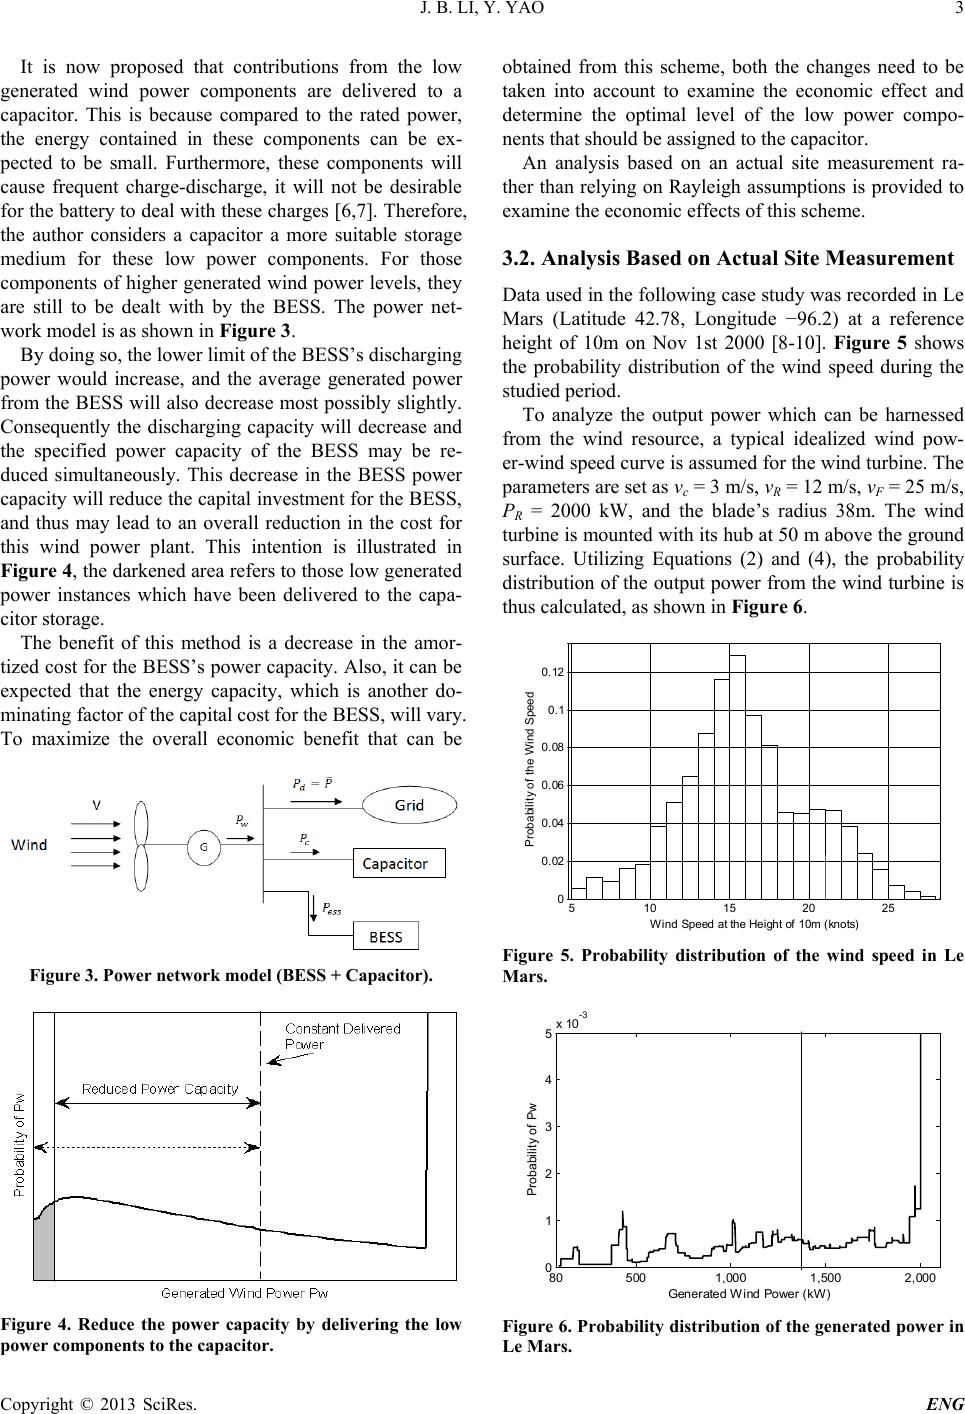 J. B. LI, Y. YAO Copyright © 2013 SciRes. ENG 3 It is now proposed that contributions from the low generated wind power components are delivered to a capacitor. This is because compared to the rated power, the energy contained in these components can be ex- pected to be small. Furthermore, these components will cause frequent charge-discharge, it will not be desirable for the battery to deal with these charges [6,7]. Therefore, the author considers a capacitor a more suitable storage medium for these low power components. For those components of higher generated wind power levels, they are still to be dealt with by the BESS. The power net- work model is as shown in Figure 3. By doing so, the lower limit of the BESS’s discharging power would increase, and the average generated power from the BESS will also decrease most possibly sligh tly. Consequently the discharging capacity will decrease and the specified power capacity of the BESS may be re- duced simultaneously. This decrease in the BESS power capacity will reduce the capital investment for the BESS, and thus may lead to an overall reduction in the cost for this wind power plant. This intention is illustrated in Figure 4, the darkened area refers to those low generated power instances which have been delivered to the capa- citor storage. The benefit of this method is a decrease in the amor- tized cost for the BESS’s power capacity. Also, it can be expected that the energy capacity, which is another do- minating factor of the capital cost for the BESS, will vary. To maximize the overall economic benefit that can be Figure 3. Power network model (BESS + Capacitor). Figure 4. Reduce the power capacity by delivering the low power components to the capacitor. obtained from this scheme, both the changes need to be taken into account to examine the economic effect and determine the optimal level of the low power compo- nents that should be assigned to the capacitor. An analysis based on an actual site measurement ra- ther than relying on Rayleigh assumptions is provided to examine the economic effects of this scheme. 3.2. Analysis Based on Actua l Site Measurement Data used in the following case study was recorded in Le Mars (Latitude 42.78, Longitude −96.2) at a reference height of 10m on Nov 1st 2000 [8-10]. Figure 5 shows the probability distribution of the wind speed during the studie d pe riod. To analyze the output power which can be harnessed from the wind resource, a typical idealized wind pow- er-wind speed curve is assumed for the wind turbine. The parameters are set as vc = 3 m/s, vR = 12 m/s, vF = 25 m/s, PR = 2000 kW, and the blade’s radius 38m. The wind turbine is mounted with its hub at 50 m above the ground surface. Utilizing E qu a tion s (2) and (4), the probability distribution of the output power from the wind turbine is thus calculated, as shown in Figure 6. Figure 5. Probability distribution of the wind speed in Le Mars. Figure 6. Probabili ty distribution of the gene rated power in Le Mars. 510 15 20 25 0 0.02 0.04 0.06 0.08 0.1 0.12 W ind Speed at the Height of 10m (knots) Probabili ty of the Wind Speed 500 1,000 1,500 2,00080 0 1 2 3 4 5x 10 -3 Generated Wind Power (kW) Probabili ty of Pw 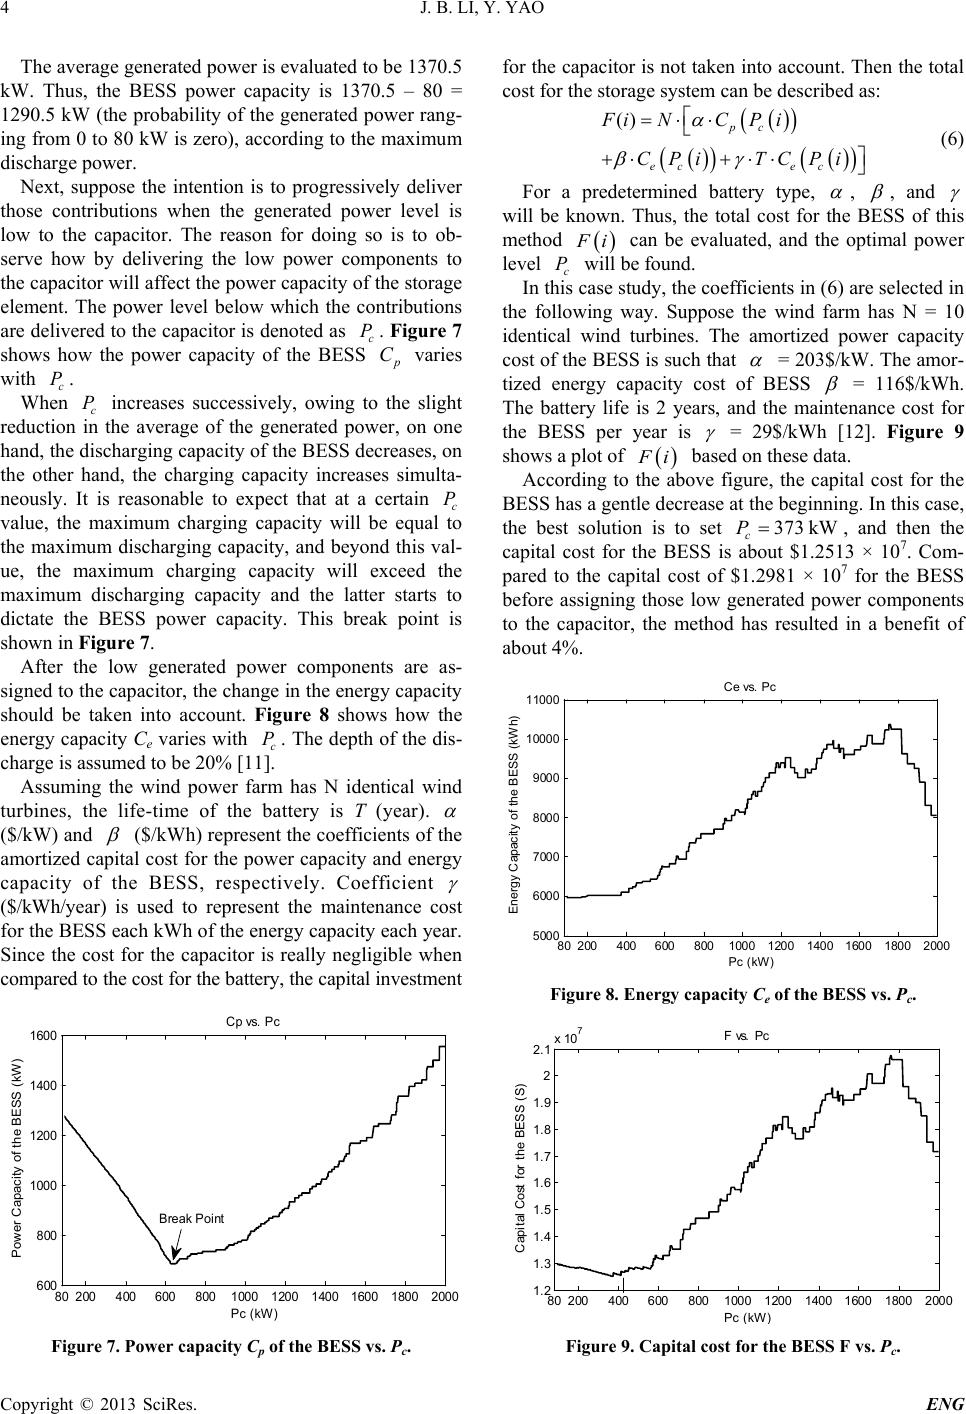 J. B. LI, Y. YAO Copyright © 2013 SciRes. ENG 4 The average generated power is evaluated to be 1370.5 kW. Thus, the BESS power capacity is 1370.5 – 80 = 1290.5 kW (the probability of the generated power rang- ing from 0 to 80 kW is zero), according to the maximum discharge power. Next, suppose the intention is to progressively deliver those contributions when the generated power level is low to the capacitor. The reason for doing so is to ob- serve how by delivering the low power components to the capacitor will affect the power capacity of the storage element. The power level below which the contributions are delivered to the capacitor is denoted as c P . Figure 7 shows how the power capacity of the BESS p C varies with c P . When c P increases successively, owing to the slight reduction in the average of the generated power, on one hand, the discharging capacity of the BESS decreases, on the other hand, the charging capacity increases simulta- neously. It is reasonable to expect that at a certain c P value, the maximum charging capacity will be equal to the maximum discharging capacity, and beyond this val- ue, the maximum charging capacity will exceed the maximum discharging capacity and the latter starts to dictate the BESS power capacity. This break point is shown in Figure 7. After the low generated power components are as- signed to the capacitor, the change in the energy capacity should be taken into account. Figure 8 shows how the energy capacity Ce varies with c P . The depth of the dis- charge is assumed to be 20% [11]. Assuming the wind power farm has N identical wind turbines, the life-time of the battery is T (year). α ($/kW) and β ($/kWh) represent the coefficien ts of the amortized capital cost for the power capacity and energy capacity of the BESS, respectively. Coefficient γ ($/kWh/year) is used to represent the maintenance cost for the BESS each kWh of the energy capacity each year. Since the cost for the capacitor is really negligible when compared to the cost fo r the b at tery, the cap it al in vestmen t Figure 7. Power capacity Cp of the BESS vs. Pc. for the capacitor is not taken into account. Then the total cost for the storage system can be described as: ( ) ( ) ( ) ( ) ( ) ( ) () pc ec ec FiNCP i C PiTC Pi α βγ =⋅⋅ +⋅+⋅⋅ (6) For a predetermined battery type, α , β , and γ will be known. Thus, the total cost for the BESS of this method ( ) Fi can be evaluated, and the optimal power level c P will be found. In this case study, the coefficients in (6) are selected in the following way. Suppose the wind farm has N = 10 identical wind turbines. The amortized power capacity cost of the BESS is such that α = 203$/kW. The amor- tized energy capacity cost of BESS β = 116$/kWh. The battery life is 2 years, and the maintenance cost for the BESS per year is γ = 29$/kWh [12]. Figure 9 shows a plot of ( ) Fi based on these data. According to the above figure, the capital cost for the BESS has a gentle decrease at the beginning. In this case, the best solution is to set 373 kW c P= , and then the capital cost for the BESS is about $1.2513 × 10⁷. Com- pared to the capital cost of $1.2981 × 10⁷ for the BESS before assigning those low generated power components to the capacitor, the method has resulted in a benefit of about 4%. Figure 8. Energy capacity Ce of the BESS vs. Pc. Figure 9. Capital cost for the BESS F vs. Pc. 200 400 600 800 1000 1200 1400 1600 1800 2000 80 6 00 8 00 1000 1200 1400 1600 Pc ( kW) Power Capacity of the BESS ( kW) Cp vs. Pc Break Poin t 200 400 600 800 1000 1200 1400 1600 1800 2000 80 5000 6000 7000 8000 9000 10000 11000 C e vs. Pc Pc ( kW) Energy Capacity of the BESS (kW h) 200 400600 80010001200 14001600 1800200080 1.2 1.3 1.4 1.5 1.6 1.7 1.8 1.9 2 2.1 x 10 7 Pc ( kW) Cap ital Cost f or the BESS ( S) F vs. Pc  J. B. LI, Y. YAO Copyright © 2013 SciRes. ENG 5 Using a similar process, other wind power plants cou ld be analyzed. The optimal c P level can be found to mi- nimize the capital cost for the BESS. 4. Conclusion The methodology is proposed to assign those low gener- ated power contributions to a capacitor. For those com- ponents of higher generated wind power levels, they are to be dealt with by the BESS to provide a constant deli- vered power for the grid. By doing so, the power capaci- ty of the BESS would drop, and thus the capital cost for the BESS might probably decrease. The result from the overall design demonstrated that utilizing this method could create a considerable economic benefit. 5. Acknowledgeme nts The author wish to express his deepest gratitude and ap- preciation to his supervisor, Prof. Choi San Shing, for all his invaluable suggestion and patient guidance through- out the research period. REFERENCES [1] H. Lund, “Renewable Energy Systems,” Elsevier Inc., San Diego, California, 2010. [2] S. C. W. Krauter, “Solar Electric Power Generation— Photovolataic Energy Systems,” Springer Inc., Rio de Ja- neiro, Brazil, Oct 2005. [3] M. S. Lu, C. L. Chang, W. J. Lee and L. Wang, “Com- bining the Wind Power Generation System with Energy Storage Equipments,” IEEE, 2008. [4] PEP (Professional Engineering Publishing), “Renewable Energy Storage—Its Role in Renewables and Future Electricity Markets,” John Wiley & Sons Inc., 11 Jun 2008. [5] G. M. Masters, “Renewable and Efficient Electric Power Systems,” John Wiley & Sons Inc., Hoboken, New Jersey, 2004. http://dx.doi.org/10.1002/0471668826 [6] T. R. Crompton, “Battery of Reference Book,” Butter- worth International Edition, 1990, ISBN: 0-408-00791-5. [7] D. L. Yao, “Battery Energy Storage System for a Wind Power Generation Scheme,” Master Dissertation, Na- nyang Technological University, Singapore, 2008. [8] “Wind Data Source: The lowa Department of Transporta- tion (DOT),” URL. http://mesonet.agron.iastate.edu/request/awos/1min.php [9] “National Renewable Energy Laboratory (NREL),” URL. http://www.nrel.gov/ [10] National Renewable Energy Laboratory, “National Solar Radiation Database 1991-2005 Update: User’s Manual,” Technical Report, NREL/TP-581-41364, April 2007. [11] UNiROSS Industrial, “The Rechargeable Specialists,” URL. http://www.uniross.com/UK/industrial/Cycle%20life/010 102 [12] S. S. Choi, X. Y. Wang and D. M. Vilathgamuwa, “On the Design of Power Buffer and its Applications,” IEEE, DRPT2008, 6-9 April 2008, Nanjing, China. |