

Paper Menu >>
Journal Menu >>
 Vol.4, No.10, 536-540 (2013) Agricultural Sciences http://dx.doi.org/10.4236/as.2013.410072 Technical efficiency analysis of hybrid maize production using translog model case study in District Chiniot, Punjab (Pakistan) Syed Asif Ali Naqvi*, Muhammad Ashfaq Institute of Agricultural and Resource Economics, University of Agriculture, Faisalabad, Pakistan; *Corresponding Author: [email protected] Received 9 January 2013; revised 10 February 2013; accepted 15 March 2013 Copyright © 2013 Syed Asif Ali Naqvi, Muhammad Ashfaq. This is an open access article distributed under the Creative Commons Attribution License, which permits unrestricted use, distribution, and reproduction in any medium, provided the original work is properly cited. ABSTRACT In Pakistan, maize accounts for 5.93 percent of the total cropped area and 4.82 percent of the value of agricultural production. Given high cost of the production, there is a belief that it is dif- ficult to boost profitability without enhancing use of pricey inputs. Maximum likelihood estimates of stochastic frontier model were estimated and determinants of technical efficiency were calcu- lated. Using Cobb Douglas model estimated ma- ximum likelihood coefficients for all inputs were significant and showed signs according to ex- pectations. The evaluation with the different mo- dels gives different technical efficiencies, which shows that technical efficiency estimations are extremely sensitive to the functional form speci- fied. Keywords: Maize; Tran slog Model; Maximum Likelihood Co ef ficie nts 1. INTRODUCTION Maize (Zea mays L.) is the third cereal for Pakistan after wheat and rice and it accounts for 5.93 percent of the total cropped area and 4.82 percent of the value of agri- cultural production. Maize being the highest yielding ce- real crop in the world is of significant importance for countries like Pakistan, where rapidly increasing popu- lation has already out stripped the available food supplies output. Area under maize occupies the third position after wheat and rice, 98% of which is grown in Punjab and N.W.F.P. It is intensely grown on worldwide bases and often referred as “king of grain crops” [1]. It is grown on an area of 1083 thousand hectares with a yearly pro- duction of 4271 thousand tones and it has 3944 kg/hec- tare yield per hectare [2]. Mostly the farms with the same resources are produc- ing different per acre output, because of management in- efficiency. The scanty or no role of extension services, poor right of entry to credit, tenant cultivation, low lite- racy rate, poor communications facilities, and long dis- tance from markets [3] characterize inefficient farms. At present yield level is still up to some extent lower than the potential of our existing varieties. Main constraints to enhance maize productivity are unfavorable weather con- ditions, unavailability of input at proper time, suboptimal plant density, late sowing, inadequate fertilizer use, ina- dequate water supply, weed infestation, insect pest attack and the selection of unsuitable cultivars under a given set of environments. Consequently, a farmer’s ability to in- crease his income and productivity level is constrained by a number of factors of which many fall out of his con- trol. Pakistani maize farmers are constrained with many such factors as acquisition of inputs with limited re- sources. Normally, the efficiency levels are low when compar- ed to the international per acre productivity: no doubt, some of the factors contributing towards the low produc- tivity are out of control. This inefficiency is also termed as technical inefficiency and Farrel [4] developed its con- cept. Broadly speaking, technical inefficiency is the fail- ure to produce maximum output from a given level of in- puts. This efficiency has two components: technical and al- locative. Technical efficiency is the ability of a firm to produce a maximal output from a given set of inputs or it is the ability of a firm to use as modest inputs as possible for a given level of output. The former is called input ori- ented measures and the latter is known as output-oriented measures of technical efficiency. Productivity can be in- Copyright © 2013 SciRes. OPEN A CCES S  S. A. A. Naqvi, M. Ashfaq / Agricultural Sciences 4 (2013) 536-540 537 creased through more efficient utilization of resources of farmers and inputs with current technology. In this study, efficiency of maize producers of District Chiniot is eva- luated. Interrelationship between efficiency level and va- rious firm specific factors provides useful policy related information. Main objective of the study is to calculate the technical efficiency and determinants of inefficiency of maize growers. A particular objective of the study is to identify the factors causing technical inefficiency by exa- mining the relationship between efficiency level and va- rious firm specific factors. 2. MATERIALS AND METHODS The primary data was used in this study, which was collected from District Chiniot during the year 2010-11. In order to collect data, random sampling technique was used. The sampling procedure involved the three stages: selection of tehsils, selection of villages, and selection of farmers (respondents). Three tehsils were selected for collecting data and three villages were selected from each selected Tehsil. A sample of 120 farmers was taken as total by dividing equally into three groups (large, me- dium and small) by farm size. A farm was considered small if farm size is less than or equal to 12.5 acres, me- dium if farm size was more than 12.5 acres and less than 25 acres, and large if farm size is equal to or greater than 25 acres. Three sampling frames were designed at village level by making strata of small, medium and large far- mers. Five farmers were selected from each stratum ran- domly. 2.1. Statistical Analyses The Cobb-Douglas and Translog production frontier functions defined and the inefficiency model were jointly projected by the maximum-likelihood (ML) method us- ing FRONTIER 4.1 [5]. By taking the same indicators for the both models, it is clear from the results that Trans- logrithmic function has a more robustness over the Cobb- Douglas because the mean technical efficiency from the of prior was up to 94% while for subsequent model it was 81.06%. At this juncturevariant of the stochastic function ap- proach proposed by Battese and Coelli [6] and continu- ed by Greene [7], Hassan [8] and Dey et al. [9] in which technical inefficiency effects in a stochastic frontier are an explicit function of other farm specific explanatory variables, and all parameters are estimated in a single- stage maximum likelihood (ML) procedure. The stocha- stic production frontieris, 0 ln ln, ijiji Yv i u Here, Yi is the yield of maize for the i-th farm, xi is a vector of inputs (or cost of inputs), is a vector of i-th unknown parameters, (vi − ui) is an error term. The stochastic frontier is also called composed error model, because it shows that the error term (vi − ui) is decom- posed into two components: a stochastic random error component (random shocks) vi and a technical ineffici- ency component ui. Where Vi is a symmetrical two sided normally distributed random error that contains stocha- stic effects which are uncontrolled. It is assumed to be independently and identically distributed 2 0, v N . The term i, is one side ( I > 0) efficiency component. The two error component (v and ) are also assumed to be in- dependent of each other. The variance parameters of the model are parameterized as: 2 222 2 ; and 01 u svu s 2.2. Cobb-Douglas Function 011 2233 4455 lnln lnln ln ln i ii YXX XXVU X i where, Yi is the quantity of output (Kg): X1 is the land preparation cost (Rs); X2 is N, P, and K nutrients applied (Kg); X3 is the total irrigation (number); X4 is the total chemical cost counting both weeding and insecticide cost (Rs) and X5 is thetotal threshing cost (Rs). Inefficiency regression equation can be written as, ,1 iii uZ where, Zi are farm-specific variables that may cause in- efficiency and δο and all δi are coefficients to be estimated. Z1 is farming experience (year); Z2 is the education (year); Z3 is the credit it is in the form of dummy variable it has value 1 if farmer avails credit otherwise it would be equal to 0; Z4 is the extension facilities, dummy variable as- suming value 1 if farmer avails extension facilities, other- wise 0; Z5 is the maize cropped area (acre); Z6 is the dum- my variable for sowing time assuming value 1 if farmer sow timely, otherwise 0. 2.3. Translogrithmic Model ln lnln 1, 2, 3,1, 2, 3 itititjtit it YXXXV intn Inefficiency model and variables were same as the Cobb-Douglasmodel. 3. RESULTS AND DISCUSSION The summary statistics related tothe variables used in analysis is given in Table 1. It is clear from the table the mean yield was 3570 kg, farming experience was 22.7 year, up to 15 irrigations Copyright © 2013 SciRes. OPEN A CCES S 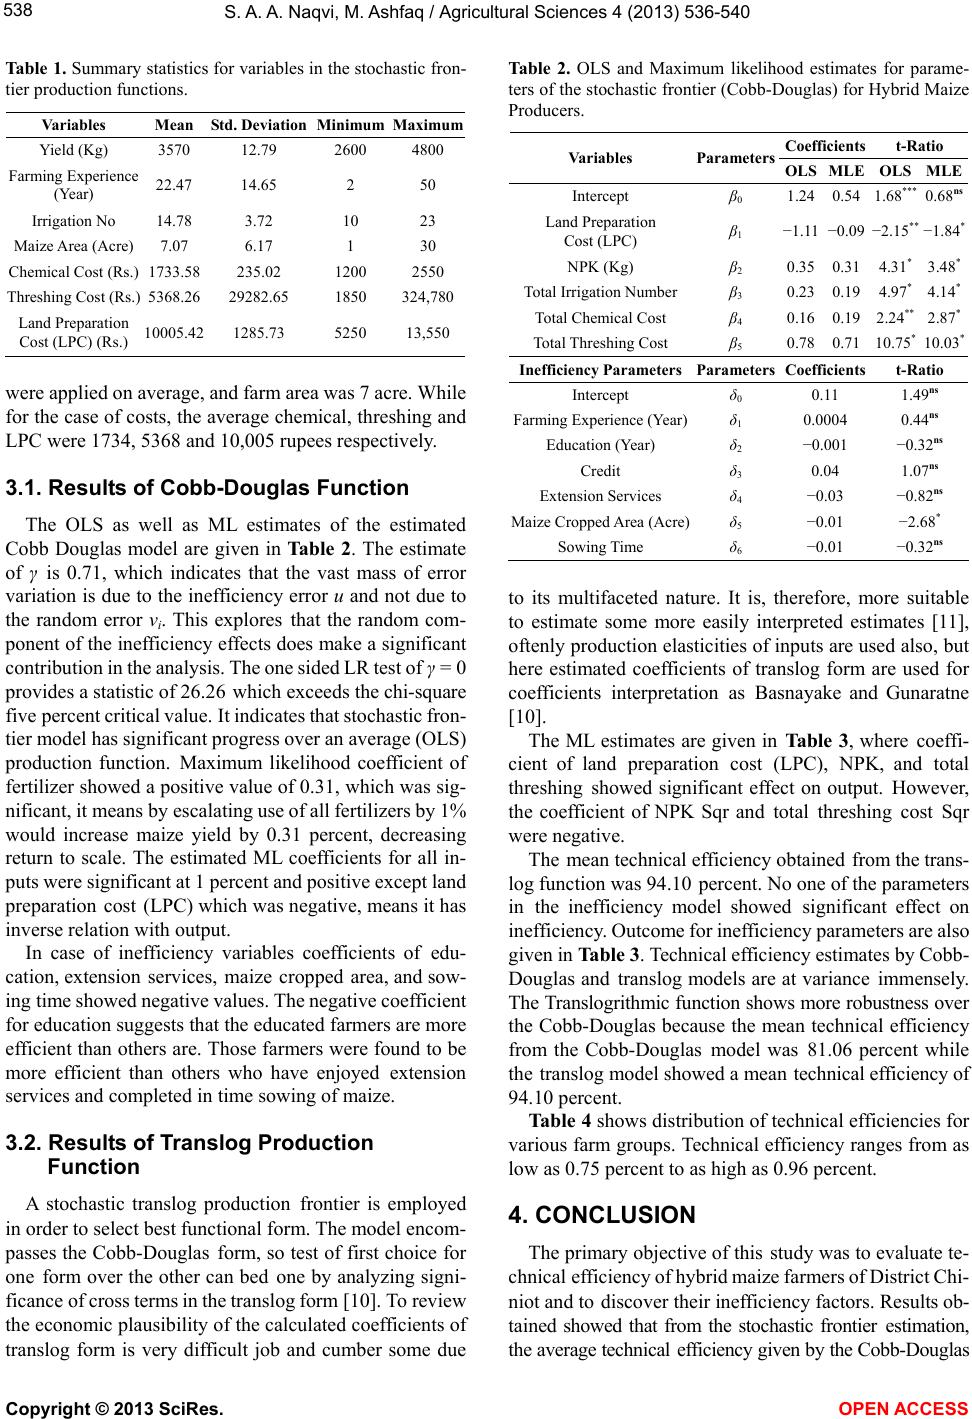 S. A. A. Naqvi, M. Ashfaq / Agricultural Sciences 4 (2013) 536-540 538 Tabl e 1 . Summary statistics for variables in the stochastic fron- tier production functions. Variables Mean Std. Deviation MinimumMaximum Yield (Kg) 3570 12.79 2600 4800 Farming Experience (Year) 22.47 14.65 2 50 Irrigation No 14.78 3.72 10 23 Maize Area (Acre) 7.07 6.17 1 30 Chemical Cost (Rs.) 1733.58 235.02 1200 2550 Threshing Cost (Rs.) 5368.26 29282.65 1850 324,780 Land Preparation Cost (LPC) (Rs.) 10005.42 1285.73 5250 13,550 were applied on average, and farm area was 7 acre. While for the case of costs, the average chemical, threshing and LPC were 1734, 5368 and 10,005 rupees respectively. 3.1. Results of Cobb-Douglas Function The OLS as well as ML estimates of the estimated Cobb Douglas model are given in Ta bl e 2. The estimate of γ is 0.71, which indicates that the vast mass of error variation is due to the inefficiency error u and not due to the random error vi. This explores that the random com- ponent of the inefficiency effects does make a significant contribution in the analysis. The one sided LR test of γ = 0 provides a statistic of 26.26 which exceeds the chi-square five percent critical value. It indicates that stochastic fron- tier model has significant progress over an average (OLS) production function. Maximum likelihood coefficient of fertilizer showed a positive value of 0.31, which was sig- nificant, it means by escalating use of all fertilizers by 1% would increase maize yield by 0.31 percent, decreasing return to scale. The estimated ML coefficients for all in- puts were significant at 1 percent and positive except land preparation cost (LPC) which was negative, means it has inverse relation with output. In case of inefficiency variables coefficients of edu- cation, extension services, maize cropped area, and sow- ing time showed negative values. The negative coefficient for education suggests that the educated farmers are more efficient than others are. Those farmers were found to be more efficient than others who have enjoyed extension services and completed in time sowing of maize. 3.2. Results of Translog Production Function A stochastic translog production frontier is employed in order to select best functional form. The model encom- passes the Cobb-Douglas form, so test of first choice for one form over the other can bed one by analyzing signi- ficance of cross terms in the translog form [10]. To review the economic plausibility of the calculated coefficients of translog form is very difficult job and cumber some due Table 2. OLS and Maximum likelihood estimates for parame- ters of the stochastic frontier (Cobb-Douglas) for Hybrid Maize Producers. Coefficients t-Ratio Variables Parameters OLS MLE OLSMLE Intercept β0 1.24 0.54 1.68*** 0.68ns Land Preparation Cost (LPC) β1 −1.11 −0.09 −2.15** −1.84* NPK (Kg) β2 0.35 0.31 4.31*3.48* Total Irrigation Numberβ3 0.23 0.19 4.97*4.14* Total Chemical Cost β4 0.16 0.19 2.24** 2.87* Total Threshing Cost β5 0.78 0.71 10.75*10.03* Inefficiency ParametersParameters Coefficients t-Ratio Intercept δ0 0.11 1.49ns Farming Experience (Year)δ1 0.0004 0.44ns Education (Year) δ2 −0.001 −0.32ns Credit δ3 0.04 1.07ns Extension Services δ4 −0.03 −0.82ns Maize Cropped Area (Acre)δ5 −0.01 −2.68* Sowing Time δ6 −0.01 −0.32ns to its multifaceted nature. It is, therefore, more suitable to estimate some more easily interpreted estimates [11], oftenly production elasticities of inputs are used also, but here estimated coefficients of translog form are used for coefficients interpretation as Basnayake and Gunaratne [10]. The ML estimates are given in Ta b l e 3 , where coeffi- cient of land preparation cost (LPC), NPK, and total threshing showed significant effect on output. However, the coefficient of NPK Sqr and total threshing cost Sqr were negative. The mean technical efficiency obtained from the trans- log function was 94.10 percent. No one of the parameters in the inefficiency model showed significant effect on inefficiency. Outcome for inefficiency parameters are also given in Table 3. Technical efficiency estimates by Cobb- Douglas and translog models are at variance immensely. The Translogrithmic function shows more robustness over the Cobb-Douglas because the mean technical efficiency from the Cobb-Douglas model was 81.06 percent while the translog model showed a mean technical efficiency of 94.10 percent. Tab le 4 shows distribution of technical efficiencies for various farm groups. Technical efficiency ranges from as low as 0.75 percent to as high as 0.96 percent. 4. CONCLUSION The primary objective of this study was to evaluate te- chnical efficiency of hybrid maize farmers of District Chi- niot and to discover their inefficiency factors. Results ob- tained showed that from the stochastic frontier estimation, the average technical efficiency given by the Cobb-Douglas Copyright © 2013 SciRes. OPEN A CCES S 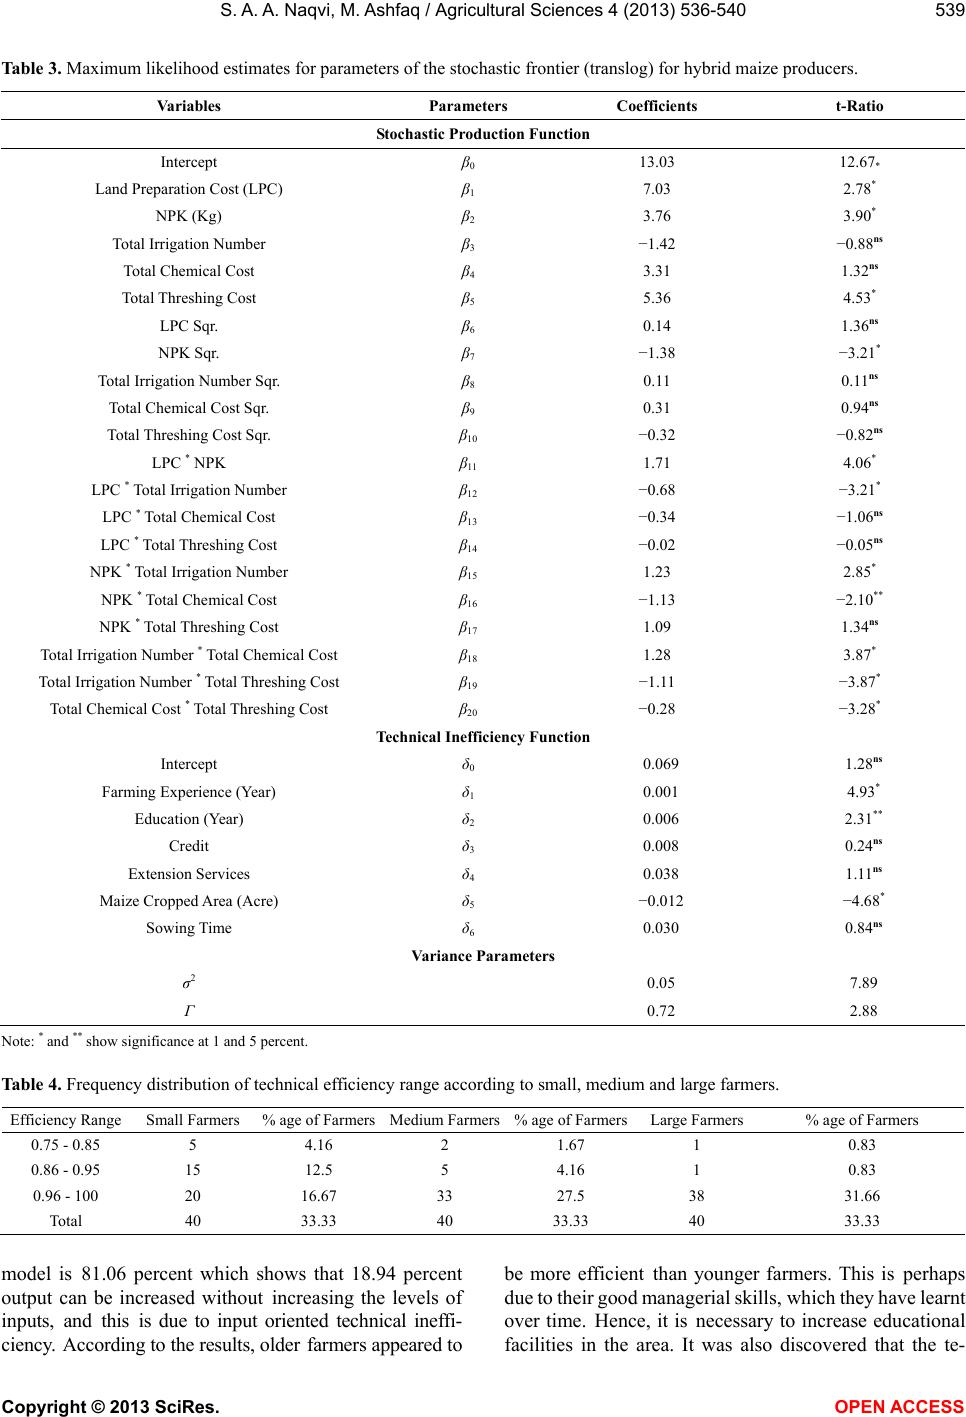 S. A. A. Naqvi, M. Ashfaq / Agricultural Sciences 4 (2013) 536-540 Copyright © 2013 SciRes. OPEN A CCES S 539 Table 3. Maximum likelihood estimates for parameters of the stochastic frontier (translog) for hybrid maize producers. Variables Parameters Coefficients t-Ratio Stochastic Production Function Intercept β0 13.03 12.67* Land Preparation Cost (LPC) β1 7.03 2.78* NPK (Kg) β2 3.76 3.90* Total Irrigation Number β3 −1.42 −0.88ns Total Chemical Cost β4 3.31 1.32ns Total Threshing Cost β5 5.36 4.53* LPC Sqr. β6 0.14 1.36ns NPK Sqr. β7 −1.38 −3.21* Total Irrigation Number Sqr. β8 0.11 0.11ns Total Chemical Cost Sqr. β9 0.31 0.94ns Total Threshing Cost Sqr. β10 −0.32 −0.82ns LPC * NPK β11 1.71 4.06* LPC * Total Irrigation Number β12 −0.68 −3.21* LPC * Total Chemical Cost β13 −0.34 −1.06ns LPC * Total Threshing Cost β14 −0.02 −0.05ns NPK * Total Irrigation Number β15 1.23 2.85* NPK * Total Chemical Cost β16 −1.13 −2.10** NPK * Total Threshing Cost β17 1.09 1.34ns Total Irrigation Number * Total Chemical Cost β18 1.28 3.87* Total Irrigation Number * Total Threshing Cost β19 −1.11 −3.87* Total Chemical Cost * Total Threshing Cost β20 −0.28 −3.28* Technical Inefficiency Function Intercept δ0 0.069 1.28ns Farming Experience (Year) δ1 0.001 4.93* Education (Year) δ2 0.006 2.31** Credit δ3 0.008 0.24ns Extension Services δ4 0.038 1.11ns Maize Cropped Area (Acre) δ5 −0.012 −4.68* Sowing Time δ6 0.030 0.84ns Variance Parameters σ2 0.05 7.89 Γ 0.72 2.88 Note: * and ** show significance at 1 and 5 percent. Table 4. Frequency distribution of technical efficiency range according to small, medium and large farmers. Efficiency Range Small Farmers % age of Farmers Medium Farmers% age of FarmersLarge Farmers % age of Farmers 0.75 - 0.85 5 4.16 2 1.67 1 0.83 0.86 - 0.95 15 12.5 5 4.16 1 0.83 0.96 - 100 20 16.67 33 27.5 38 31.66 Total 40 33.33 40 33.33 40 33.33 model is 81.06 percent which shows that 18.94 percent output can be increased without increasing the levels of inputs, and this is due to input oriented technical ineffi- ciency. According to the results, older farmers appeared to be more efficient than younger farmers. This is perhaps due to their good managerial skills, which they have learnt over time. Hence, it is necessary to increase educational facilities in the area. It was also discovered that the te-  S. A. A. Naqvi, M. Ashfaq / Agricultural Sciences 4 (2013) 536-540 540 chnical efficiency estimates are highly responsive to the functional form specified because the Cobb-Douglas and translog models resulted in dissimilar technical efficien- cies. Although Cobb-Douglas specification gives constant returns to scale, it is widely accepted in the literature. REFERENCES [1] Tahir, M., Tanveer, A., Ali, A., Abbas, M. and Wasaya, A. (2008) Comparative yield performance of different maize (Zea mays L.) hybrids under local conditions of Faisala- bad-Pakistan. Pakistan Journal of Life and Social Scienc- es, 6, 118-120. [2] Government of Pakistan (GOP) (2012) Pakistan Econo- mic Survey 2011-12. Economic Advisor’s Wing, Finance Division, Islamabad. [3] Parikh, A. and Shah, M.K. (1994) Measurement of tech- nical efficiency in the north-west frontier provinces of Pa- kistan. Journal on Agricultural Economics, 45, 132-138. http://dx.doi.org/10.1111/j.1477-9552.1994.tb00384.x [4] Farrell, M. (1957) The measurement of productivity effi- ciency. Journal of the Royal Statistical Society. Series A (General), 120, 253-290. http://dx.doi.org/10.2307/2343100 [5] Coelli, T.J. (1996) A guide to frontier version 4.1 a com- puter program for stochastic frontier production and cost function estimation. CEPA Working Papers, 96/07, Uni- versity of New England, New England, 135. [6] Battese, G.E. and Coelli, T.J. (1995) A model for technical efficiency effects in astochastic frontier production func- tion for panel data. Empirical Economics, 20, 325-332. http://dx.doi.org/10.1007/BF01205442 [7] Greene, W.H. (2003) Econometric analysis. 5th Edition, Prentice Hall, Upper Saddle River. [8] Hassan, S. (2004) An analysis of technical efficiency of wheat farmers in the mixed farming system of the Pun- jab Pakistan. Ph.D. Thesis, Department of Environmental and Resource Economics (Farm Management), Univer- sity of Agriculture, Fasialabad. [9] Dey, M.M., Paraguas, F.J., Kambewa, P. and Pemsl, D.E. (2010) The impact of integrated aquaculture-agriculture on small-scale farms in Southern Malawi. Agricultural Economics, 41, 67-79. http://dx.doi.org/10.1111/j.1574-0862.2009.00426.x [10] Basnayake, B.M.J.K. and Gunaratne, L.H.P. (2002) Esti- mation of technical efficiency and it’s determinants in the tea small holding sector in the mid country wet zone of Sri Lanka. Sri Lankan Journal of Agricultural Economics, 4, 137-150. [11] Ngwenya, S.A., Battese, G.E. and Fleming, E.M. (1997) The relationship between farm size and the technical in- efficiency of production of wheat farmers in the Eastern Free State. Agrekon, 36, 283-301. http://dx.doi.org/10.1080/03031853.1997.9523466 Copyright © 2013 SciRes. OPEN A CCES S |