

Paper Menu >>
Journal Menu >>
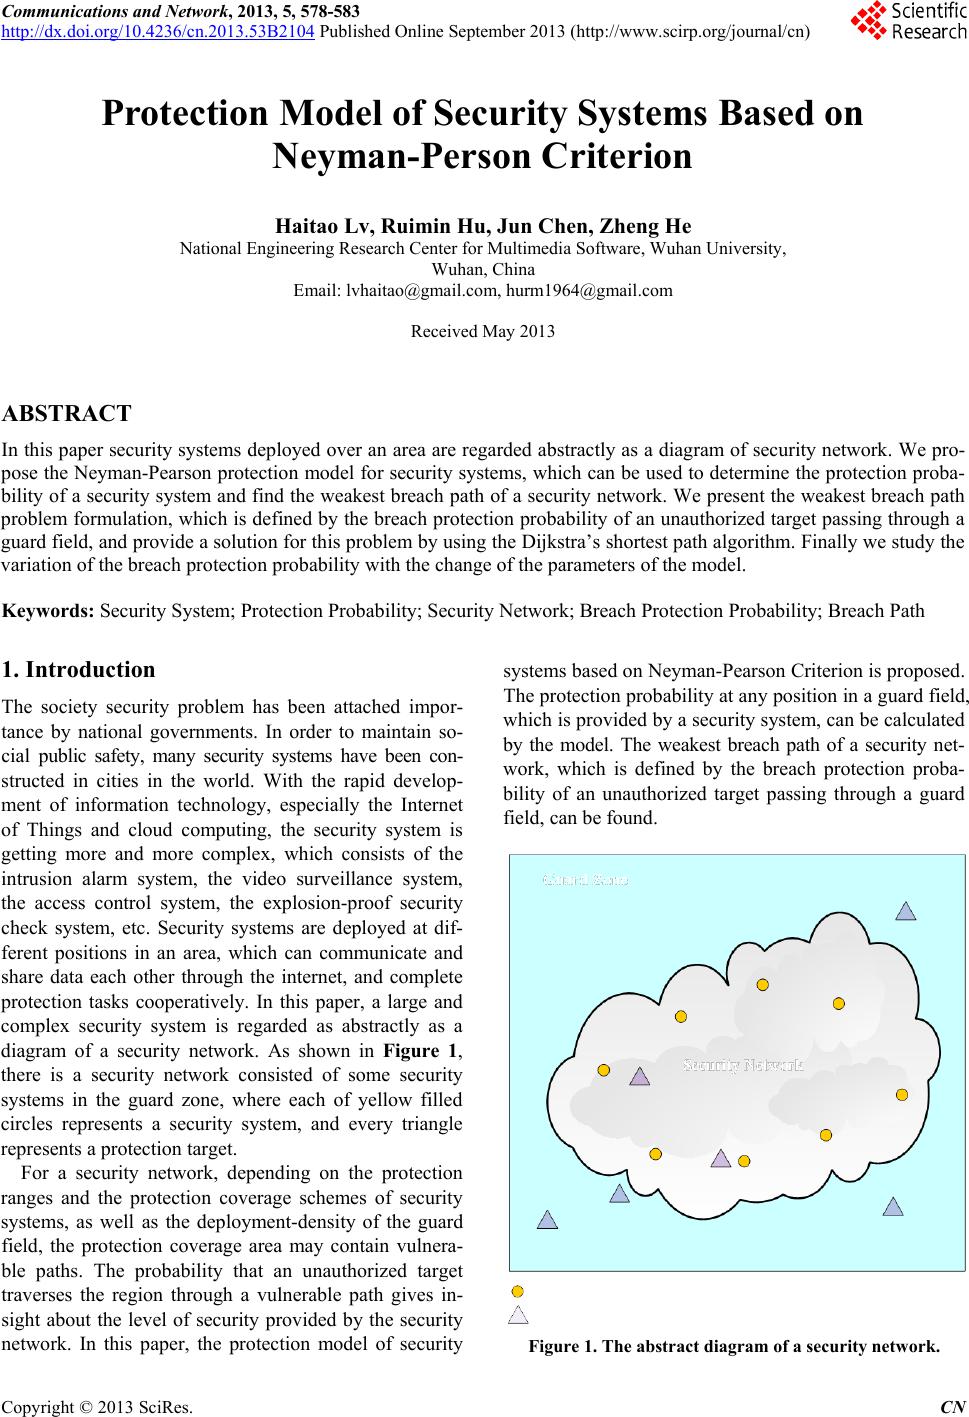 Communications and Network, 2013, 5, 578-583 http://dx.doi.org/10.4236/cn.2013.53B2104 Published Online September 2013 (http://www.scirp.org/journal/cn) Copyright © 2013 SciRes. CN Protection Model of Security Systems Based on Neyman-Person Criterion Haitao Lv, Ruimin Hu, Jun Chen, Zheng He National Engineering Research Center for Multimedia Software, Wuhan University, Wuhan, China Email: [email protected], [email protected] Received May 2013 ABSTRACT In this paper security systems deployed over an ar e a are rega r ded abstractly as a diagram of security network. We pro- pose the Neyman-Pearson protection model for security systems, which can be used to determine the protection proba- bility of a security system and find the weakest breach path of a security network. We present the weakest breach path problem formulation, which is defined by the breach protection probability of an unauthorized target passing through a guard field, and provide a solution for this problem by using the Dijkstra’s shortest path algorithm. Finally we study the variation of the breach pro tection prob ability w ith the change of th e parameters of the model. Keywords: Security System; Protection Probability; Security Network; Breach Protection Probability; Breach Path 1. Introduction The society security problem has been attached impor- tance by national governments. In order to maintain so- cial public safety, many security systems have been con- structed in cities in the world. With the rapid develop- ment of information technology, especially the Internet of Things and cloud computing, the security system is getting more and more complex, which consists of the intrusion alarm system, the video surveillance system, the access control system, the explosion-proof security check system, etc. Security systems are deployed at dif- ferent positions in an area, which can communicate and share data each other through the internet, and complete protection tasks cooperatively. In this paper, a large and complex security system is regarded as abstractly as a diagram of a security network. As shown in Figure 1, there is a security netwo rk consisted of some security systems in the guard zone, where each of yellow filled circles represents a security system, and every triangle represents a protection target. For a security network, depending on the protection ranges and the protection coverage sch emes of security systems, as well as the deployment-density of the guard field, the protection coverage area may contain vulnera- ble paths. The probability that an unauthorized target traverses the region through a vulnerable path gives in- sight about the level of security provided by the security network. In this paper, the protection mo del of security systems based on Neyman-Pearso n Criterion is proposed. The protection probability at any position in a guard field, which is provided by a security system, can be calculated by the model. The weakest breach pa th of a security net- work, which is defined by the breach protection proba- bility of an unauthorized target passing through a guard field, can be found. Figure 1. The abstract diagram of a security network. 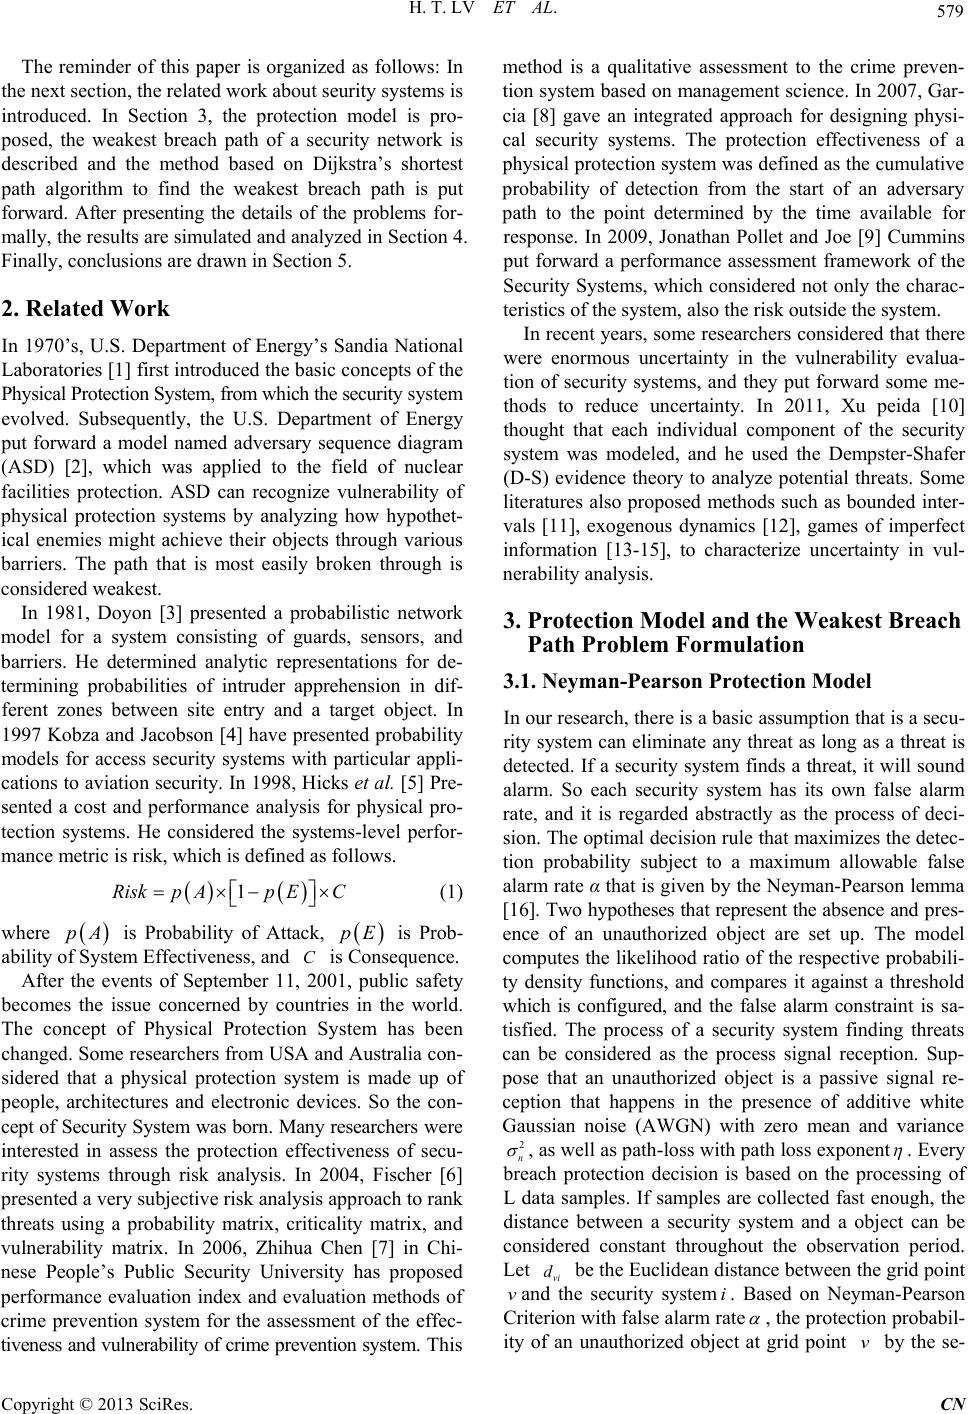 H. T. LV ET AL. Copyright © 2013 SciRes. CN 579 The r eminder of this paper is organized as follows: In the next section, the related work about seurity systems is introduced. In Section 3, the protection model is pro- posed, the weakest breach path of a security network is described and the method based on Dijkstra’s shortest path algorithm to find the weakest breach path is put forward. After presenting the details of the problems for- mally, th e results ar e simulated and analyzed in Section 4. Finally, conclusions are drawn in Section 5. 2. Related Work In 1970’s, U.S. Department of Energy’s Sandia National Laboratories [1] first introduced the basic concepts of the Physical Protection System, from which th e security system evolved. Subsequently, the U.S. Department of Energy put forward a model named adversary sequence diagram (ASD) [2], which was applied to the field of nuclear facilities protection. ASD can recognize vulnerability of physical protection systems by analyzing how hypothet- ical enemies might achieve their objects through various barriers. The path th at is most easily broken through is considered weakest. In 1981, Doyon [3] presen ted a probabilistic network model for a system consisting of guards, sensors, and barriers. He determined analytic representations for de- termining probabilities of intruder apprehension in dif- ferent zones between site entry and a target object. In 1997 Kobza and Jacobson [4] have presented probability models for access security systems with particular appli- cations to aviation security. In 1998, Hicks et al. [5] Pre- sented a cost and performance analysis for ph ysical pro- tection systems. He considered the systems-level perfor- mance metric is risk, which is defined as follows. ( )() 1RiskpAp EC= ×−× (1) where ( ) pA is Probability of Attack, ( ) pE is Prob- ability of System Effectiven ess, and C is Consequence. After the events of September 11, 2001, public safety becomes the issue co ncerned by countries in the world. The concep t of Physical Protection Syste m has been changed. Some researchers from USA and Australia con- side red that a ph ysical protection system is made up of people, architectures and electronic devices. So the con- cept of Security Sys te m was born. Many researcher s were interested in assess the protection effectiveness of secu- rity systems through risk analysis. In 2004, Fische r [6] presented a very subj ectiv e risk analysis approach to rank threats using a probability matrix, criticality matrix, and vulnerability matrix. In 2006, Zhihua Chen [7] in Chi- nese Peop l e ’s P ub lic Security Univ ersity h as proposed performance evaluation index and evaluation methods of crime prevention system for the assessment of the effec- tiveness and vulnerability of crime prevention system. This method is a qualitative assessment to the crime preven- tion system based on management science. In 2007, Gar- cia [8] gave an integrated approach f or designing physi- cal security systems. The protection effectiveness of a physical protection system was defined as the cumulative probability of detection fro m th e star t of an adversary path to th e point determined by the time available for response. In 2009, Jonathan Pollet and Joe [9] Cummins put forward a performance assessment framework of the Security Systems, which considered not only the charac- teristics of the system, also the ris k outsid e the system. In recent years, some researcher s considered that the re were enormous uncertainty in the vulnerability evalua- tion of security systems, and they put forward some me- thods to reduce unc er tain ty. In 2011, Xu peida [10] thought that each individual component of the security system w as modeled, and he used the Dempster-Shafer (D-S) evidence theory to analyze potential threats. Some literatures also proposed methods such as bounded inter- vals [11], exoge n ous dynamics [12], games of imperfect information [13-15], to characterize uncertainty in vul- nerability analysis. 3. Protection Model and the Weakest Breach Path Problem Formulation 3.1. Neyman-Pearson Protectio n Model In our research, th er e is a basic assumption that is a secu- rity system can eliminate any threat as long as a threat is detected. If a security system finds a threat, it will sound alarm. So each security system has its own false alarm rate, and it is regarded abstractly as the process of deci- sion. The optimal decision rule that maximizes the detec- tion probability subject to a maximum allowable false alarm rate α that is given by the Neyman-Pearson lemma [16]. Two hypotheses that represent th e ab sen ce and pr e s- ence of an unauthorized object are set up. The model computes the likelihood ratio of the respective probabili- ty density functions, and compares it against a threshold which is configured, and the false alarm constraint is sa- tisfied. The process of a security system finding threats can be considered as the process signal reception. Sup- pose that an unauthorized object is a passive signal re- ception th a t happens in the presence of additive white Gaussian noise (AWGN) with zero mean and variance 2 n σ , as well as path-loss with path loss exponent η . Every breach protection decision is based on the processing of L data samples. If samples are collected fast enough, the distance between a security system and a object can be considered constant throughout the observation period. Let vi d be the Euclidean distance between the grid point v and the security system i . Based on Neyman-Pearson Criterion with false alarm rate α , the pro tection probabil- ity of an unauthorized object at grid point v by the se- 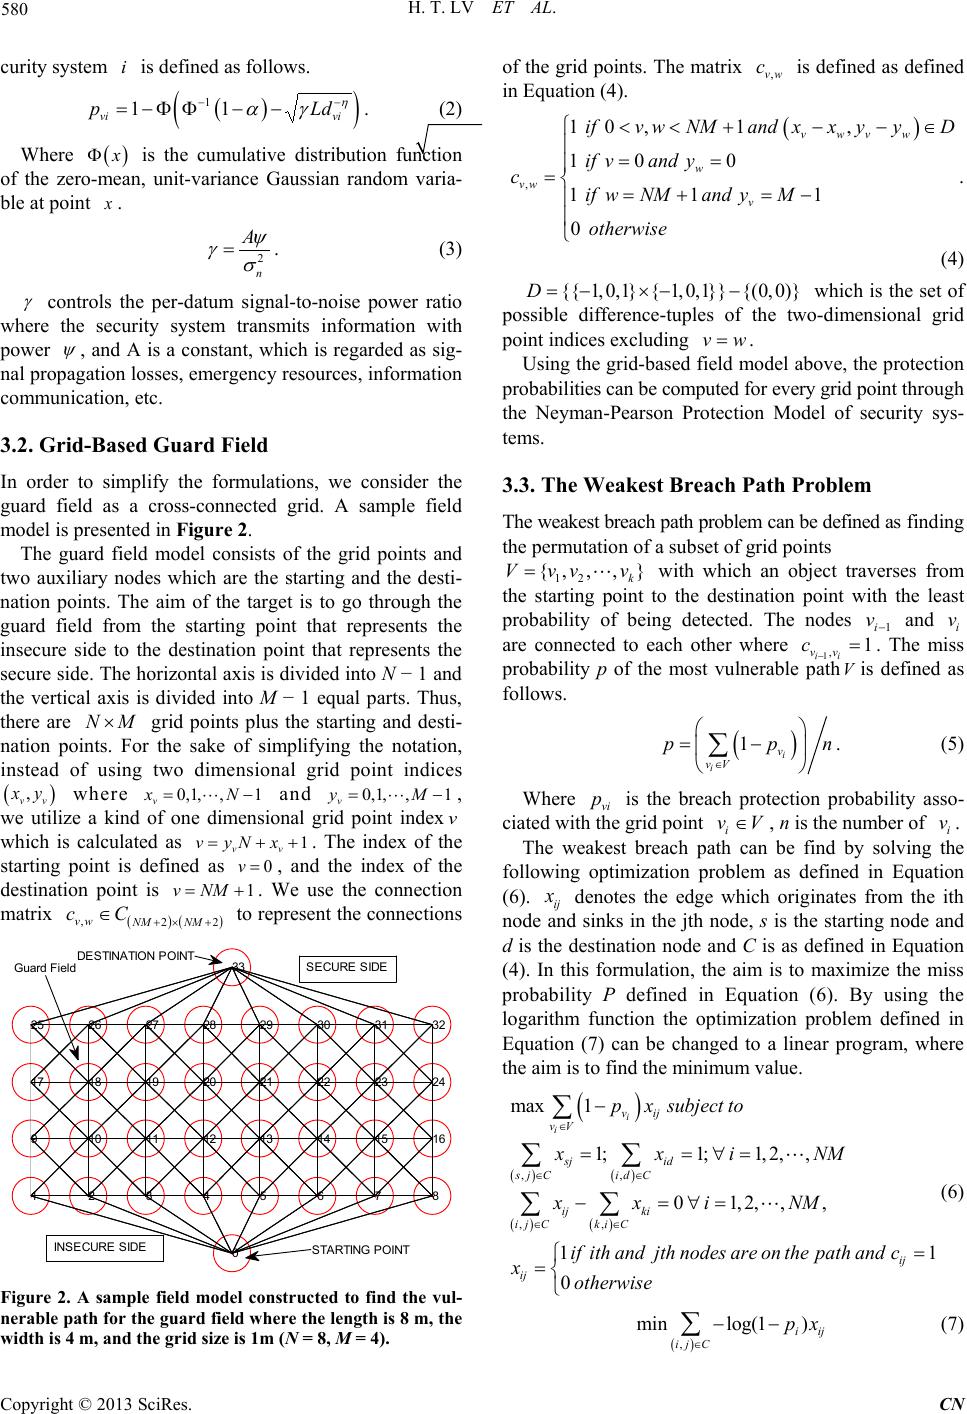 H. T. LV ET AL. Copyright © 2013 SciRe s. CN 580 curity system i is defined as follows. ( ) () 1 11 vi vi p Ld η αγ −− =−Φ Φ−− . (2) Where ( ) xΦ is the cumulative distribution function of the zero-mean, unit-variance Gauss i an random varia- ble at point x . 2 n A ψ γσ =. (3) γ controls the per-datum signal-to-noise power r atio where the security system transmits information with power ψ , and A is a cons tant, which is regarded as sig - nal propagation losses, emergency res o urces, infor mation communication, etc. 3.2. Grid-Based Guard Field In ord er to simplify the formulations, we consider the guard field as a cross-connected grid. A sa mple field model is pre s ented in Figure 2. The guard field model consists of the grid points and two auxiliary nodes which are the starting and the desti- nation points. The aim of the target is to go through the guard field from the starting point that represents the insecure side to the destination point that represents the secure side. The horizontal axis is divided into N − 1 and the vertical axis is divided into M − 1 equal parts . Thus, there are NM× grid points plus the starting and desti- nation points. For the sake of simplifying the notation, instead of us ing two dimensional grid point indices ( ) , vv xy where 0,1, ,1 v xN= − and 0,1, ,1 v yM= − , we utilize a kind of one dimensional grid point index v which is calculated as 1 vv v yN x= ++ . The index of the starting point is defin ed as 0v= , a nd th e index of the destination point is 1v NM= + . We use the connection matrix ( )( ) , 22 vw NM NM cC +× + ∈ to represent the connections Figure 2. A sample field model constructed to find the vul- nerable pat h for the guar d field whe re the le ngth is 8 m, the width is 4 m, and the grid size is 1m (N = 8, M = 4). of the grid points. The matrix ,vw c is defi n ed as defin ed in Equation (4). ( ) , 10, 1, 10 0 111 0 v wvw w vw v ifv wNMandxxyyD if vand y cifwNMandyM otherwise <<+ −−∈ = = = =+ =− . (4) {{ 1,0,1}{ 1,0,1}}{(0,0)}D= −×−− which is the set of possible difference-tuples of the two-dimensional grid point indices excluding vw= . Using the grid-based field model above, the protection probabilities can be computed for every grid point through the Neyman-Pearson Protection Model of security sys- tems. 3.3. The Weakest Breach Path Problem The weakest breach path problem can be defined as fin ding the permutation of a subset of grid points 12 {,,, } k V vvv= with which an object traverses from the starting point to the destination point with the least probability of be in g detected. The nodes 1i v− and i v are connected to each other where 1,1 ii vv c−=. The miss probability p of the most vulnerable pathVis defined as follows. ( ) 1i i v vV p pn ∈ = − ∑. (5) Where vi p is the breach protection probability asso- ciated with the grid point i vV∈ , n is the number of i v . The weakest breach path can be find by solving the following optimization problem as defined in Equation (6). ij x denotes the edg e which originates from the ith node and sinks in the jth node, s is the starting node and d is the destination node and C is as defined in Equation (4). In this formulation , the aim is to maximize the miss probability P defined in Equation (6). By using the logarithm function the optimization problem defined in Equation (7) can be changed to a linear program, where the aim is to find the minimum value. ( ) ()( ) ( )( ) ,, ,, max 1 1;1;1, 2,, 01, 2,,, 11 0 i i v ij vV sj id s jCidC ij ki ij Cki C ij ij pxsubject to xx iNM xx iNM ifith andjth nodes areonthepath andc xotherwise ∈ ∈∈ ∈∈ − = = ∀ = −= ∀ = = = ∑ ∑∑ ∑∑ (6) ( ) , minlog(1 ) i ij ij C px ∈ −− ∑ (7 ) 0 1 9 17 25 2 10 18 26 3 11 19 27 4 12 20 28 5 13 21 29 6 14 22 30 7 15 23 31 8 16 24 32 33 Guard Fi el dS ECURE SIDE INSECURE S IDES TARTING P O INT DE STINA TION P O INT 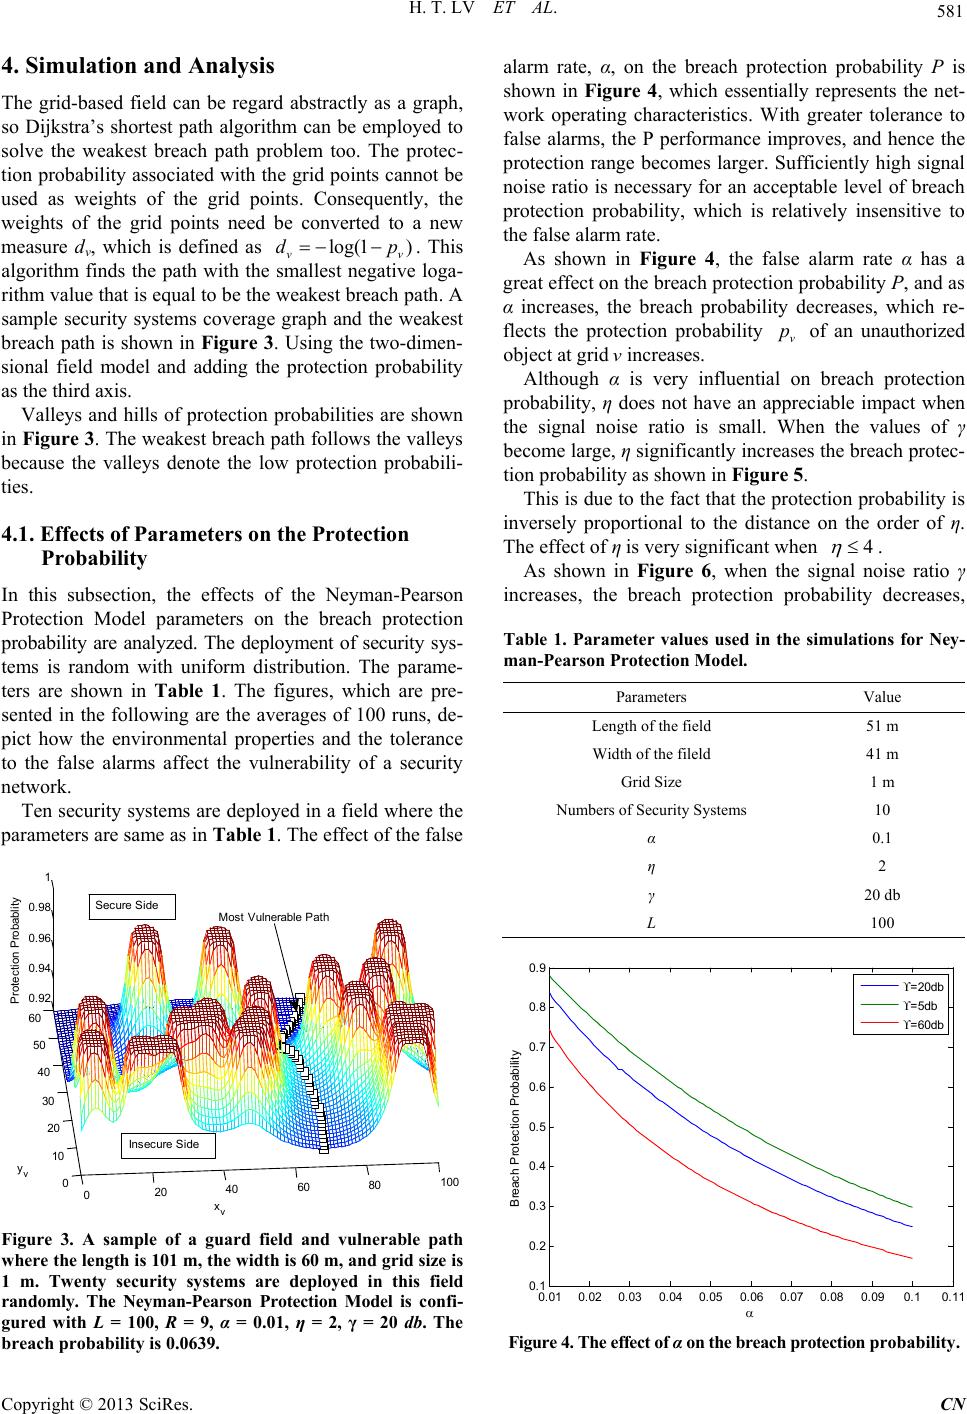 H. T. LV ET AL. Copyright © 2013 SciRes. CN 581 4. Simulation and Analysis The grid-based field can be regard abstractly as a graph, so Dijkstr a’s shortest path algorithm can be employed to solve the weakest breach path problem too. The protec- tion probability asso ciated with the grid points cannot be used as we ights of the grid points. Consequently, the weights of the grid points need be converte d to a new measure dv, which is defined as log(1 ) vv dp=−− . This algorithm finds the path with the smallest negative loga- rithm value that is equal to be the weakest breach path. A sample security systems co verag e graph and the weakest breach path is shown in Figure 3. Using the two-dimen- sional field model and adding the protection prob ab ility as the third axis. Valleys and hills of protection probabilities are shown in Figure 3. The weakest breach path follows the valleys because the valleys denote the low protection probabili- ties. 4.1. Effects of Parameters on the Protection Probability In this subsection, the effects of the Neyman-Pearson Protection Model parameters on the breach protection probability are analyzed. The deployment of security sys- tems is random with uniform distribution. The parame- ters are shown in Table 1. The figures, which are pre- sented in the following are the averages of 100 runs, de- pict how the environmental properties and th e toleran c e to the false alarms affect the vulnerability of a security network. Ten security systems are deplo yed in a field where the parameters are same as in Ta ble 1. The effect of the false Figure 3. A sample of a guard field and vulnerable path where the length i s 101 m, the widt h is 60 m, and grid si ze is 1 m. Twenty security systems are deployed in this field randomly. The Neyman-Pearson Protection Model is confi- gured with L = 100, R = 9, α = 0.01, η = 2, γ = 20 db. The breach probability is 0.0639. alarm rate, α, on the breach protection probability P is shown in Figure 4, which essen tially r epr esents the net- work operating characteristics. With greater tolerance to false alarms, the P performance improves, and hence the protection range becomes larger. Sufficiently high signal noise ratio is necessary for an acceptable level of breach protection probability, whi ch is relatively insensitive to the false alarm rate. As shown in Figure 4, the false alarm rate α has a great effect on the breach protection probability P, and as α increases, the breach probability decreases, which re- flects the protection probability v p of an unauthorized object at grid v increases. Although α is very in fluentia l on br each protection probability, η does not have an appreciable impact when the signal noise ratio is small. When the values of γ become large, η significantly increases the breach protec- tion probability as shown in Fig ure 5. This is due to the fact that the protection probability is inversely proportional to the distance on the order of η. The effect of η is very significant when 4 η ≤ . As shown in Figu re 6, wh en the signal noise ratio γ incre a ses, the breach protection probability decreases, Table 1. Parameter values used in the simulations for Ney- man-Pearson Protection Model. Parameters Value Length of the field 51 m Width of the fileld 41 m Grid Size 1 m Numbers of Security Systems 10 α 0.1 η 2 γ 20 db L 100 Figure 4. The effect of α on th e b rea ch p rot ecti on probability. 020 40 60 80 100 0 10 20 30 40 50 60 0.92 0.94 0.96 0.98 1 x v y v Protec tion P robabl i ty Most V ul nerabl e P ath Secure S i de Insecure Si de 0.01 0.02 0.03 0.04 0.05 0.06 0.07 0.08 0.09 0.1 0.11 0.1 0.2 0.3 0.4 0.5 0.6 0.7 0.8 0.9 B reac h Prot ec tion Probabil i t y α ϒ =20db ϒ =5db ϒ =60db 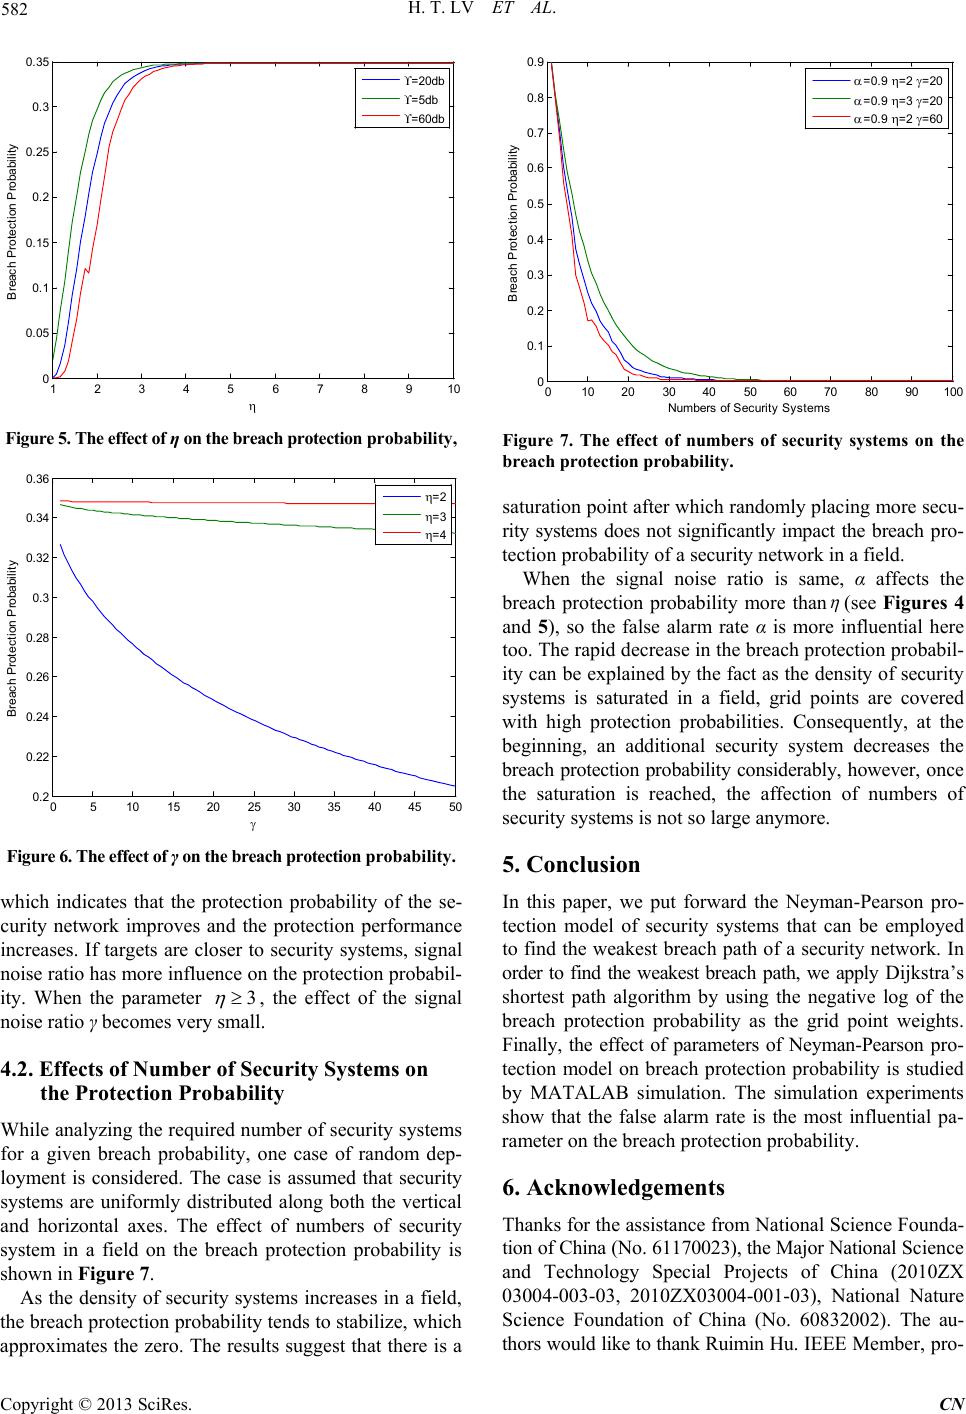 H. T. LV ET AL. Copyright © 2013 SciRe s. CN 582 Figure 5. The effect of η on the breach protection probability, Figure 6. The effect of γ on the breach protection probability . which indicates that the protection probability of the se- curity netwo rk improves and the protection performance increases. If targets are closer to security systems, signal noise ratio has more influence on the protection probabil- ity. When th e parameter 3 η ≥ , the effect of the signal noise ratio γ becomes very small. 4.2. Effects of Number of Security Systems on the Protection Probability While analyzing the required number of security systems for a given breach probability, one case of random dep- loyment is considered. The case is assumed that security systems are uniformly distributed alon g bo th the vertical and horizontal axes . The effect of numbers of security system in a field on the breach protection prob ability is shown in Figure 7. As the density of security systems increases in a field, the breach protection probability tends to stabilize, which approximates the zero. The results suggest that there is a Figure 7. The effect of numbers of security systems on the breach protection probability. saturation point after which randomly placing more secu- rity systems does not significantly impact the breach pro- tection probability of a secu rity network in a field. When the signal noise ratio is same, α affects the breach protection probability more than η (see Figures 4 and 5), so the false alarm rate α is more influential here too. The rapid d ecreas e in the breach protection probabil- ity can be explained by the fact as the density of security systems is saturated in a field, grid points are cover ed with high protection probabilities. Consequently, at the beginning, an additional security system decreases the breach protection probability considerably, however, once the saturation is reached, the affection of numbers of security systems is not so large anymore. 5. Conclusion In this paper, we put forward the Neyman-Pearson pro- tection model of security systems that can be employed to find the weakest breach path of a security network. In order to f in d the weakest breach path, we apply Dijkstra’s shortest path algorithm by using the negative log of the breach protection probability as the grid point weights. Finally, the effect of para met ers of N eyman-Pearson pro- tection model on breach protection probability is studied by MATALAB simulation. The simulation experiments show that the false alarm rate is the most influential pa- rameter on the breach protection prob ability. 6. Acknowledgements Thanks for the assistance from National Science Founda- tion of China (No. 61170023), the Major Nat ional Science and Technology Special Projects of China (2010ZX 03004-003-03, 2010ZX03004-001-03), National Nature Science Foundation of China (No. 60832002). The au- thors would like to thank Ruimin Hu. IEEE Member, pro- 12345678910 0 0.05 0.1 0.15 0.2 0.25 0.3 0.35 B reac h Protect i on Probabil i t y η ϒ =20db ϒ =5db ϒ =60db 051015 2025 30 35 40 4550 0.2 0.22 0.24 0.26 0.28 0.3 0.32 0.34 0.36 B reac h Protect i on Probabil i t y γ η=2 η=3 η=4 010 20 30 4050 60 70 80 90 100 0 0.1 0.2 0.3 0.4 0.5 0.6 0.7 0.8 0.9 Numbers of S ecurity S yst em s B reac h Prot ec tion Probabil i t y α =0.9 η =2 γ =20 α =0.9 η =3 γ =20 α =0.9 η =2 γ =60 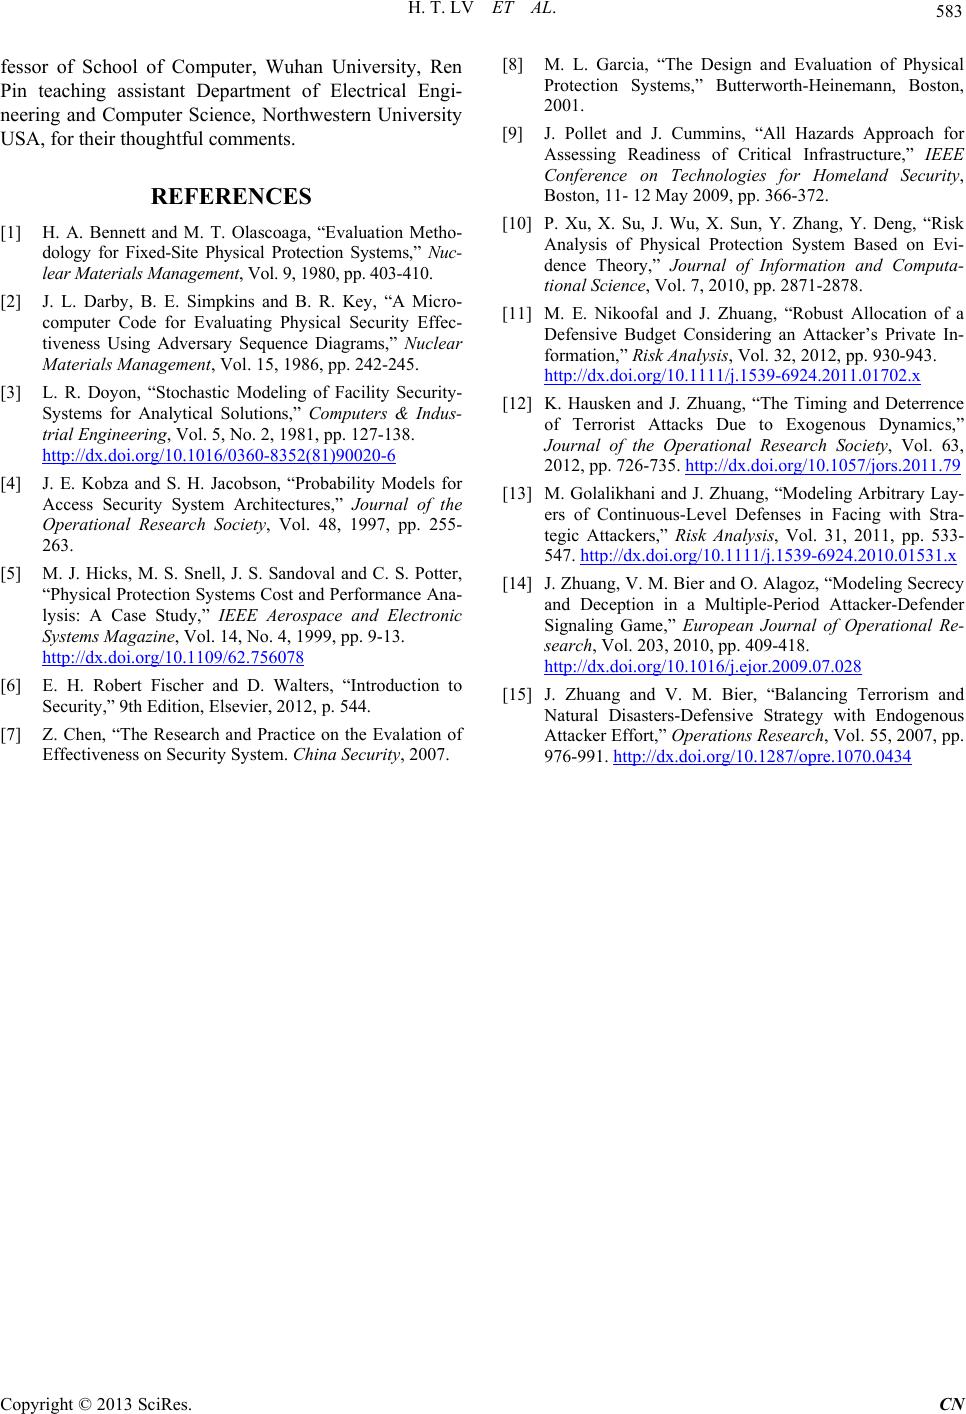 H. T. LV ET AL. Copyright © 2013 SciRes. CN 583 fessor of School of Computer, Wuhan University, Ren Pin teaching assistant Department of Electrical Engi- neering and Computer Science, Northwestern University USA, for their thoughtful comments. REFERENCES [1] H. A. Bennett and M. T. Olascoaga, “Evaluation Metho- dology for Fixed-Site Physical Protection Systems,” Nuc- lear Materials Management, Vol. 9, 1980, pp. 403-410. [2] J. L. Darby, B. E. Simpkins and B. R. Key, “A Mi c ro- computer Code for Evaluating Physical Security Effec- tiveness Using Adversary Sequence Diagrams,” Nuclear Materials Management, Vol. 15, 1986, pp. 242-245. [3] L. R. Doyon, “Stochastic Modeling of Facility Security- Sys tems for Analytical Solutions,” Computers & Indus- trial Engineering, Vol. 5, No. 2, 1981, pp. 127-138. http://dx.doi.org/10.1016/0360-8352(81)90020-6 [4] J. E. Kobza and S. H. Jacobson, “Probability Models for Access Security System Architectures,” Journal of the Operational Research Society, Vol. 48, 1997, pp. 255- 263. [5] M. J. Hicks, M. S. Snell, J. S. Sandoval and C. S. Potter, “Physical Protection Systems Cost and Performance Ana- lysis: A Case Study,” IEEE Aerospace and Electronic Systems Magazine, Vol. 14, No. 4, 1999, pp. 9-13. http://dx.doi.org/10.1109/62.756078 [6] E. H. Robert Fischer and D. Walters, “Introduction to Security,” 9th Edition, Elsevier, 2012, p. 544. [7] Z. Chen, “The Research and Practice on the Evalation of Effectiveness on Security System. China Security, 2007. [8] M. L. Garcia, “The De si gn and Evaluation of Physical Protection Syste ms,” Butterworth-Heinemann, Boston, 2001. [9] J. Pollet and J. Cummins, “All Hazards Approach for Assessing Readiness of Critical Infrastructure,” IEEE Conference on Technologies for Homeland Security, Boston, 11- 12 May 2009, pp. 366-372. [10] P. Xu, X. Su, J. Wu, X. Sun, Y. Zhang, Y. Deng, “Risk Analysis of Physical Protection System Based on Evi- dence Theory,” Journal of Information and Computa- tional Science, Vol. 7, 2010, pp. 2871-2878. [11] M. E. Nikoofal and J. Zhuang, “Robust Allocation of a Defensive Budget Considering an Attacker’s Private In- formation,” Risk Analysis, Vol. 32, 2012, pp. 930-943. http://dx.doi.org/10.1111/j.1539-6924.2011.01702.x [12] K. Hausken and J. Zhuang, “The Timing and Deterrence of Terrorist Attacks Due to Exogenous Dynamics,” Journal of the Operational Research Society, Vol. 63, 2012, pp. 726-735. http://dx.doi.org/10.1057/jors.2011.79 [13] M. Golalikhani and J. Zhuang, “Modeling Arbitrary Lay- ers of Continuous-Level Defenses in Facing with Stra- tegic Attackers,” Risk Analysis, Vol. 31, 2011, pp. 533- 547. http://dx.doi.org/10.1111/j.1539-6924.2010.01531.x [14] J. Zhuang, V. M. Bier and O. Alagoz, “Modeling Secrecy and Deception in a Multiple-Period Attacker-Defender Signaling Gam e,” European Journal of Operational Re- search, Vol. 203, 2010, pp. 409-418. http://dx.doi.org/10.1016/j.ejor.2009.07.028 [15] J. Zhuang and V. M. Bier, “Balancing Terrorism and Natural Disasters-Defensive Strategy with Endogenous Attacker Effort,” Operations Research, Vol. 55, 2007, pp. 976-991. http://dx.doi.org/10.1287/opre.1070.0434 |