

Paper Menu >>
Journal Menu >>
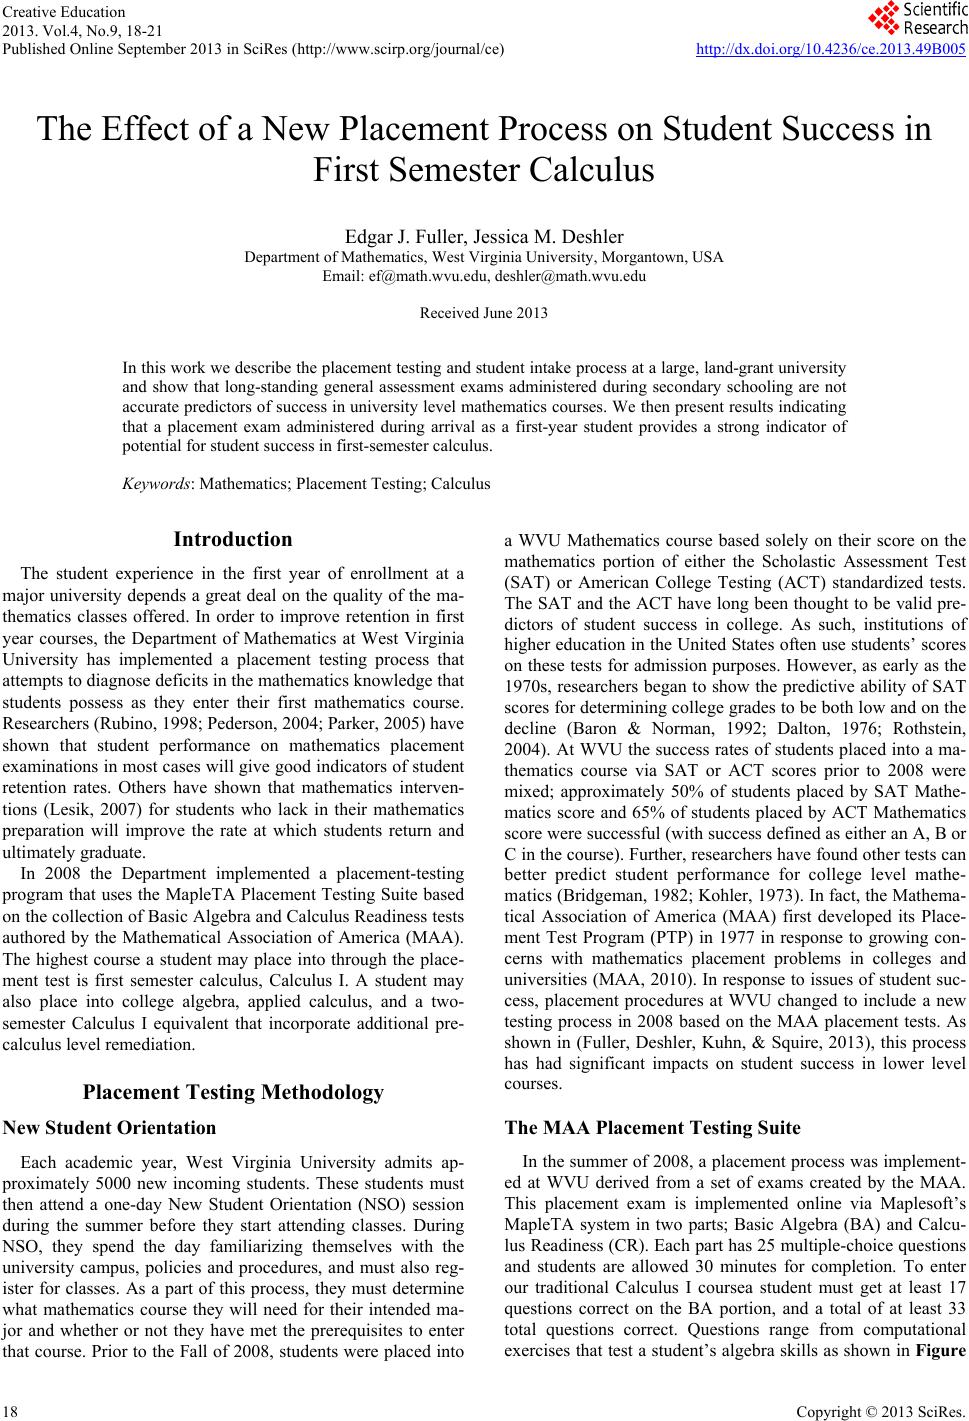 Creative Education 2013. Vol.4, No.9, 18-21 Published Online Septe mber 201 3 in SciRes (http ://www.scirp.org/journal/ce) http://dx.doi.org/10.4236/ce.2013.49B005 Copyright © 2013 SciRes. 18 The Effect of a New Placement Process on Student Success in First Semester Calculus Edgar J. Fu ller, Jessica M. D eshler Department of Mathematics, West Virginia University, Morgantown, USA Email: [email protected] du, [email protected] Received June 2013 In this work we describe the placement testing and student intake process at a large, land-grant university and show that long-standing general assessment exams administered during secondary schooling are not accurate predictors of success in university level mathematics courses. We then present results indicating that a placement exam administered during arrival as a first-year student provides a strong indicator of potential for student success in first-semester calculus. Keywords: Mathematics; Placement Testing; Calculus Introduction The student experience in the first year of enrollment at a major university depends a great deal on the quality of the ma- thematics classes offered. In order to improve retention in first year courses, the Department of Mathematics at West Virginia University has implemented a placement testing process that attempts to diagnose deficits in the mathematics knowledge tha t students possess as they enter their first mathematics course. Researchers (Rubino, 1998; Pederson, 2004; Parker, 2005) have shown that student performance on mathematics placement examinations in most cases will give good indicators of student retention rates. Others have shown that mathematics interven- tions (Lesik, 2007) for students who lack in their mathematics preparation will improve the rate at which students return and ultimately graduate. In 2008 the Department implemented a placement-testing program that uses the MapleTA Placement Testing Suite based on the collection of Basic Algebra and Calculus Readiness tests authored by the Mathematical Association of America (MAA). The highest course a student may place into through the place- ment test is first semester calculus, Calculus I. A student may also place into college algebra, applied calculus, and a two- semester Calculus I equivalent that incorporate additional pre- calculus level remediation. Placement Testing Methodology New Student Orient atio n Each academic year, West Virginia University admits ap- proximately 5000 new incoming students. These students must then attend a one-day New Student Orientation (NSO) session during the summer before they start attending classes. During NSO, they spend the day familiarizing themselves with the university campus, policies and procedures, and must also reg- ister for classes. As a part of this process, they must determine what mathematics course they will need for their intended ma- jor and whether or not they have met the prerequisites to enter that course. Prior to the Fall of 2008, students were placed into a WVU Mathematics course based solely on their score on the mathematics portion of either the Scholastic Assessment Test (SAT) or American College Testing (ACT) standardized tests. The SAT and the ACT have long been thought to be valid pre- dictors of student success in college. As such, institutions of higher education in the United States often use students’ scores on these tests for admission purposes. However, as early as the 1970s, researchers began to show the predictive ability of SAT scores for determining college grades to be both low and on the decline (Baron & Norman, 1992; Dalton, 1976; Rothstein, 2004). At WVU the success rates of students placed into a ma- thematics course via SAT or ACT scores prior to 2008 were mixed; approximately 50% of students placed by SAT Mathe- matics score and 65% of students placed by ACT Mathematics score were successful (with success defined as either an A, B or C in the course). Further, researchers have found other tests can better predict student performance for college level mathe- matics (Bridgeman, 1982; Kohler, 1973). In fact, the Mathema- tical Association of America (MAA) first developed its Place- ment Test Program (PTP) in 1977 in response to growing con- cerns with mathematics placement problems in colleges and universities (MAA, 2010). In response to issues of student suc- cess, placement procedures at WVU changed to include a new testing process in 2008 based on the MAA placement tests. As shown in (Fuller, Deshler, Kuhn, & Squire, 2013), this process has had significant impacts on student success in lower level courses. The MAA Placement Testing Suite In the summer of 2008, a placement process was implement- ed at WVU derived from a set of exams created by the MAA. This placement exam is implemented online via Maplesoft’s MapleTA system in two parts; Basic Algebra (BA) and Calcu- lus Readiness (CR). Each part has 25 multiple-choice questions and students are allowed 30 minutes for completion. To enter our traditional Calculus I coursea student must get at least 17 questions correct on the BA portion, and a total of at least 33 total questions correct. Questions range from computational exercises that test a student’s algebra skills as shown in Figure 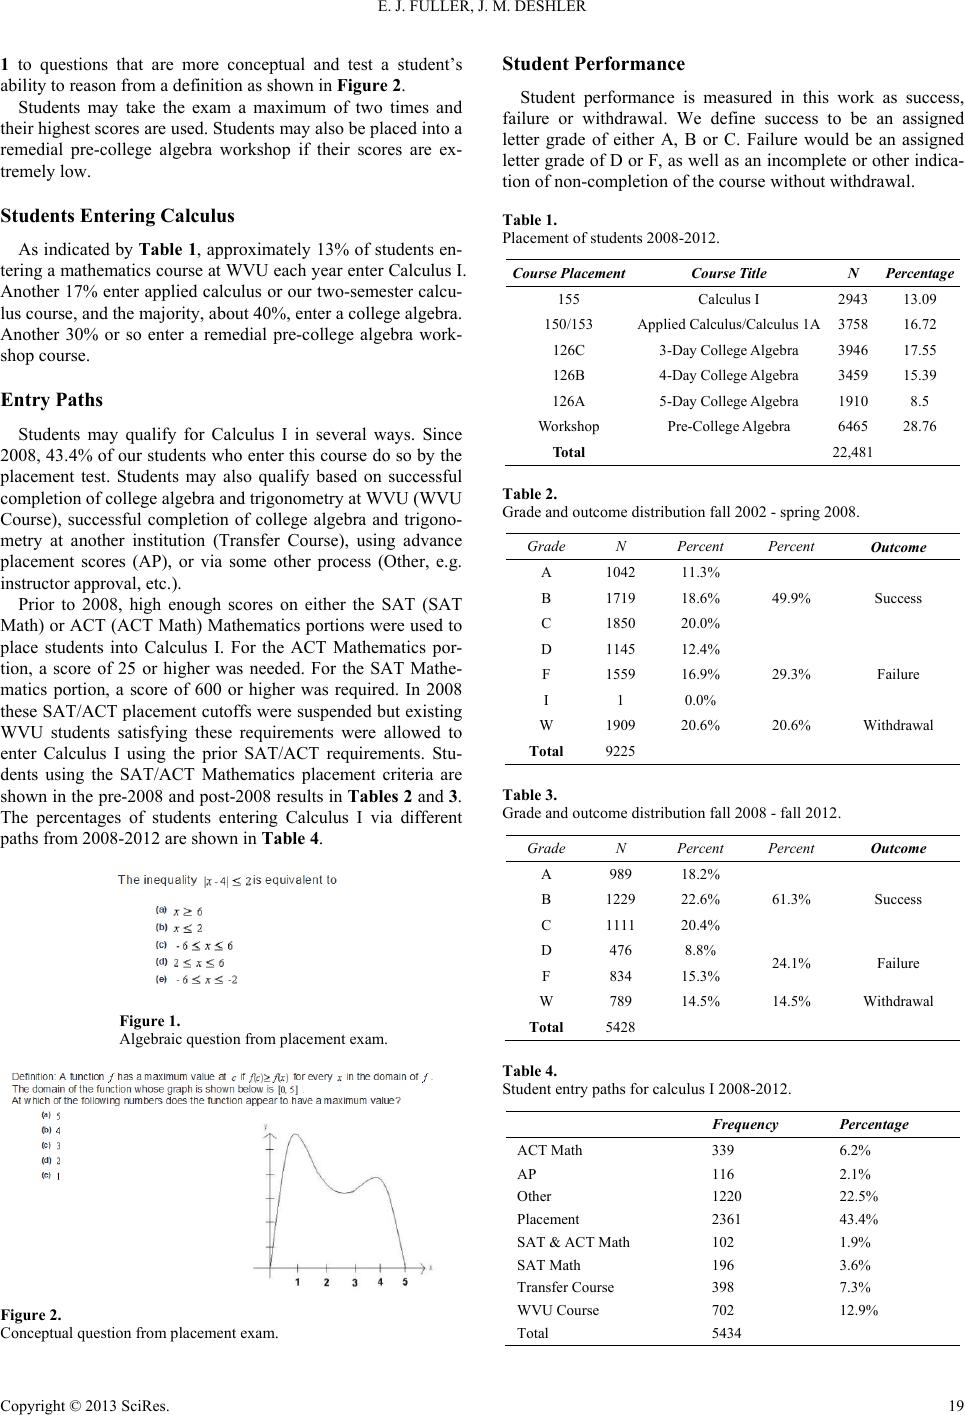 E. J. FULLER, J. M. DESHLER Copyright © 2013 SciRes. 19 1 to questions that are more conceptual and test a student’s ability to reason from a definition as shown in Figure 2. Students may take the exam a maximum of two times and their highest scores are used. Students may al so be pl ace d int o a remedial pre-college algebra workshop if their scores are ex- tremely low. Students Entering Calc ul u s As indicated by Table 1, approximately 13% of students en- tering a mathematics course at WVU each year enter Calculus I. Another 17% enter applied calculus or our two-semester calcu- lus course, and the majority, about 40%, enter a college algebra. Another 30% or so enter a remedial pre-college algebra work- shop course. Entry Paths Students may qualify for Calculus I in several ways. Since 2008, 43.4% of our students who enter this course do so by the placement test. Students may also qualify based on successful completion of college algebra and trigonometry at WVU (WVU Course), successful completion of college algebra and trigono- metry at another institution (Transfer Course), using advance placement scores (AP), or via some other process (Other, e.g. instructor approval, etc.). Prior to 2008, high enough scores on either the SAT (SAT Math) or ACT (ACT Math) Mathematics portions were used to place students into Calculus I. For the ACT Mathematics por- tion, a score of 25 or higher was needed. For the SAT Mathe- matics portion, a score of 600 or higher was required. In 2008 these SAT/ACT placement cutoffs were suspended but existing WVU students satisfying these requirements were allowed to enter Calculus I using the prior SAT/ACT requirements. Stu- dents using the SAT/ACT Mathematics placement criteria are shown in the pre-2008 and post-2008 results in Tables 2 and 3. The percentages of students entering Calculus I via different paths from 2008-2012 are shown in Table 4. Figure 1. Algebraic question from placement exam. Figure 2. Conceptual question from placement exam. Student Performance Student performance is measured in this work as success, failure or withdrawal. We define success to be an assigned letter grade of either A, B or C. Failure would be an assigned letter grade of D or F, as well as an incomplete or other indica- tion of non-completion of the course without withdrawal. Table 1. Placeme nt of students 2008-2012. Course Placement Course Title N Percentage 155 Calculus I 2943 13.09 150/153 Applied Calculus/Calculus 1A 3758 16.72 126C 3-Day College Algebra 3946 17.55 126B 4-Day College Algebra 3459 15.39 126A 5-Day College Algebra 1910 8.5 Workshop Pre-College Algebra 6465 28.76 Total 22,48 1 Table 2. Grade and outcome distribution fall 2002 - spring 2008. Grade N Percent Per cen t Outcome A 1042 11.3% 49.9% Success B 1719 18.6% C 1850 20.0% D 1145 12.4% 29.3% Failure F 1559 16.9% I 1 0.0% W 1909 20.6% 20.6% Withdrawal Total 9225 Table 3. Grade and outcome distribution fall 2008 - fall 2012. Grade N Percent Per cen t Outcome A 989 18.2% 61.3% Success B 1229 22.6% C 1111 20.4% D 476 8.8% 24.1% Failure F 834 15.3% W 789 14.5% 14.5% Withdrawal Total 5428 Table 4. Student entry paths for calculus I 2008-2012. Frequency Per cen t ag e ACT Math 339 6.2% AP 116 2.1% Other 1220 22.5% Placement 2361 43.4% SAT & ACT Math 1 02 1.9% SAT Math 1 96 3.6% Transfer Course 398 7.3% WVU Course 702 12.9% Total 5434 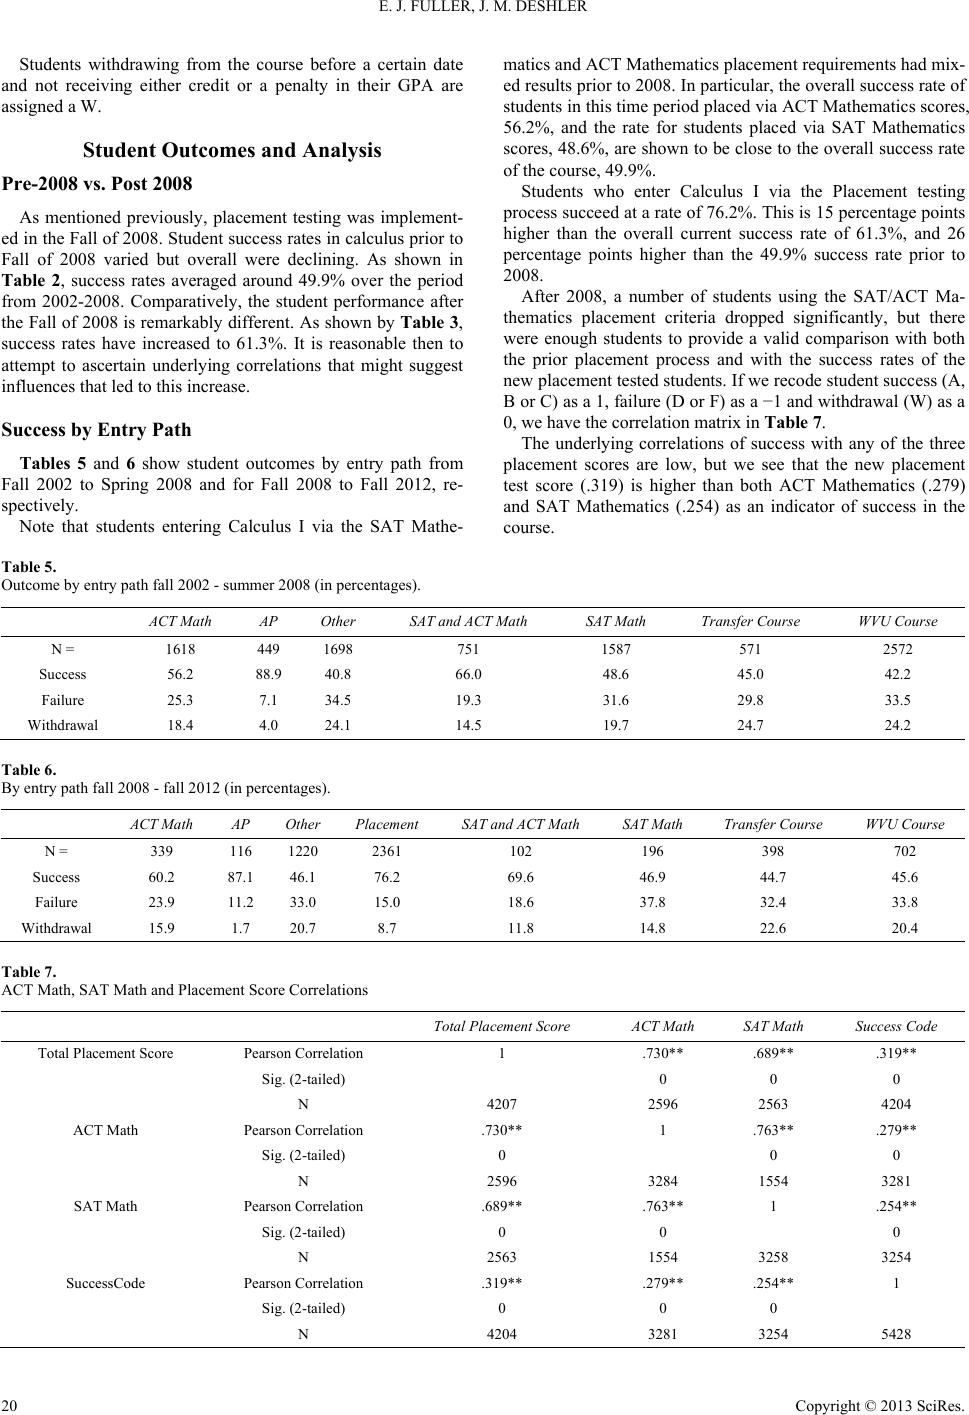 E. J. FULLER, J. M. DESHLER Copyright © 2013 SciRes. 20 Students withdrawing from the course before a certain date and not receiving either credit or a penalty in their GPA are assigned a W. Student Outcomes and Analysis Pre-2008 vs. Post 2008 As mentioned previously, placement testing was implement- ed in the Fall of 2008. Student success rates in calculus prior to Fall of 2008 varied but overall were declining. As shown in Table 2, success rates averaged around 49.9% over the period from 2002-2008. Comparatively, the student performance after the Fall of 2008 is remarkably different. As shown by Table 3, success rates have increased to 61.3%. It is reasonable then to attempt to ascertain underlying correlations that might suggest influences that led to this increase. Success by Entry Path Tables 5 and 6 show student outcomes by entry path from Fall 2002 to Spring 2008 and for Fall 2008 to Fall 2012, re- spectively. Note that students entering Calculus I via the SAT Mathe- matics and ACT Mathematics placement requirements had mix- ed results prior to 2008. In particular, the overall success rate of students in this time period placed via ACT Mathematics scores, 56.2%, and the rate for students placed via SAT Mathematics scores, 48.6%, are shown to be close to the overall success rate of the course, 49.9%. Students who enter Calculus I via the Placement testing process succeed at a rate of 76.2%. This is 15 percentage points higher than the overall current success rate of 61.3%, and 26 percentage points higher than the 49.9% success rate prior to 2008. After 2008, a number of students using the SAT/ACT Ma- thematics placement criteria dropped significantly, but there were enough students to provide a valid comparison with both the prior placement process and with the success rates of the new placement tested students. If we recode student success (A, B or C) as a 1, failure (D or F) as a −1 and withdrawal (W) as a 0, we have the correlation matrix in Table 7. The underlying correlations of success with any of the three placement scores are low, but we see that the new placement test score (.319) is higher than both ACT Mathematics (.279) and SAT Mathematics (.254) as an indicator of success in the course. Table 5. Outcome by entry path fall 2002 - summer 2008 (in percentages). ACT Math AP Other SAT and ACT Math SAT M ath Transfer Course WVU C ourse N = 1618 449 1698 751 1587 571 2572 Success 56.2 88.9 40.8 66.0 48.6 45.0 42.2 Failure 25.3 7.1 34.5 19.3 31.6 29.8 33.5 Withdrawal 18.4 4.0 24.1 14.5 19.7 24.7 24.2 Table 6. By entry path fall 2008 - fall 2012 (in percentages). ACT Math AP Ot h er Pl a cemen t SAT and ACT Math SAT Math Transfer Course WVU Course N = 339 116 1220 2361 102 196 398 702 Success 60.2 87.1 46.1 76.2 69.6 46.9 44.7 45.6 Failure 23.9 11.2 33.0 15.0 18.6 37.8 32.4 33.8 Withdrawal 15.9 1.7 20.7 8.7 11.8 14.8 22.6 20.4 Table 7. ACT Math, SAT Math and Placement Score Correlations Total Placement Score ACT Math SAT Math Success Code Total Placement Score Pearson Correlation 1 .730** .689** .319** Sig. (2-tailed) 0 0 0 N 4207 2596 2563 4204 ACT Math Pearson Correlation .730** 1 .763** .279** Sig. (2-tailed) 0 0 0 N 2596 3284 1554 3281 SAT Math Pearson Correlation .689** .763** 1 .254** Sig. (2-tailed) 0 0 0 N 2563 1554 3258 3254 SuccessCode Pearson Correlation .319** .279** .254** 1 Sig. (2-tailed) 0 0 0 N 4204 3281 3254 5428 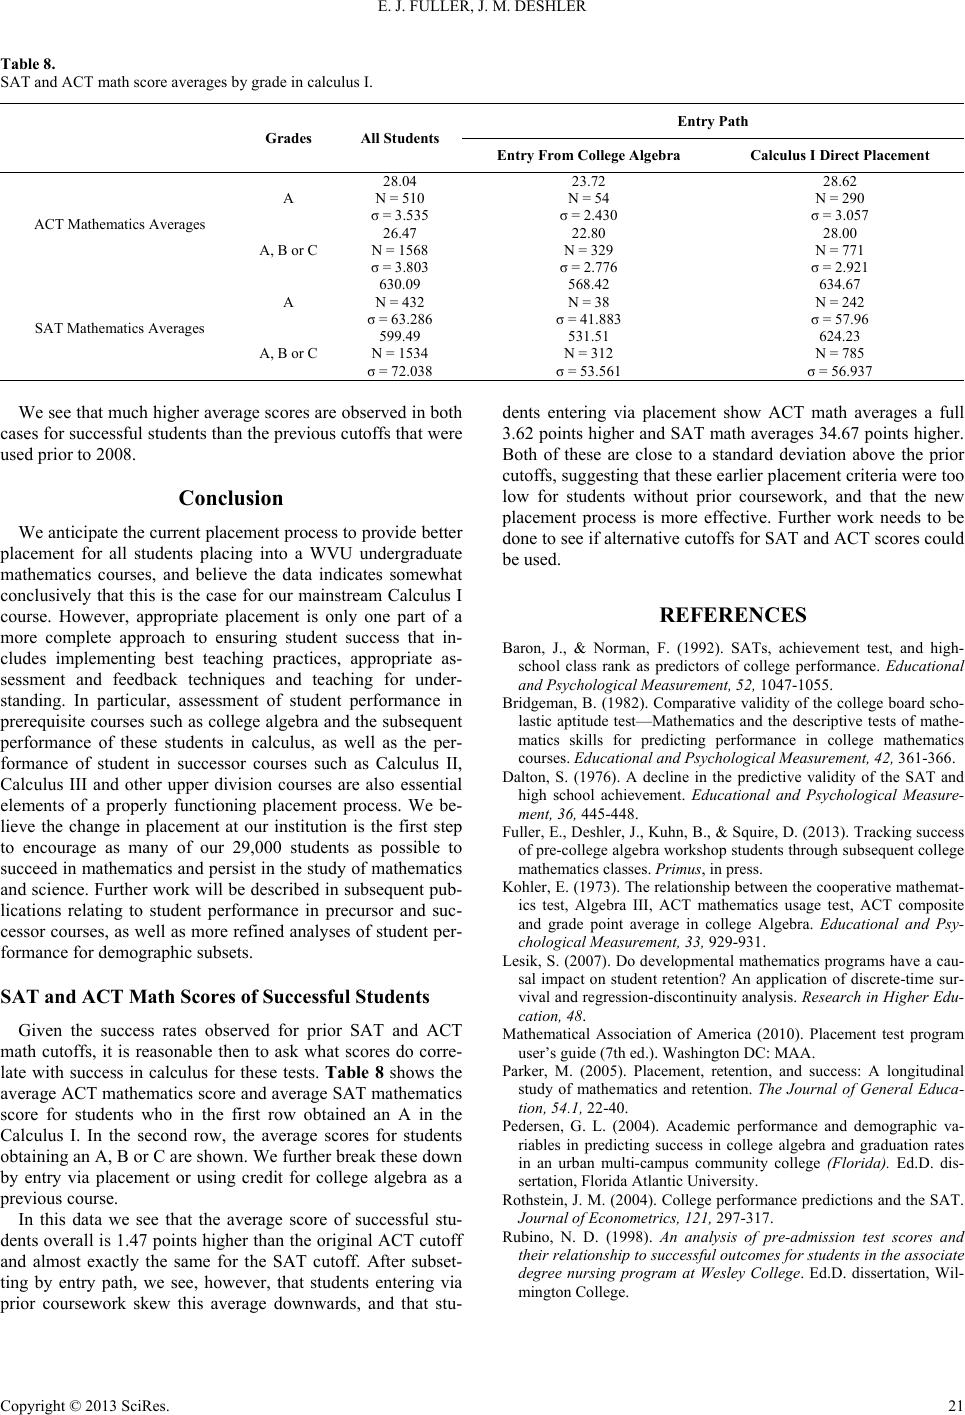 E. J. FULLER, J. M. DESHLER Copyright © 2013 SciRes. 21 Table 8. SAT and ACT math score averages by grade in calculus I. Grades All Students Entry Path Entry From College Algebra Calculus I Direct Placement ACT Mathematics Averages A 28.04 N = 510 σ = 3.535 23.72 N = 54 σ = 2.430 28.62 N = 290 σ = 3.057 A, B or C 26.47 N = 1568 σ = 3.803 22.80 N = 329 σ = 2.776 28.00 N = 771 σ = 2.921 SAT Mathematics Averages A 630.09 N = 432 σ = 63.286 568.42 N = 38 σ = 41.883 634.67 N = 242 σ = 57.96 A, B or C 599.49 N = 1534 σ = 72.038 531.51 N = 312 σ = 53.561 624.23 N = 785 σ = 56.937 We see that much higher average scores are observed in both cases for successful students than the previous cutoffs that were used prior to 2008. Conclusion We antic ipat e the current placement process to provide better placement for all students placing into a WVU undergraduate mathematics courses, and believe the data indicates somewhat conclusively that this is the case for our mainstream Calculus I course. However, appropriate placement is only one part of a more complete approach to ensuring student success that in- cludes implementing best teaching practices, appropriate as- sessment and feedback techniques and teaching for under- standing. In particular, assessment of student performance in prerequisite courses such as college algebra and the subsequent performance of these students in calculus, as well as the per- formance of student in successor courses such as Calculus II, Calculus III and other upper division courses are also essential elements of a properly functioning placement process. We be- lieve the change in placement at our institution is the first step to encourage as many of our 29,000 students as possible to succeed in mathematics and persist in the study of mathematics and science. Further work will be described in subsequent pub- lications relating to student performance in precursor and suc- cessor courses, as well as more refined analyses of student per- formance for demographic subsets. SAT and ACT Ma th Scores of Successful Students Given the success rates observed for prior SAT and ACT math cutoffs, it is reasonable then to ask what scores do corre- late with success in calculus for these tests. Table 8 shows the average ACT mathematics score and average SAT mathematics score for students who in the first row obtained an A in the Calculus I. In the second row, the average scores for students obtaining an A, B or C are shown. We further break these down by entry via placement or using credit for college algebra as a previous course. In this data we see that the average score of successful stu- dents overall is 1.47 points higher than the original ACT cutoff and almost exactly the same for the SAT cutoff. After subset- ting by entry path, we see, however, that students entering via prior coursework skew this average downwards, and that stu- dents entering via placement show ACT math averages a full 3.62 points higher and SAT math averages 34.67 points higher. Both of these are close to a standard deviation above the prior cutoffs, suggesting that these earlier placement criteria were too low for students without prior coursework, and that the new placement process is more effective. Further work needs to be done to see if alternative cutoffs for SAT and ACT scores could be used. REFERENCES Baron, J., & Norman, F. (1992). SATs, achievement test, and high- school class rank as predictors of college performance. Educational and Psychological Measurement, 52, 1047-1055. Bridgeman, B. (1982). Comparative validity of the college board scho- lastic aptitude test—Mathe matics and the descriptive t ests of mathe- matics skills for predicting performance in college mathematics courses. Educat ional and Psychological Measurement, 42, 361-366. Dalton, S. (1976). A decline in the predictive validity of the SAT and high school achievement. Educational and Psychological Measure- ment, 36, 445-448. Fuller, E., Deshler, J., Kuhn, B., & Squire, D. (2013). Tracking success of pre-college algebra workshop students through subsequent college mathematics classes. Primus, in press. Kohler, E. (19 73). The relation ship between the coop erative mathemat- ics test, Algebra III, ACT mathematics usage test, ACT composite and grade point average in college Algebra. Educational and Psy- chological Measurement, 33, 929-931. Lesik, S. (2007). Do developmental mathematics programs have a cau- sal impact on student retention? An application of discrete-ti me sur - vival and regression-disco ntinuity analysis. Research in Higher Edu- cation, 48. Mathematical Association of America (2010). Placement test program user’s guide (7th ed.). Washington DC: MAA. Parker, M. (2005). Placement, retention, and success: A longitudinal study of mathematics and retention. The Journal of General Educa- tion, 54.1, 22-40. Pedersen, G. L. (2004). Academic performance and demographic va- riables in predicting success in college algebra and graduation rates in an urban multi-campus community college (Florida). Ed.D. dis- sertation, Florida Atlantic University. Rothstein, J. M. (2 004). College performance pred ictions and the SAT. Journal of Econometrics, 121, 297-317. Rubino, N. D. (1998). An analysis of pre-admission test scores and their relationship to su ccessful o utcomes for stu dents in the as sociate degree nursing program at Wesley College. Ed.D. dissertation, Wil- mington Coll ege. |