

Paper Menu >>
Journal Menu >>
 Vol.4, No.10, 521-528 (2013) Agricultural Sciences http://dx.doi.org/10.4236/as.2013.410070 Root zone soil moisture redistribution in maize (Zea mays L.) under different water application regimes John Mthandi1*, Fedrick C. Kahimba1, Andrew K. P. R. Tarimo1, Baandah A. Salim1, Maxon W. Lowole2 1Department of Agricultural Engineering and Land Planning, Sokoine University of Agriculture, Morogoro, Tanzania; *Corresponding Author: [email protected] 2Department of Crop Science, Bunda College of Agriculture, Lilongwe, Malawi Received 26 June 2013; revised 26 July 2013; accepted 1 August 2013 Copyright © 2013 John Mthandi et al. This is an open access article distributed under the Creative Commons Attribution License, which permits unrestricted use, distribution, and reproduction in any medium, provided the original work is properly cited. ABSTRACT Soil moisture availability to plant roots is very important for crop growth. When soil moisture is not available in the root zone, plants wilt and yield is reduced. Adequate knowledge of the distribution of soil moisture within crop’s root zone and its linkage to the amount of water ap- plied is very important as it assist s in optimising the efficient use of water and reducing yield loss- es. The study aimed at evaluating the spatial re dis tribution of soil moisture within maize roots zone under different irrigation water application regimes. The study was conducted during two irrigat ation season s of 20 12 at Nkango Irrigation Scheme, Malawi. The trials consisted of fa ctori al arrangement in a Randomised Complete Block Design (RCBD). The factors were water and ni- troge n and both were at four levels. The Triscan Sensor was used to measure volumetric soil mo- isture contents at different vertical and lateral points. The st udy inferred tha t th e de g ree of soil moisture loss depends on the amount of water present in the soil. The rate of soil moisture loss in 100% of full water requirement regime (100% FWRR) treatment was higher than that in 40% FWRR treatment. This was particularly noticed when maize leaves were dry. In 100% FWRR treatment, the attraction between water and the surfaces of soil particles was not tight and as such “free” water was lost through evaporation and deep percolation, while in 40% FWRR, water was strongly attracted to and held on the soil particles surfaces and as such its potential of losing water was reduced. Keywords: Soil Moisture Content; Full Crop Water Requirement Regime; Maize Root Zon e 1. INTRODUCTION Water use efficiency and water productivity are im- portant agricultural performance indicators that are used in assessing the impact of water management practices that are used to produce more crops with less water [1]. It is vital to specify the water use components when de- riving water use efficiency and productivity to avoid the confusion over the two, since these terms are related, but are not essentially the same [2]. In irrigation engineering terms water use efficiency is defined as the ratio between amount of water required to grow a crop (i.e. evapotranspiration, percolation and see- page, leaching for salinity control, and land preparation), and the total amount of water applied in irrigation sink or within a spatial domain of interest [2]. Water use effi- ciency (WUE) as an agronomic term means the ratio be- tween marketable crop yield and amount of water stored in the root zone that is only up-taken and transpired by the crop [3]. Under agronomic definition of water use efficiency, amount of water stored within the crop root zone but lost through evaporation is not accounted for [4]. Irrigation engineering and agronomic water use ef- ficiencies may be related to each other but under nor- mal circumstances increase in irrigation engineering wa- ter use efficiency does not result in an increase in agrono- mic water use efficiency. For example, in Irrigation engi- neering water use efficiency is directly correlated with de- crease in applied water. But this does not mean that re- duced amount of water will result in an increase in crop yield. This is because less amount of applied water may not have the ability to flush out salts or may not be enough to meet the demand of the crops hence low yield may oc- cur meaning that agronomic water use efficiency is low. The ambiguity in the definitions and interpretation of wa- Copyright © 2013 SciRes. OPEN A CCE SS 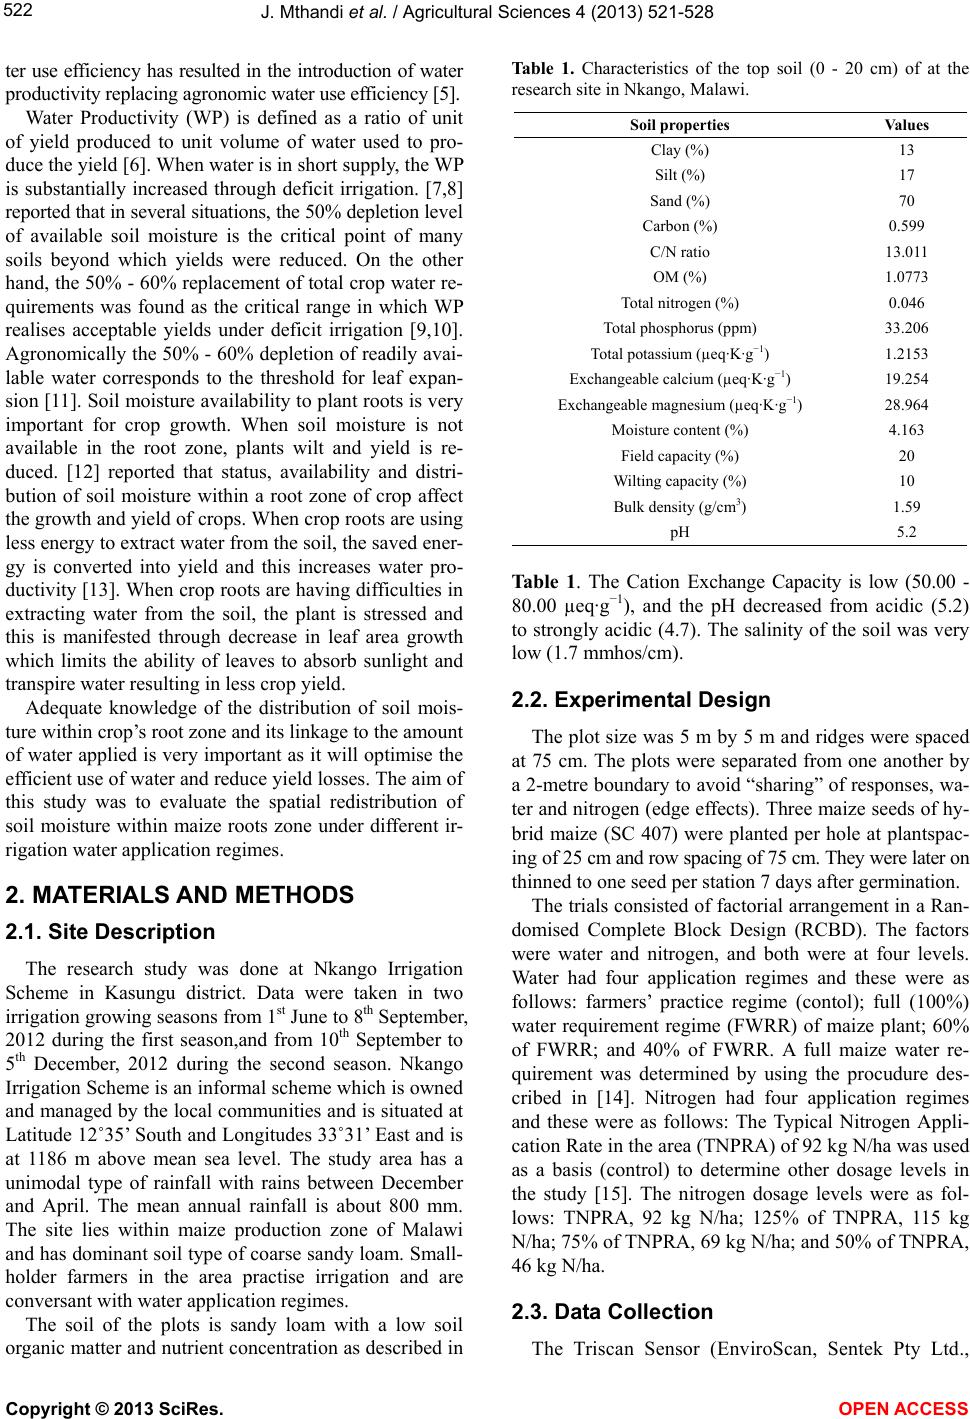 J. Mthandi et al. / Agricultural Sciences 4 (2013) 52 1-528 522 ter use efficiency has resulted in the introduction of water productivity replacing agronomic water use efficiency [5]. Water Productivity (WP) is defined as a ratio of unit of yield produced to unit volume of water used to pro- duce the yield [6]. When water is in short supply, the WP is substantially increased through deficit irrigation. [7,8] reported that in several situations, the 50% depletion level of available soil moisture is the critical point of many soils beyond which yields were reduced. On the other hand, the 50% - 60% replacement of total crop water re- quirements was found as the critical range in which WP realises acceptable yields under deficit irrigation [9,10]. Agronomically the 50% - 60% depletion of readily avai- lable water corresponds to the threshold for leaf expan- sion [11]. Soil moisture availability to plant roots is very important for crop growth. When soil moisture is not available in the root zone, plants wilt and yield is re- duced. [12] reported that status, availability and distri- bution of soil moisture within a root zone of crop affect the growth and yield of crops. When crop roots are using less energy to extract water from the soil, the saved ener- gy is converted into yield and this increases water pro- ductivity [13]. When crop roots are having difficulties in extracting water from the soil, the plant is stressed and this is manifested through decrease in leaf area growth which limits the ability of leaves to absorb sunlight and transpire water resulting in less crop yield. Adequate knowledge of the distribution of soil mois- ture within crop’s root zone and its linkage to the amount of water applied is very important as it will optimise the efficient use of water and reduce yield losses. The aim of this study was to evaluate the spatial redistribution of soil moisture within maize roots zone under different ir- rigation water application regimes. 2. MATERIALS AND METHODS 2.1. Site Description The research study was done at Nkango Irrigation Scheme in Kasungu district. Data were taken in two irrigation growing seasons from 1st June to 8th September, 2012 during the first season,and from 10th September to 5th December, 2012 during the second season. Nkango Irrigation Scheme is an informal scheme which is owned and managed by the local communities and is situated at Latitude 12˚35’ South and Longitudes 33˚31’ East and is at 1186 m above mean sea level. The study area has a unimodal type of rainfall with rains between December and April. The mean annual rainfall is about 800 mm. The site lies within maize production zone of Malawi and has dominant soil type of coarse sandy loam. Small- holder farmers in the area practise irrigation and are conversant with water application regimes. The soil of the plots is sandy loam with a low soil organic matter and nutrient concentration as described in Table 1. Characteristics of the top soil (0 - 20 cm) of at the research site in Nkango, Malawi. Soil properties Values Clay (%) 13 Silt (%) 17 Sand (%) 70 Carbon (%) 0.599 C/N ratio 13.011 OM (%) 1.0773 Total nitrogen (%) 0.046 Total phosphorus (ppm) 33.206 Total potassium (µeq·K·g−1) 1.2153 Exchangeable calcium (µeq·K·g−1) 19.254 Exchangeable magnesium (µeq·K·g−1) 28.964 Moisture content (%) 4.163 Field capacity (%) 20 Wilting capacity (%) 10 Bulk density (g/cm3) 1.59 pH 5.2 Ta ble 1. The Cation Exchange Capacity is low (50.00 - 80.00 µeq·g−1), and the pH decreased from acidic (5.2) to strongly acidic (4.7). The salinity of the soil was very low (1.7 mmhos/cm). 2.2. Experimental Design The plot size was 5 m by 5 m and ridges were spaced at 75 cm. The plots were separated from one another by a 2-metre boundary to avoid “sharing” of responses, wa- ter and nitrogen (edge effects). Three maize seeds of hy- brid maize (SC 407) were planted per hole at plantspac- ing of 25 cm and row spacing of 75 cm. They were later on thinned to one seed per station 7 days after germination. The trials consisted of factorial arrangement in a Ran- domised Complete Block Design (RCBD). The factors were water and nitrogen, and both were at four levels. Water had four application regimes and these were as follows: farmers’ practice regime (contol); full (100%) water requirement regime (FWRR) of maize plant; 60% of FWRR; and 40% of FWRR. A full maize water re- quirement was determined by using the procudure des- cribed in [14]. Nitrogen had four application regimes and these were as follows: The Typical Nitrogen Appli- cation Rate in the area (TNPRA) of 92 kg N/ha was used as a basis (control) to determine other dosage levels in the study [15]. The nitrogen dosage levels were as fol- lows: TNPRA, 92 kg N/ha; 125% of TNPRA, 115 kg N/ha; 75% of TNPRA, 69 kg N/ha; and 50% of TNPRA, 46 kg N/ha. 2.3. Data Collection The Triscan Sensor (EnviroScan, Sentek Pty Ltd., Copyright © 2013 SciRes. OPEN A CC ESS  J. Mthandi et al. / Agricultural Sciences 4 (2013) 52 1-528 523 Stepney, Australia), which has ability to sensor volu- metric soil moisture at the instant time of inserting the monitoring probe in the soil, was used to measure soil moisture content at different points (defined by lateral and vertical distances) within maize root zone depth. The lateral distances were at interval of 5 cm as shown in Figure 1. The measured points were: at point of ferti- lizer application (represented by 0 cm, which is 10 cm from the plant), at 5 cm away from the plant (represent- ed by −5 cm), at 5 cm towards the plant, 10 cm towards the plant (this point was maize planting station), and 15 cm (this point was 5 cm after planting station) as shown in Figure 1. The lateral distances were taken based on spreading and elongation pattern of lateral roots of maize plants. The lateral readings of nitrogen were respectively taken at five soil depths of 20, 40, 60, 80, and 100 cm from the soil surface,and were selected based on maize roots growth habits, which extend down to 100 cm [16]. 2.4. Data Analysis The data presented in this paper were from treatment combinations of 100% of FWRR and 92 N Kg/Ha and 40% of FWRR and 92 N Kg/Ha. This is because statis- tically treatment combination of 100% of FWRR and 92 N Kg/Ha gave the highest nitrogen use efficiency and 40% of FWRR and 92 N Kg/Hagave the highest water Figure 1. Showing measurement points. productivities. The data are presented in graphical form to indicate comparative redistribution of soil moisture content in both treatment combinations. 3. RESULTS AND DISCUSSIONS Figures 2 and 3 indicate the spatial distribution of soil moisture on 10th July in maize plots of 100% FWRR and 40% FWRR respectively. The figures indicate that at point where maize was planted, the soil moisture was high at 20 cm in 40% than in 100%, while at 40 cm deep Figure 2. Soil moisture content distribution in 100% FWRR on 10 July. Figure 3. Soil moisture content distribution in 40% FWRR on 10 July. Copyright © 2013 SciRes. OPEN A CC ESS  J. Mthandi et al. / Agricultural Sciences 4 (2013) 52 1-528 524 soil moisture content was high in 100% FWRR than in 40% FWRR treatments. At 60 cm, the soil moisture was very high in 100% FWRR and was about 27% while in 40% FWRR, the soil moisture was about 18%. At 100 cm below, the soil moisture contents were relatively the same in both plots of 100% FWRR and 40% FWRR. The general observations indicate that at 20 cm below, there was negligible difference of soil moisture contents in both treatments.Higher soil moisture contents were observed from 40 cm, 60 cm to 80 cm. At 100 cm neg- ligible differences were again observed in both treat- ments. The reason to this observation is that at shallow soil depths soil water loss through evaporation is propor- tional to the degree of soil wetness, i.e. moist surface loose high amount of water than less moist surfaces due latent heat which is absorbed by soil water and hence subjecting the surface to more water loss. Over the period, the surface will relatively have the same moisture con- tents. On 10th July, maize plants were almost 40 days after planting and the leaves were not fully developed to completely shade the land surface, as such during this period water loss through evaporation was high. Between 20 and 80 cm deep the differences in soil moisture content may be due to uptake by maize roots. In 40% FWRR, the plants roots are stressed and have less ability to attract water from the surrounding areas. In 100% FWRR, the surrounding soil has high moisture contents due to applied water but also due to ability of plant roots to attract water from the surrounding areas. At the depth of 100 cm, the soil moisture contents may entirely be due to not being uptaken by maize roots. Several studies have shown that soil moisture increases with depth. It is unlikely that on 20th July, water through deep percolation may have greatly attributed to the changes of soil moisture at 100 cm in both treatments. Figures 4 and 5 show that spatial distribution of soil moisture contents at 20 cm deep in both treatments had similar pattern and they all spread with 15% to 25% soil moisture contents. Big differences of spreading patterns were observed in at 40 cm below. At 60 cm below the distribution had similar pattern with the lowest figures at lateral distance of 10 cm and highest at 0 cm. At 100 cm below, soil moisture though similar distribution pattern in both treatments, but the figures in 100% FWRR treat- ment were much higher than those in 40% treatment. The high differences at 60 cm may be due to absorption of water by maize roots and this can be substantiated by a low figure at lateral distance of 10 cm which was at the point of maize seeds plantation. Many studies on maize roots behaviour suggests that maize roots tend to grow to 100 cm, but during flowering stages, maize roots are more active at depth between 50 to 70 cm below and this study suggest that rate of water absorption was very high within this soil depths. At 100 cm below soil moisture increase in 100% FWRR treatment may be due to deep percolation of water from the applied water. On 20th July the maize plant had reached 50 days after planting. The plant leaves had fully developed with leaf area index at its highest, and during this period land surface is wholly covered by leaves resulting in less evaporation and high downward movement of water as there is less competing force. Figures 6 and 7 indicate the spatial distribution of soil moisture on 30th July when the maize was 60 days after planting old. The behaviour of soil moisture contents at Figure 4. Soil moisture content distribution in 100% FWRR on 20 July. Figure 5. Soil moisture content distribution in 40% FWRR on 20 July. Copyright © 2013 SciRes. OPEN A CC ESS 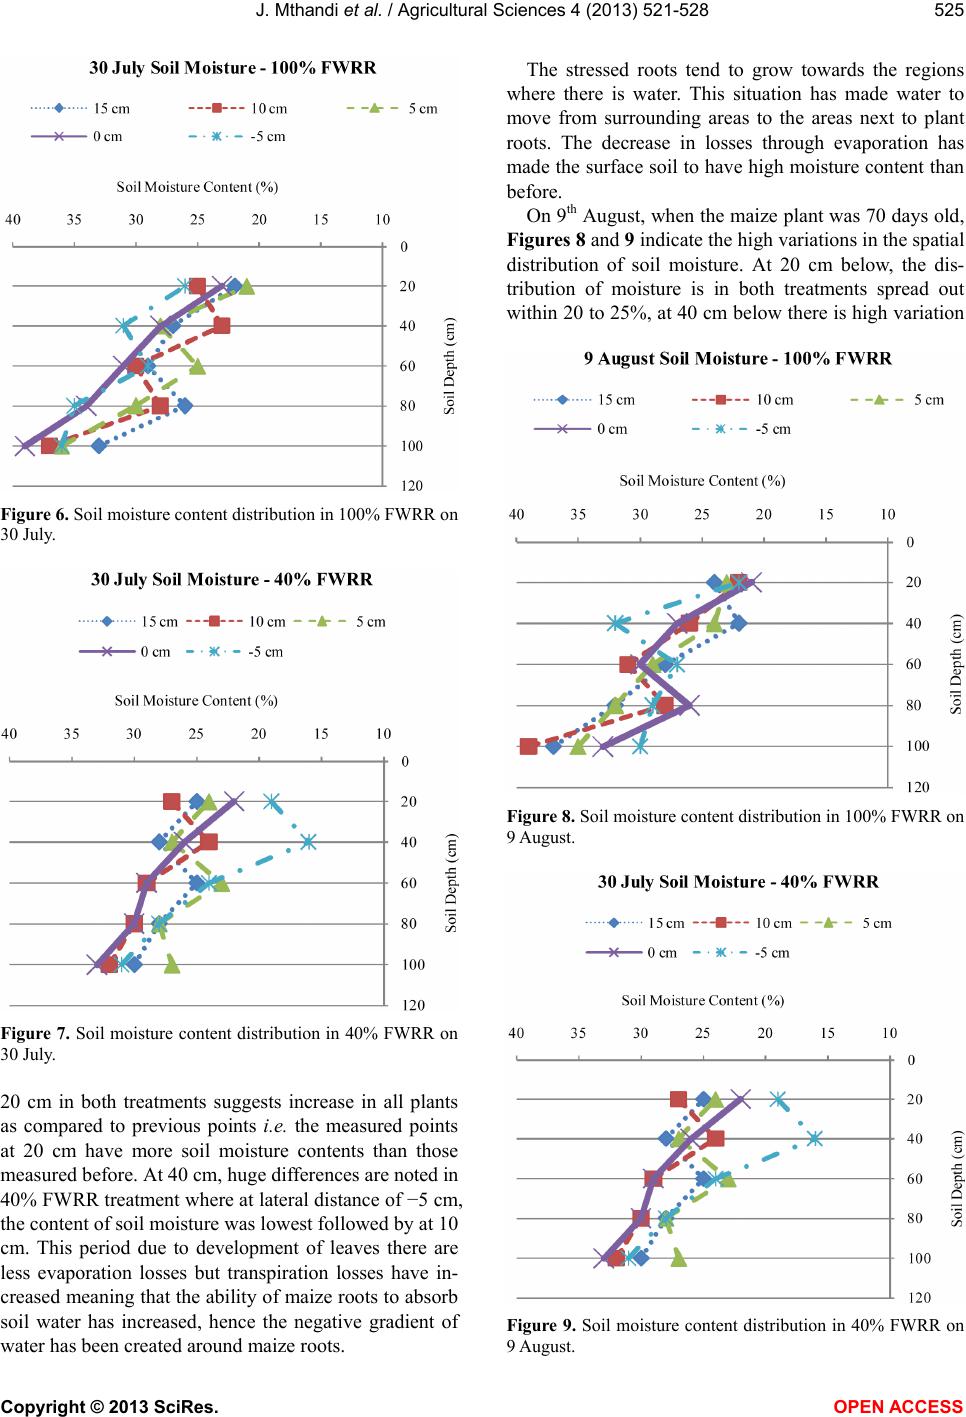 J. Mthandi et al. / Agricultural Sciences 4 (2013) 52 1-528 525 Figure 6. Soil moisture content distribution in 100% FWRR on 30 July. Figure 7. Soil moisture content distribution in 40% FWRR on 30 July. 20 cm in both treatments suggests increase in all plants as compared to previous points i.e. the measured points at 20 cm have more soil moisture contents than those measured before. At 40 cm, huge differences are noted in 40% FWRR treatment where at lateral distance of −5 cm, the content of soil moisture was lowest followed by at 10 cm. This period due to development of leaves there are less evaporation losses but transpiration losses have in- creased meaning that the ability of maize roots to absorb soil water has increased, hence the negative gradient of water has been created around maize roots. The stressed roots tend to grow towards the regions where there is water. This situation has made water to move from surrounding areas to the areas next to plant roots. The decrease in losses through evaporation has made the surface soil to have high moisture content than before. On 9th August, when the maize plant was 70 days old, Figures 8 and 9 indicate the high variations in the spatial distribution of soil moisture. At 20 cm below, the dis- tribution of moisture is in both treatments spread out within 20 to 25%, at 40 cm below there is high variation Figure 8. Soil moisture content distribution in 100% FWRR on 9 August. Figure 9. Soil moisture content distribution in 40% FWRR on 9 August. Copyright © 2013 SciRes. OPEN A CC ESS 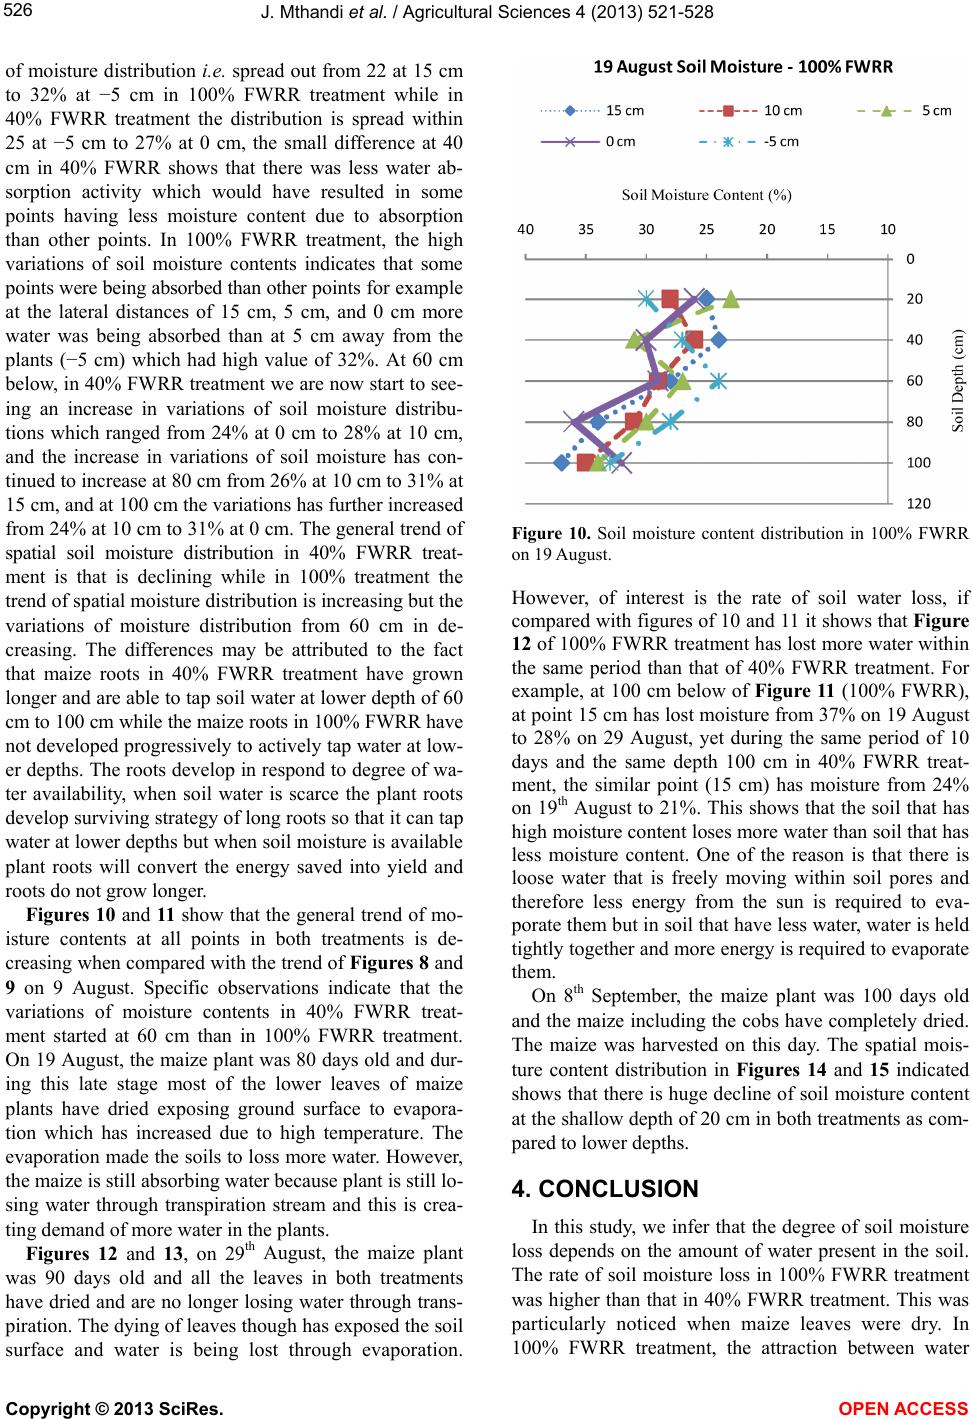 J. Mthandi et al. / Agricultural Sciences 4 (2013) 52 1-528 526 of moisture distribution i.e. spread out from 22 at 15 cm to 32% at −5 cm in 100% FWRR treatment while in 40% FWRR treatment the distribution is spread within 25 at −5 cm to 27% at 0 cm, the small difference at 40 cm in 40% FWRR shows that there was less water ab- sorption activity which would have resulted in some points having less moisture content due to absorption than other points. In 100% FWRR treatment, the high variations of soil moisture contents indicates that some points were being absorbed than other points for example at the lateral distances of 15 cm, 5 cm, and 0 cm more water was being absorbed than at 5 cm away from the plants (−5 cm) which had high value of 32%. At 60 cm below, in 40% FWRR treatment we are now start to see- ing an increase in variations of soil moisture distribu- tions which ranged from 24% at 0 cm to 28% at 10 cm, and the increase in variations of soil moisture has con- tinued to increase at 80 cm from 26% at 10 cm to 31% at 15 cm, and at 100 cm the variations has further increased from 24% at 10 cm to 31% at 0 cm. The general trend of spatial soil moisture distribution in 40% FWRR treat- ment is that is declining while in 100% treatment the trend of spatial moisture distribution is increasing but the variations of moisture distribution from 60 cm in de- creasing. The differences may be attributed to the fact that maize roots in 40% FWRR treatment have grown longer and are able to tap soil water at lower depth of 60 cm to 100 cm while the maize roots in 100% FWRR have not developed progressively to actively tap water at low- er depths. The roots develop in respond to degree of wa- ter availability, when soil water is scarce the plant roots develop surviving strategy of long roots so that it can tap water at lower depths but when soil moisture is available plant roots will convert the energy saved into yield and roots do not grow longer. Figures 10 and 11 show that the general trend of mo- isture contents at all points in both treatments is de- creasing when compared with the trend of Figures 8 and 9 on 9 August. Specific observations indicate that the variations of moisture contents in 40% FWRR treat- ment started at 60 cm than in 100% FWRR treatment. On 19 August, the maize plant was 80 days old and dur- ing this late stage most of the lower leaves of maize plants have dried exposing ground surface to evapora- tion which has increased due to high temperature. The evaporation made the soils to loss more water. However, the maize is still absorbing water because plant is still lo- sing water through transpiration stream and this is crea- ting demand of more water in the plants. Figures 12 and 13, on 29th August, the maize plant was 90 days old and all the leaves in both treatments have dried and are no longer losing water through trans- piration. The dying of leaves though has exposed the soil surface and water is being lost through evaporation. Figure 10. Soil moisture content distribution in 100% FWRR on 19 August. However, of interest is the rate of soil water loss, if compared with figures of 10 and 11 it shows that Figure 12 of 100% FWRR treatment has lost more water within the same period than that of 40% FWRR treatment. For example, at 100 cm below of Figure 11 (100% FWRR), at point 15 cm has lost moisture from 37% on 19 August to 28% on 29 August, yet during the same period of 10 days and the same depth 100 cm in 40% FWRR treat- ment, the similar point (15 cm) has moisture from 24% on 19th August to 21%. This shows that the soil that has high moisture content loses more water than soil that has less moisture content. One of the reason is that there is loose water that is freely moving within soil pores and therefore less energy from the sun is required to eva- porate them but in soil that have less water, water is held tightly together and more energy is required to evaporate them. On 8th September, the maize plant was 100 days old and the maize including the cobs have completely dried. The maize was harvested on this day. The spatial mois- ture content distribution in Figures 14 and 15 indicated shows that there is huge decline of soil moisture content at the shallow depth of 20 cm in both treatments as com- pared to lower depths. 4. CONCLUSION In this study, we infer that the degree of soil moisture loss depends on the amount of water present in the soil. The rate of soil moisture loss in 100% FWRR treatment was higher than that in 40% FWRR treatment. This was particularly noticed when maize leaves were dry. In 100% FWRR treatment, the attraction between water Copyright © 2013 SciRes. OPEN A CC ESS 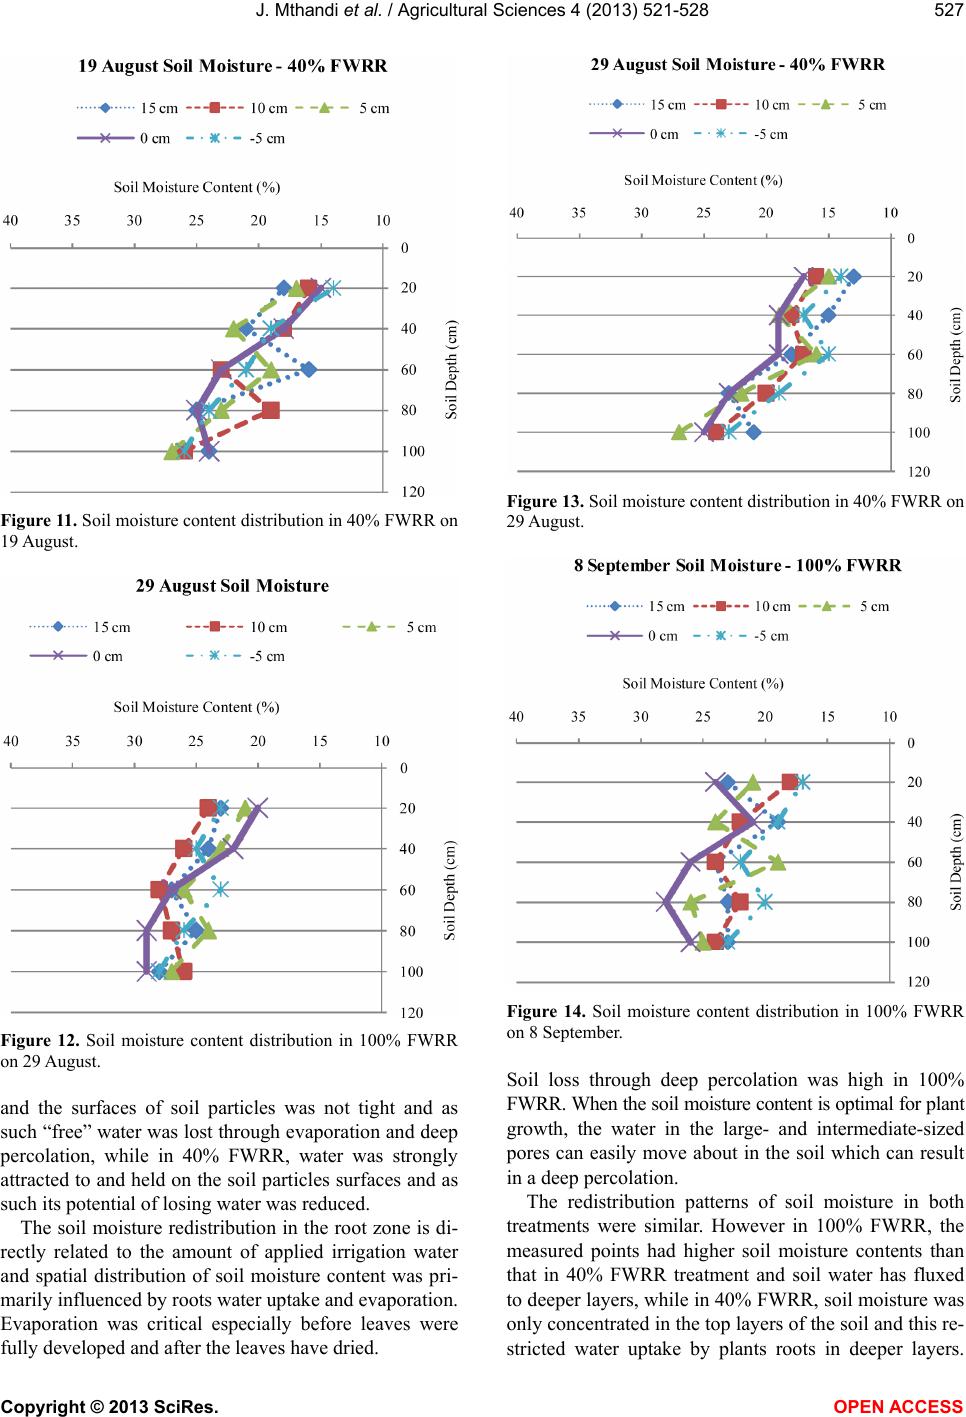 J. Mthandi et al. / Agricultural Sciences 4 (2013) 52 1-528 527 Figure 11. Soil moisture content distribution in 40% FWRR on 19 August. Figure 12. Soil moisture content distribution in 100% FWRR on 29 August. and the surfaces of soil particles was not tight and as such “free” water was lost through evaporation and deep percolation, while in 40% FWRR, water was strongly attracted to and held on the soil particles surfaces and as such its potential of losing water was reduced. The soil moisture redistribution in the root zone is di- rectly related to the amount of applied irrigation water and spatial distribution of soil moisture content was pri- marily influenced by roots water uptake and evaporation. Evaporation was critical especially before leaves were fully developed and after the leaves have dried. Figure 13. Soil moisture content distribution in 40% FWRR on 29 August. Figure 14. Soil moisture content distribution in 100% FWRR on 8 September. Soil loss through deep percolation was high in 100% FWRR. When the soil moisture content is optimal for plant growth, the water in the large- and intermediate-sized pores can easily move about in the soil which can result in a deep percolation. The redistribution patterns of soil moisture in both treatments were similar. However in 100% FWRR, the measured points had higher soil moisture contents than that in 40% FWRR treatment and soil water has fluxed to deeper layers, while in 40% FWRR, soil moisture was only concentrated in the top layers of the soil and this re- stricted water uptake by plants roots in deeper layers. Copyright © 2013 SciRes. OPEN A CC ESS 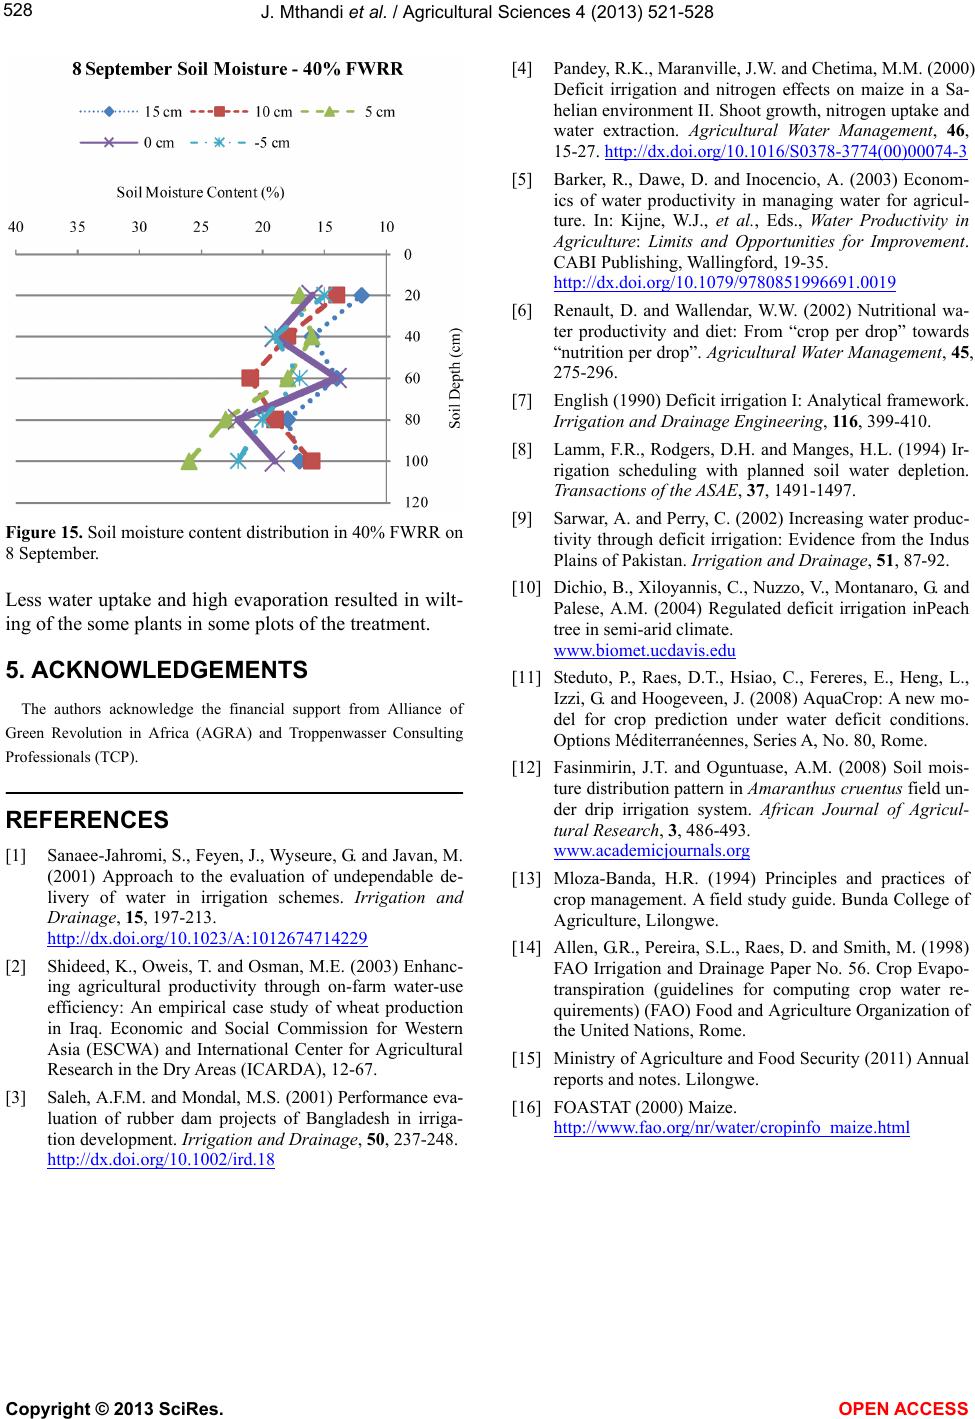 J. Mthandi et al. / Agricultural Sciences 4 (2013) 52 1-528 Copyright © 2013 SciRes. 528 [4] Pandey, R.K., Maranville, J.W. and Chetima, M.M. (2000) Deficit irrigation and nitrogen effects on maize in a Sa- helian environment II. Shoot growth, nitrogen uptake and water extraction. Agricultural Water Management, 46, 15-27. http://dx.doi.org/10.1016/S0378-3774(00)00074-3 [5] Barker, R., Dawe, D. and Inocencio, A. (2003) Econom- ics of water productivity in managing water for agricul- ture. In: Kijne, W.J., et al., Eds., Water Productivity in Agriculture: Limits and Opportunities for Improvement. CABI Publishing, Wallingford, 19-35. http://dx.doi.org/10.1079/9780851996691.0019 [6] Renault, D. and Wallendar, W.W. (2002) Nutritional wa- ter productivity and diet: From “crop per drop” towards “nutrition per drop”. Agricultural Water Management, 45, 275-296. [7] English (1990) Deficit irrigation I: Analytical framework. Irrigation and Drainage Engineering, 116, 399-410. [8] Lamm, F.R., Rodgers, D.H. and Manges, H.L. (1994) Ir- rigation scheduling with planned soil water depletion. Transactions of the ASAE, 37, 1491-1497. [9] Sarwar, A. and Perry, C. (2002) Increasing water produc- tivity through deficit irrigation: Evidence from the Indus Plains of Pakistan. Irrigation and Drainage, 51, 87-92. Figure 15. Soil moisture content distribution in 40% FWRR on 8 September. [10] Dichio, B., Xiloyannis, C., Nuzzo, V., Montanaro, G. and Palese, A.M. (2004) Regulated deficit irrigation inPeach tree in semi-arid climate. www.biomet.ucdavis.edu Less water uptake and high evaporation resulted in wilt- ing of the some plants in some plots of the treatment. 5. ACKNOWLEDGEMENTS [11] Steduto, P., Raes, D.T., Hsiao, C., Fereres, E., Heng, L., Izzi, G. and Hoogeveen, J. (2008) AquaCrop: A new mo- del for crop prediction under water deficit conditions. Options Méditerranéennes, Series A, No. 80, Rome. The authors acknowledge the financial support from Alliance of Green Revolution in Africa (AGRA) and Troppenwasser Consulting Professionals (TCP). [12] Fasinmirin, J.T. and Oguntuase, A.M. (2008) Soil mois- ture distribution pattern in Amaranthus cruentus field un- der drip irrigation system. African Journal of Agricul- tural Research, 3, 486-493. www.academicjournals.org REFERENCES [1] Sanaee-Jahromi, S., Feyen, J., Wyseure, G. and Javan, M. (2001) Approach to the evaluation of undependable de- livery of water in irrigation schemes. Irrigation and Drainage, 15, 197-213. http://dx.doi.org/10.1023/A:1012674714229 [13] Mloza-Banda, H.R. (1994) Principles and practices of crop management. A field study guide. Bunda College of Agriculture, Lilongwe. [14] Allen, G.R., Pereira, S.L., Raes, D. and Smith, M. (1998) FAO Irrigation and Drainage Paper No. 56. Crop Evapo- transpiration (guidelines for computing crop water re- quirements) (FAO) Food and Agriculture Organization of the United Nations, Rome. [2] Shideed, K., Oweis, T. and Osman, M.E. (2003) Enhanc- ing agricultural productivity through on-farm water-use efficiency: An empirical case study of wheat production in Iraq. Economic and Social Commission for Western Asia (ESCWA) and International Center for Agricultural Research in the Dry Areas (ICARDA), 12-67. [15] Ministry of Agriculture and Food Security (2011) Annual reports and notes. Lilongwe. [3] Saleh, A.F.M. and Mondal, M.S. (2001) Performance eva- luation of rubber dam projects of Bangladesh in irriga- tion development. Irrigation and Drainage, 50, 237-248. http://dx.doi.org/10.1002/ird.18 [16] FOASTAT (2000) Maize. http://www.fao.org/nr/water/cropinfo_maize.html OPEN A CCESS |