

Paper Menu >>
Journal Menu >>
 Open Journal of Energy Efficiency, 2013, 2, 133-138 http://dx.doi.org/10.4236/ojee.2013.23017 Published Online September 2013 (http://www.scirp.org/journal/ojee) To Improve Energy Efficiency via Car Driving Deduction by Land Use Planning Mohammad Malekizadeh1, M. F. M. Zain1, Amiruddin Ismail2, Ahmad Hami3 1Department of Architecture, Universiti of Kebangsaan Malaysia (UKM), Bangi, Malaysia 2Sustainable Urban Transport Research Centre (SUTRA), Faculty of Engineering and Built Environment, Universiti Kebangsaan Malaysia (UKM), Bangi, Malaysia 3Department of Landscape Architecture, Universiti of Tabriz, Tabriz, Iran Email: [email protected] Received December 31, 2012; revised May 31, 2013; accepted July 4, 2013 Copyright © 2013 Mohammad Malekizadeh et al. This is an open access article distributed under the Creative Commons Attribution License, which permits unrestricted use, distribution, and reproduction in any medium, provided the original work is properly cited. ABSTRACT Urban area consumes about main percentage of used energy. Cities need basic review in land management, structure and form to minimize the use of energy which creating environmental pollution. Urban planners and designers are look- ing for a solution and essential agreement in urban planning and designing principles that can decrease the pollution from rapid urbanization. Travelling is essential for daily needs of most people in urban area. Issues arise when one con- siders the amount of necessary fossil fuels used in the majority of daily commuting for accessibility to services. It is necessary to design a city to minimize the use of energy which creating environmental pollution. Research conducted in Subang Jaya in Malaysia in 2012 finds a variable which influences on use of car, propose of use of car and commuting distance by car. However it tried to find effect of train station and density on use of car for accessibility to this services and facilities. Findings illustrate neighbourhood distance from train station influences distance to facilities and services in neighbourhoods. However it illustrates derived distance by car was affected by residential lots distance from restau- rant, work place, school, park, house area per person, and car ownership. Keywords: Town & City Planning; Railway Systems; Urban Design; Transport Planning; Pollution; Energy Efficiency 1. Introduction New form of urbanism took place on the demand for building. Consequently planning project started to accommodate the workers and their family near indus- trial plants after the industrial revolution. Low-income class community increases and upper-class commu- nity moved to suburbs, resulting in an urban sprawl of horizontal magnitude to about every community throughout the word [1]. In developing country this process was different; the developing countries mostly have high economic growths which increases growth of employment centres. Population move from other area for working to these centres. Capital of country and a few cities attracted these employment centres and population. The cities in developing countries have been facing with rapid urbanization and land fragmentation which are always faster than urban planning and designing. In this manner residential area takes place without considering facilities in accessible distance. 1.1. Back Ground Literature Khattak and Rodriguez 2005 found that auto trip, travel distance, travel time, regional trip, external trip distance and trip duration of trip in neo-traditional neighbourhood residence is less than the conventional neighbourhood significantly [2]. Inner city zone that has integrated streets, parks and green spaces structure has more acces- sibility to facilities and services [3]. Amount of trip of inner city’s resident is higher with shorter duration, and residents of this area spend least time in travel; in this area people walk and bike more and use less car travel. Residents of inter commuter belt spend the most time in travel with longest travel time [4]. Key elements of neighbourhood walkability are proxy and connectivity. First one come from mixed-land uses and the second one is related to street pattern. Handy and Cao et al. 2005 in their study indicated putting resident’s proximity to des- tinations with alternatives ways to auto usage results to less driving; this means decrease in driving can be reach by increase in accessibility. Increasing in accessibility in C opyright © 2013 SciRes. OJEE  M. MALEKIZADEH ET AL. 134 existing areas can be possible by policies that include revitalization traditional neighbourhood design by main street program design, and filling undeveloped and rede- veloped shopping centre [5]. Maleki, Zain, & Ismail, 2012 illustrated Street density, house density, house di- versity, and non-residentia land use, positively and sig- nificantly influence accessibility to facilities and services. Distance to shops, distance to high school, distance to health centre, distance to train station, land diversity, block length and average lot size negatively and signifi- cantly influence accessibility to facilities and services [6]. Iacono and Krizek et al. 2009 say money, and other cost play as impedance role in travel, this impedance in recent none motorize travel study is distance. He used of dis- tance and time both for calculating accessibility to rec- reation, restaurant, shopping, and work by walking and cycling [7]. 1.2. Back Ground of Case Study Malaysia has experienced continuous economic growth since 1985; this trend resulted in rapid urbanization es- pecially in Kuala Lumpur and Klang Valley [8]. This rapid urbanization increases the need for more housing and urban development in a larger area. However, it in- creased economic growth as well as a desire for greater accessibility and mobility for all. Increases in travel needs that are not managed efficiently and effectively result in excess congestion in private motorize travelling mode. Haphazard growths make residential area develop without proper planning for acceptable distance to em- ployment centres and facilities. In poor accessibility con- dition, residents have to commute long distances to get their daily needs to their workplace. Whenever facilities are located further than the walkable distance, residents use necessarily motorized travel. They prefer to use cars if public transport is not available. The public transporta- tion master plan of Kuala Lumpur/Klang Valley is illus- trated as such: The net result of increased car usage has been a rise in congestion across the region. However door to door travel times for private vehicles remain competitive against the use of public transport. Travel times are typically much higher by public transport re- sulting in poorer accessibility to jobs and facilities [9]. Malaysia as a developing country in sensitive natural environment needs to conduct rapid urbanisation growth in the way that minimise impact of urban development on local environmental resources. Kuala Lumpur, the capital of the country and its township like Subang Jaya are the centres of this growth and thus more attention needs to be given for environmental protection. The gov- ernment desires to improve the urban environment and quality of life, and to ease the pressure on the infrastruc- ture in general by balancing the development in Kuala Lumpur and the Klang Valley [10]. 1.3. New Approaches in Land Use Management Sustainability has multidimensional affects on the envi- ronment and many aspects of human life. An integrated systematic view of events can leads us to a better under- standing interaction between urban land use and envi- ronmental pollution. Most cities grow faster than land use planning and land use managing. Rational use of recourses is to consider fairness between current genera- tion and future generation for use of these recourses [11]. “Efficiency” versus “solidarity” is considered as key un- certainties in the Sustainability outlook. Efficiency is doing more with use of fewer materials and recourses. In land use management for population reduction this means residents participation in activities with use of less fossil foul and pollution reduction. The trend towards more “efficiency” means that decision making is increas- ingly based on economic rationality and market forces. This strategy mainly directed to facilitate market proc- esses with the limited government intervention. The trend towards more “solidarity” involves decision making which is determined by values on social equity and soli- darity, cultural identity and sustainability. Government coordination is important in solidarity and not restrained. Supplying services by private investor sector in local centre shows they made it well, because capital tends to increase in the best manner. At the same time they in- crease welfare and level of accessibility of surrounding residents. They don’t have claim on land value rising resulting from greater accessibility but they share the benefit that give rise to capitalization [12]. The compact city model is supported for a number of reasons which relate to sustainable urban development and include: conservation of the countryside, less need to travel by car, thus reduced fuel emissions supports for public transport and walking and cycling, more efficient utility and infrastructure provision Burton 2003 and re- vitalisation and regeneration of inner urban areas [13]. “New urbanism” is a broadly defined movement that seeks to end the cancerous sprawl and replace this type of expansion of growth with redesigned cultural residents that encourage genuine commitment to civic life. It tends to create new ways of guaranteeing the design of pedes- trian, public and semi-private spaces, as well as vehicular movement. The importance of humanly scaled design in the metropolitan landscape and the city are the stirring call for New Urbanism. The New Urbanism pays atten- tion to local condition and adjusted concepts principles, which will transcend local differences into a unique ur- ban pattern. In the view of this trend, the physical envi- ronment is an integrated product of culture, religion, cli- Copyright © 2013 SciRes. OJEE 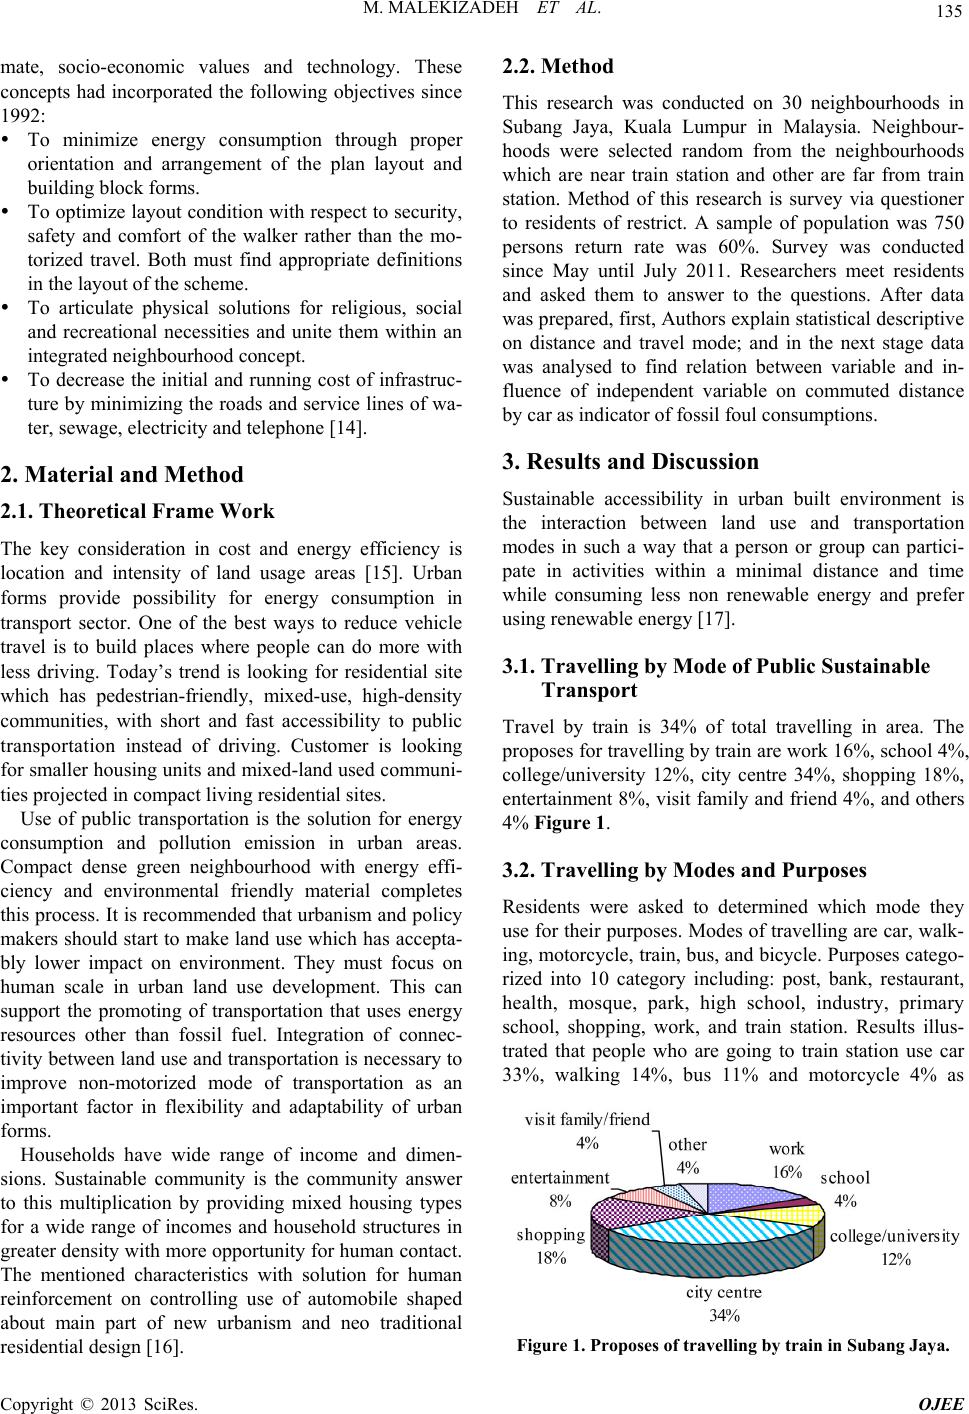 M. MALEKIZADEH ET AL. 135 mate, socio-economic values and technology. These concepts had incorporated the following objectives since 1992: To minimize energy consumption through proper orientation and arrangement of the plan layout and building block forms. To optimize layout condition with respect to security, safety and comfort of the walker rather than the mo- torized travel. Both must find appropriate definitions in the layout of the scheme. To articulate physical solutions for religious, social and recreational necessities and unite them within an integrated neighbourhood concept. To decrease the initial and running cost of infrastruc- ture by minimizing the roads and service lines of wa- ter, sewage, electricity and telephone [14]. 2. Material and Method 2.1. Theoretical Frame Work The key consideration in cost and energy efficiency is location and intensity of land usage areas [15]. Urban forms provide possibility for energy consumption in transport sector. One of the best ways to reduce vehicle travel is to build places where people can do more with less driving. Today’s trend is looking for residential site which has pedestrian-friendly, mixed-use, high-density communities, with short and fast accessibility to public transportation instead of driving. Customer is looking for smaller housing units and mixed-land used communi- ties projected in compact living residential sites. Use of public transportation is the solution for energy consumption and pollution emission in urban areas. Compact dense green neighbourhood with energy effi- ciency and environmental friendly material completes this process. It is recommended that urbanism and policy makers should start to make land use which has accepta- bly lower impact on environment. They must focus on human scale in urban land use development. This can support the promoting of transportation that uses energy resources other than fossil fuel. Integration of connec- tivity between land use and transportation is necessary to improve non-motorized mode of transportation as an important factor in flexibility and adaptability of urban forms. Households have wide range of income and dimen- sions. Sustainable community is the community answer to this multiplication by providing mixed housing types for a wide range of incomes and household structures in greater density with more opportunity for human contact. The mentioned characteristics with solution for human reinforcement on controlling use of automobile shaped about main part of new urbanism and neo traditional residential design [16]. 2.2. Method This research was conducted on 30 neighbourhoods in Subang Jaya, Kuala Lumpur in Malaysia. Neighbour- hoods were selected random from the neighbourhoods which are near train station and other are far from train station. Method of this research is survey via questioner to residents of restrict. A sample of population was 750 persons return rate was 60%. Survey was conducted since May until July 2011. Researchers meet residents and asked them to answer to the questions. After data was prepared, first, Authors explain statistical descriptive on distance and travel mode; and in the next stage data was analysed to find relation between variable and in- fluence of independent variable on commuted distance by car as indicator of fossil foul consumptions. 3. Results and Discussion Sustainable accessibility in urban built environment is the interaction between land use and transportation modes in such a way that a person or group can partici- pate in activities within a minimal distance and time while consuming less non renewable energy and prefer using renewable energy [17]. 3.1. Travelling by Mode of Public Sustainable Transport Travel by train is 34% of total travelling in area. The proposes for travelling by train are work 16%, school 4%, college/university 12%, city centre 34%, shopping 18%, entertainment 8%, visit family and friend 4%, and others 4% Figure 1. 3.2. Travelling by Modes and Purposes Residents were asked to determined which mode they use for their purposes. Modes of travelling are car, walk- ing, motorcycle, train, bus, and bicycle. Purposes catego- rized into 10 category including: post, bank, restaurant, health, mosque, park, high school, industry, primary school, shopping, work, and train station. Results illus- trated that people who are going to train station use car 33%, walking 14%, bus 11% and motorcycle 4% as Figure 1. Proposes of trave l ling by tr ain in Subang Jay a. Copyright © 2013 SciRes. OJEE  M. MALEKIZADEH ET AL. 136 mode of travelling. They use of car 42%, walking 9%, train 7%, bus 5%, motorcycle 5%, and bicycle 2% for travelling to work place. This percents for travelling to shops are car 38%, walking 16%, bus 5% motorcycle 5% train 3% and bicycle 2%. Residents mostly walk for ac- cess to park and green space 34% travelling by car with 18% is second travelling mode for access to park, mo- torcycle 7%, bus 5% and bicycle 2%. Figure 2 shows percents of trip by mode of travelling for each purpose. 3.3. Purposes of Travelling by Car and Car Ownership Residents were asked to answer how many car they have, based on their answer, result of this survey shows 69.7% of residents have at least one car; 58.4% of people have 1 car, 37.7% of people have 2 cars, and 3.7% of people have 3 cars. Travel to work and shopping are main pro- pose of use of cars in area. Figure 3 illustrates proposes of travelling by car for each purpose in Subang Jaya. Population size and car ownership support railway sig- nificantly. Railway station which has neighbourhood with higher average car ownership household has higher positive patronage level compare with those neighbour- hoods with lower average car ownership. Car ownership Figure 2. Travel mode for access to local facilities. Figure 3. Traveling by care for accessibility to facilities. associates with park and ride and pick-ups and drop-off to transit station for longer trip by transit system [18]. 3.4. Impact of Train Station on Distance to Facilities Travelling by train as sustainable public transportation influences fossil foul consumption. Accessibility to train station makes people use more this travel mode directly, but decrease distances to facilities near station decrease use of motorized travel indirectly [19]. Researchers looked to find interaction between nearness to train sta- tion and variables of distances to facilities and employ- ment. Correlation coefficient was used in this analysis to interpret whether a relationship existed between distance to train station and distance to facilities and employment. Correlation was also used to test whether the relationship between distance to train station and distance to facilities are positive or negative. The Pearson correlation coefficient, commonly abbre- viated as “r” measures the degree to which a linear rela- tionship exists between two variables. A perfect, positive linear relationship between two variables has a value of 1.00, while a perfect, negative linear relationship has a value of −1.00. If there is no relationship at all it is re- corded as 0.00. Correlation coefficients test illustrated distance to train station and distance to facilities and em- ployments have correlation significantly Table 1. 3.5. Multiple Regressions Residents of communities with high-density, mixed-use, pedestrian-friendly, ideally with ready access to public transportation, drive a third fewer miles than those who are living in convection outskirts of a city [20]. Generally residents select the closest facility to their location. This selection may come from the fact that most services like post office, bank and so on are equal or based on hierar- chy service provider which covers special area. But peo- ple may travel for other facilities which have differences in quality or are symbolic like cinemas, special shops and recreational facilities from their place to other places [21]. In the final analysis researchers used linear regressions model to test the contribution of independent variables that explain the variation in a dependent phenomenon, explain the nature (positive or negative) and slope of the relationship, and provide a means to control for inter- vening factors. In the last stage result of the previous stage will be used to develop a model of efficient resi- dential site and neighbourhood via measuring influence of distance to restaurant, distance to school, distance to park, house area per person, cars ownership, and pedes- trian quality as independent variable on derived distance by car ownership weekly Table 2. Copyright © 2013 SciRes. OJEE 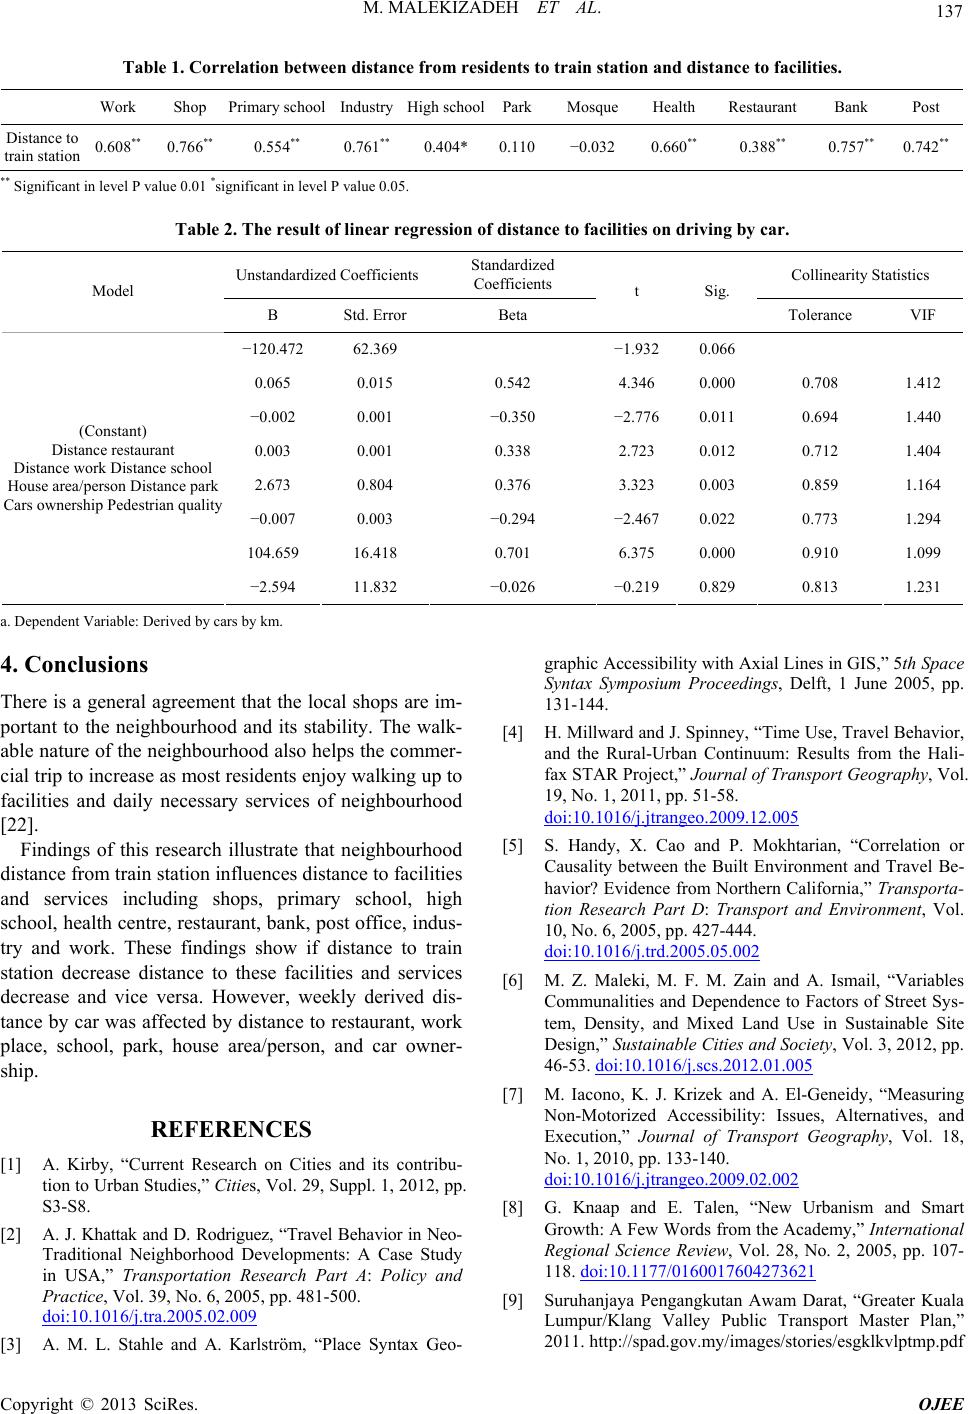 M. MALEKIZADEH ET AL. Copyright © 2013 SciRes. OJEE 137 Table 1. Correlation between distance from residents to train station and distance to facilities. Work Shop Primary school IndustryHigh schoolPark Mosque Health Restaurant Bank Post Distance to train station 0.608** 0.766** 0.554** 0.761** 0.404* 0.110 −0.032 0.660** 0.388** 0.757** 0.742** ** Significant in level P value 0.01 *significant in level P value 0.05. Table 2. The result of linear regression of distance to facilities on driving by car. Unstandardized CoefficientsStandardized Coefficients Collinearity Statistics Model B Std. Error Beta t Sig. Tolerance VIF −120.472 62.369 −1.932 0.066 0.065 0.015 0.542 4.346 0.000 0.708 1.412 −0.002 0.001 −0.350 −2.776 0.011 0.694 1.440 0.003 0.001 0.338 2.723 0.012 0.712 1.404 2.673 0.804 0.376 3.323 0.003 0.859 1.164 −0.007 0.003 −0.294 −2.467 0.022 0.773 1.294 104.659 16.418 0.701 6.375 0.000 0.910 1.099 (Constant) Distance restaurant Distance work Distance school House area/person Distance park Cars ownership Pedestrian quality −2.594 11.832 −0.026 −0.219 0.829 0.813 1.231 a. Dependent Variable: Derived by cars by km. 4. Conclusions There is a general agreement that the local shops are im- portant to the neighbourhood and its stability. The walk- able nature of the neighbourhood also helps the commer- cial trip to increase as most residents enjoy walking up to facilities and daily necessary services of neighbourhood [22]. Findings of this research illustrate that neighbourhood distance from train station influences distance to facilities and services including shops, primary school, high school, health centre, restaurant, bank, post office, indus- try and work. These findings show if distance to train station decrease distance to these facilities and services decrease and vice versa. However, weekly derived dis- tance by car was affected by distance to restaurant, work place, school, park, house area/person, and car owner- ship. REFERENCES [1] A. Kirby, “Current Research on Cities and its contribu- tion to Urban Studies,” Cities, Vol. 29, Suppl. 1, 2012, pp. S3-S8. [2] A. J. Khattak and D. Rodriguez, “Travel Behavior in Neo- Traditional Neighborhood Developments: A Case Study in USA,” Transportation Research Part A: Policy and Practice, Vol. 39, No. 6, 2005, pp. 481-500. doi:10.1016/j.tra.2005.02.009 [3] A. M. L. Stahle and A. Karlström, “Place Syntax Geo- graphic Accessibility with Axial Lines in GIS,” 5th Space Syntax Symposium Proceedings, Delft, 1 June 2005, pp. 131-144. [4] H. Millward and J. Spinney, “Time Use, Travel Behavior, and the Rural-Urban Continuum: Results from the Hali- fax STAR Project,” Journal of Transport Geography, Vol. 19, No. 1, 2011, pp. 51-58. doi:10.1016/j.jtrangeo.2009.12.005 [5] S. Handy, X. Cao and P. Mokhtarian, “Correlation or Causality between the Built Environment and Travel Be- havior? Evidence from Northern California,” Transporta- tion Research Part D: Transport and Environment, Vol. 10, No. 6, 2005, pp. 427-444. doi:10.1016/j.trd.2005.05.002 [6] M. Z. Maleki, M. F. M. Zain and A. Ismail, “Variables Communalities and Dependence to Factors of Street Sys- tem, Density, and Mixed Land Use in Sustainable Site Design,” Sustainable Cities and Society, Vol. 3, 2012, pp. 46-53. doi:10.1016/j.scs.2012.01.005 [7] M. Iacono, K. J. Krizek and A. El-Geneidy, “Measuring Non-Motorized Accessibility: Issues, Alternatives, and Execution,” Journal of Transport Geography, Vol. 18, No. 1, 2010, pp. 133-140. doi:10.1016/j.jtrangeo.2009.02.002 [8] G. Knaap and E. Talen, “New Urbanism and Smart Growth: A Few Words from the Academy,” International Regional Science Review, Vol. 28, No. 2, 2005, pp. 107- 118. doi:10.1177/0160017604273621 [9] Suruhanjaya Pengangkutan Awam Darat, “Greater Kuala Lumpur/Klang Valley Public Transport Master Plan,” 2011. http://spad.gov.my/images/stories/esgklkvlptmp.pdf 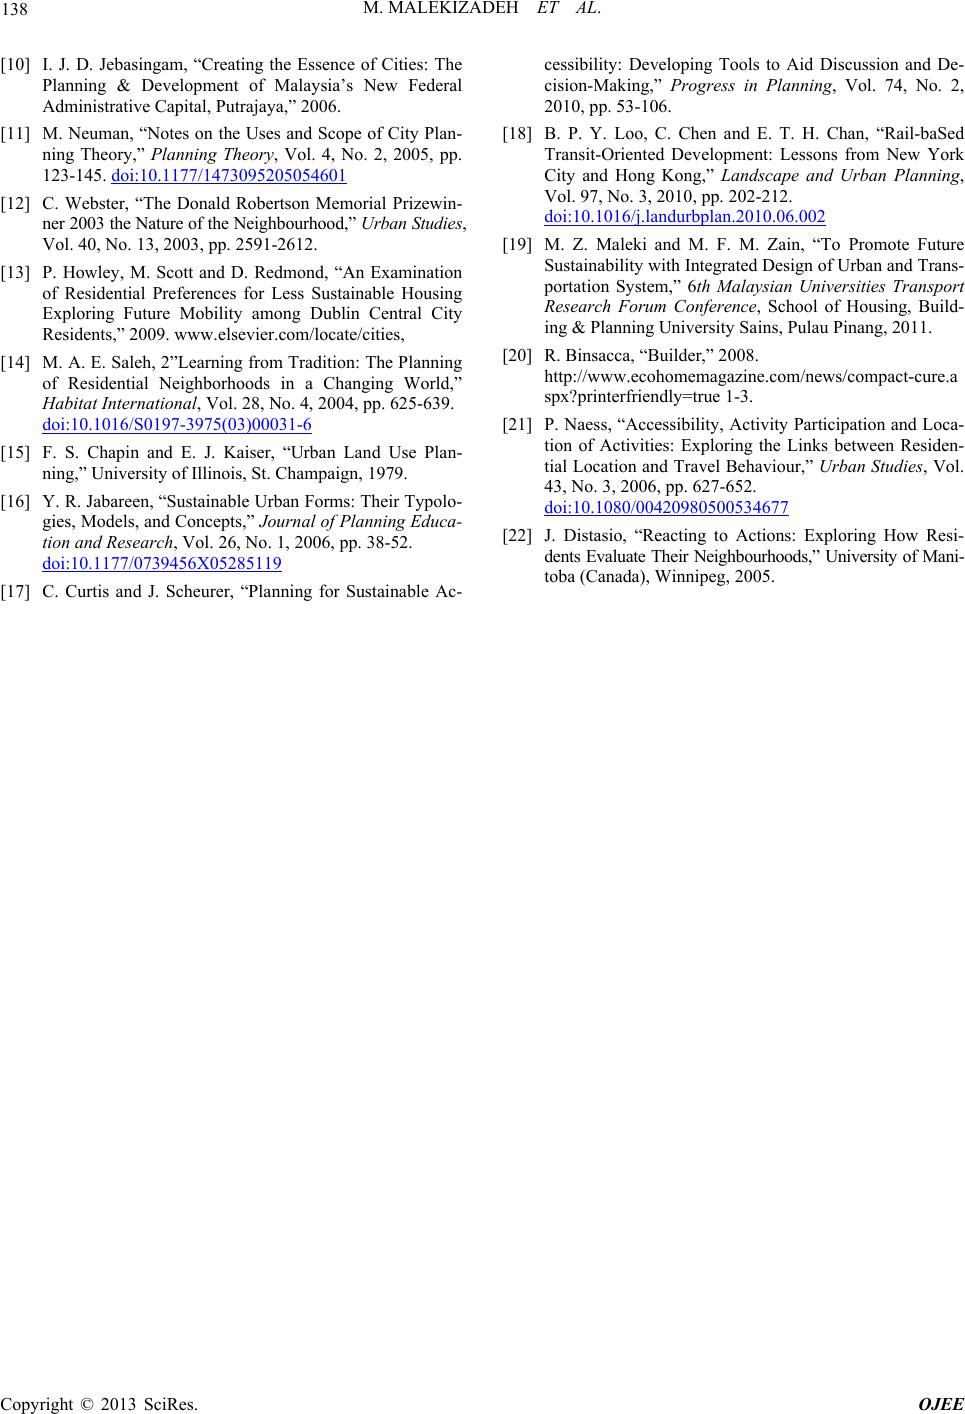 M. MALEKIZADEH ET AL. 138 [10] I. J. D. Jebasingam, “Creating the Essence of Cities: The Planning & Development of Malaysia’s New Federal Administrative Capital, Putrajaya,” 2006. [11] M. Neuman, “Notes on the Uses and Scope of City Plan- ning Theory,” Planning Theory, Vol. 4, No. 2, 2005, pp. 123-145. doi:10.1177/1473095205054601 [12] C. Webster, “The Donald Robertson Memorial Prizewin- ner 2003 the Nature of the Neighbourhood,” Urban Studies, Vol. 40, No. 13, 2003, pp. 2591-2612. [13] P. Howley, M. Scott and D. Redmond, “An Examination of Residential Preferences for Less Sustainable Housing Exploring Future Mobility among Dublin Central City Residents,” 2009. www.elsevier.com/locate/cities, [14] M. A. E. Saleh, 2”Learning from Tradition: The Planning of Residential Neighborhoods in a Changing World,” Habitat International, Vol. 28, No. 4, 2004, pp. 625-639. doi:10.1016/S0197-3975(03)00031-6 [15] F. S. Chapin and E. J. Kaiser, “Urban Land Use Plan- ning,” University of Illinois, St. Champaign, 1979. [16] Y. R. Jabareen, “Sustainable Urban Forms: Their Typolo- gies, Models, and Concepts,” Journal of Planning Educa- tion and Research, Vol. 26, No. 1, 2006, pp. 38-52. doi:10.1177/0739456X05285119 [17] C. Curtis and J. Scheurer, “Planning for Sustainable Ac- cessibility: Developing Tools to Aid Discussion and De- cision-Making,” Progress in Planning, Vol. 74, No. 2, 2010, pp. 53-106. [18] B. P. Y. Loo, C. Chen and E. T. H. Chan, “Rail-baSed Transit-Oriented Development: Lessons from New York City and Hong Kong,” Landscape and Urban Planning, Vol. 97, No. 3, 2010, pp. 202-212. doi:10.1016/j.landurbplan.2010.06.002 [19] M. Z. Maleki and M. F. M. Zain, “To Promote Future Sustainability with Integrated Design of Urban and Trans- portation System,” 6th Malaysian Universities Transport Research Forum Conference, School of Housing, Build- ing & Planning University Sains, Pulau Pinang, 2011. [20] R. Binsacca, “Builder,” 2008. http://www.ecohomemagazine.com/news/compact-cure.a spx?printerfriendly=true 1-3. [21] P. Naess, “Accessibility, Activity Participation and Loca- tion of Activities: Exploring the Links between Residen- tial Location and Travel Behaviour,” Urban Studies, Vol. 43, No. 3, 2006, pp. 627-652. doi:10.1080/00420980500534677 [22] J. Distasio, “Reacting to Actions: Exploring How Resi- dents Evaluate Their Neighbourhoods,” University of Mani- toba (Canada), Winnipeg, 2005. Copyright © 2013 SciRes. OJEE |