

Paper Menu >>
Journal Menu >>
 Journal of Analytical Sciences, Methods and Instrumentation, 2013, 3, 173-178 http://dx.doi.org/10.4236/jasmi.2013.33022 Published Online September 2013 (http://www.scirp.org/journal/jasmi) 173 Determination of Interaction between NFκB p50 and β-IFN-κB Binding Oligo Using AlphaLISA in HTP Fashion Muniasamy Neerathilingam1,2*, Sai Gandham2, Falguni Patel1, Mohammad Nasiruddin1 1Centre for Cellular Molecular Platforms (C-CAMP), NCBS-TIFR, GKVK Campus, Bangalore, India; 2Institute of Molecular Medi- cine (IMM), University of Texas Health Science Center, Houston, USA. Email: *[email protected] Received July 28th, 2013; revised August 25th, 2013; accepted September 1st, 2013 Copyright © 2013 Muniasamy Neerathilingam et al. This is an open access article distributed under the Creative Commons Attribu- tion License, which permits unrestricted use, distribution, and reproduction in any medium, provided the original work is properly cited. ABSTRACT NF-κB plays a crucial role in regulating various biological processes including innate and adaptive immunity, inflam- mation, stress responses, B-cell development, and lymphoid organogenesis. Currently, several assays like electropho- retic mobility shift assay (EMSA), enzyme-linked immunosorbent assay (ELISA), fluorescence resonance energy transfer (FRET) and time-resolved fluorescence resonance energy transfer (TR-FRET) are widely used for studying the NFκB intraction with β-IFN-κB binding oligo. Each of these techniques has varying utility with distinct strengths and weaknesses. We describe a method AlphaLISA to identify NFκB p50 protein and β-IFN-κB binding oligo sequence and interaction is efficient at a given concentration (10 nM) in the EMSA and Biacore’s SPR assays. The method has many advantages such as use of small volume, high throughput (HTP), convenience of sample preparation and data analysis. Keywords: DNA-Protein Interaction; Binding Constant; Equilibrium Constant; AlphaLISA; High Throughput (HTP) 1. Introduction Protein-DNA interactions control the defining hallmarks of all cellular processes and functions like DNA tran- scription, packaging, replication and repair [1]. These interactions can be studied using the classical steady- state and time-resolved methods to understand the con- formational changes and enzymatic reactions for a given Protein-DNA complex [2]. In this study we have taken the case of NF-κB. NF-κB is a sequence specific transcriptional factor made up of different protein dimers that binds to a com- mon sequence motif known as the κB site. NF-κB plays a key role in regulating a broad range of biological proc- esses including innate and adaptive immunity, inflamma- tion, stress responses, cell proliferation, apoptosis, mi- gration, and lymphoid organogenesis. Disregulation of NF-κB has been linked to inflammatory disorders, cancer, autoimmune diseases and metabolic diseases [3-6]. Pri- marily regulation of gene expression occurs at the level of transcription [7]. IκB, the inhibitor and central regula- tor of NFκB which prevents nuclear import of NFκB and disrupts the NFκB-DNA complexes in the nucleus and retain NFκB in cytoplasm. Proteasomal degradation of IκB leads to the transport of NFκB into nucleaus where it binds to DNA sites in its target promoters and regulate transcription [8]. Currently, assays like electrophoretic mobility shift assay (EMSA), enzyme-linked immunosorbent assay (ELISA), fluorescence resonance energy transfer (FRET) and time-resolved fluorescence resonance energy transfer (TR-FRET) are widely used for studying DNA-protein interactions. Each of these techniques has varying utility with distinct strengths and weaknesses. For example, EMSA is less informative in terms of protein-DNA in- teraction dynamics and protein identity [9]. ELISA is another broadly used method that provides high sensitiv- ity, but needs cumbersome wash steps for antibody ad- sorption owing to its larger well surface area. The draw- backs of ELISA include high cost, labour-intensive and low dynamic range [10]. TR-FRET and FRET assays have a proximity detection limit of within 2 nm distance [11]. Biacore Surface Plasmon Resonance (SPR) cannot be used for high throughput (HTP) screening owing to the need for multiple runs. The notable drawbacks of this system are background resonance and limited range of Kon and Koff values [12]. Despite the above limitations, *Corresponding author. Copyright © 2013 SciRes. JASMI 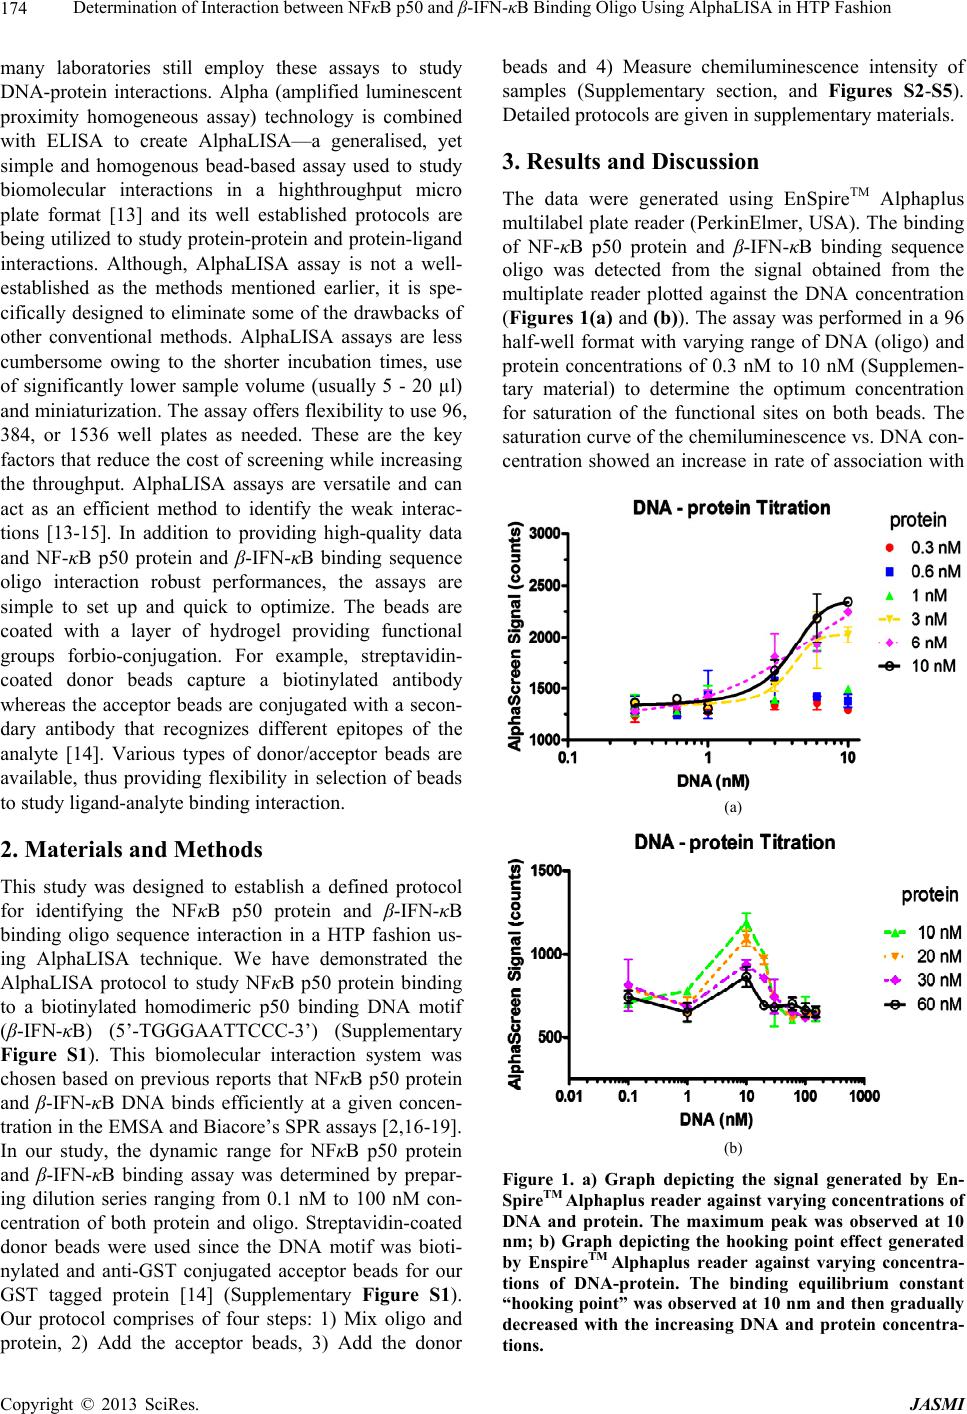 Determination of Interaction between NFκB p50 and β-IFN-κB Binding Oligo Using AlphaLISA in HTP Fashion 174 many laboratories still employ these assays to study DNA-protein interactions. Alpha (amplified luminescent proximity homogeneous assay) technology is combined with ELISA to create AlphaLISA—a generalised, yet simple and homogenous bead-based assay used to study biomolecular interactions in a highthroughput micro plate format [13] and its well established protocols are being utilized to study protein-protein and protein-ligand interactions. Although, AlphaLISA assay is not a well- established as the methods mentioned earlier, it is spe- cifically designed to eliminate some of the drawbacks of other conventional methods. AlphaLISA assays are less cumbersome owing to the shorter incubation times, use of significantly lower sample volume (usually 5 - 20 µl) and miniaturization. The assay offers flexibility to use 96, 384, or 1536 well plates as needed. These are the key factors that reduce the cost of screening while increasing the throughput. AlphaLISA assays are versatile and can act as an efficient method to identify the weak interac- tions [13-15]. In addition to providing high-quality data and NF-κB p50 protein and β-IFN-κB binding sequence oligo interaction robust performances, the assays are simple to set up and quick to optimize. The beads are coated with a layer of hydrogel providing functional groups forbio-conjugation. For example, streptavidin- coated donor beads capture a biotinylated antibody whereas the acceptor beads are conjugated with a secon- dary antibody that recognizes different epitopes of the analyte [14]. Various types of donor/acceptor beads are available, thus providing flexibility in selection of beads to study ligand-analyte binding interaction. 2. Materials and Methods This study was designed to establish a defined protocol for identifying the NFκB p50 protein and β-IFN-κB binding oligo sequence interaction in a HTP fashion us- ing AlphaLISA technique. We have demonstrated the AlphaLISA protocol to study NFκB p50 protein binding to a biotinylated homodimeric p50 binding DNA motif (β-IFN-κB) (5’-TGGGAATTCCC-3’) (Supplementary Figure S1). This biomolecular interaction system was chosen based on previous reports that NFκB p50 protein and β-IFN-κB DNA binds efficiently at a given concen- tration in the EMSA and Biacore’s SPR assays [2,16-19]. In our study, the dynamic range for NFκB p50 protein and β-IFN-κB binding assay was determined by prepar- ing dilution series ranging from 0.1 nM to 100 nM con- centration of both protein and oligo. Streptavidin-coated donor beads were used since the DNA motif was bioti- nylated and anti-GST conjugated acceptor beads for our GST tagged protein [14] (Supplementary Figure S1). Our protocol comprises of four steps: 1) Mix oligo and protein, 2) Add the acceptor beads, 3) Add the donor beads and 4) Measure chemiluminescence intensity of samples (Supplementary section, and Figures S2-S5). Detailed protocols are given in supplementary materials. 3. Results and Discussion The data were generated using EnSpireTM Alphaplus multilabel plate reader (PerkinElmer, USA). The binding of NF-κB p50 protein and β-IFN-κB binding sequence oligo was detected from the signal obtained from the multiplate reader plotted against the DNA concentration (Figures 1(a) and (b)). The assay was performed in a 96 half-well format with varying range of DNA (oligo) and protein concentrations of 0.3 nM to 10 nM (Supplemen- tary material) to determine the optimum concentration for saturation of the functional sites on both beads. The saturation curve of the chemiluminescence vs. DNA con- centration showed an increase in rate of association with (a) (b) Figure 1. a) Graph depicting the signal generated by En- SpireTM Alphaplus reader against varying concentrations of DNA and protein. The maximum peak was observed at 10 nm; b) Graph depicting the hooking point effect generated by EnspireTM Alphaplus reader against varying concentra- tions of DNA-protein. The binding equilibrium constant “hooking point” was observed at 10 nm and then gradually decreased with the increasing DNA and protein concentra- tions. Copyright © 2013 SciRes. JASMI 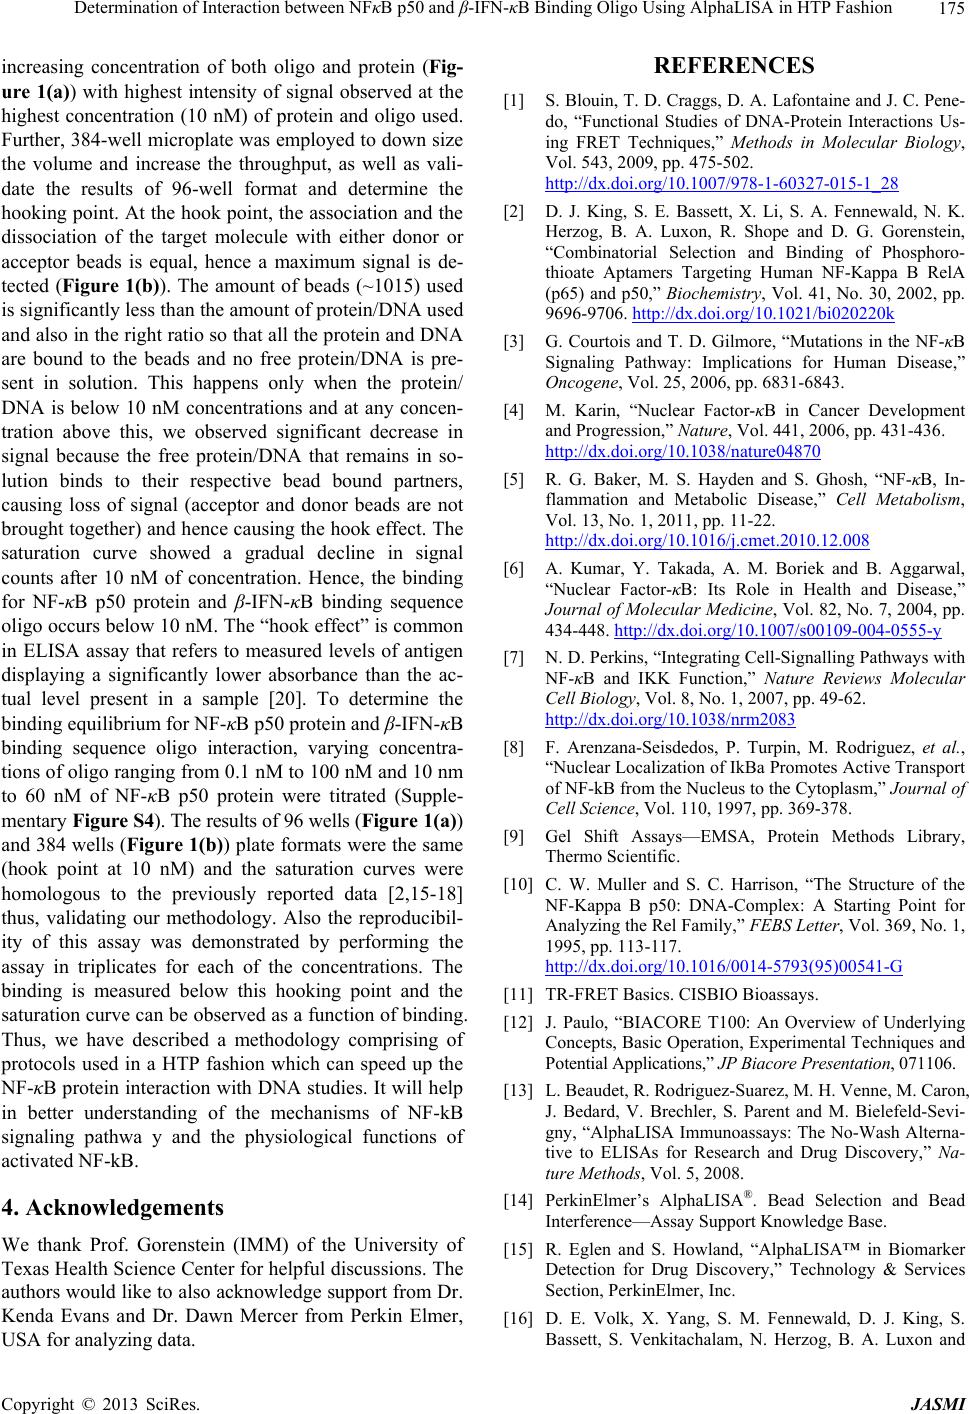 Determination of Interaction between NFκB p50 and β-IFN-κB Binding Oligo Using AlphaLISA in HTP Fashion 175 increasing concentration of both oligo and protein (Fig- ure 1(a)) with highest intensity of signal observed at the highest concentration (10 nM) of protein and oligo used. Further, 384-well microplate was employed to down size the volume and increase the throughput, as well as vali- date the results of 96-well format and determine the hooking point. At the hook point, the association and the dissociation of the target molecule with either donor or acceptor beads is equal, hence a maximum signal is de- tected (Figure 1(b)). The amount of beads (~1015) used is significantly less than the amount of protein/DNA used and also in the right ratio so that all the protein and DNA are bound to the beads and no free protein/DNA is pre- sent in solution. This happens only when the protein/ DNA is below 10 nM concentrations and at any concen- tration above this, we observed significant decrease in signal because the free protein/DNA that remains in so- lution binds to their respective bead bound partners, causing loss of signal (acceptor and donor beads are not brought together) and hence causing the hook effect. The saturation curve showed a gradual decline in signal counts after 10 nM of concentration. Hence, the binding for NF-κB p50 protein and β-IFN-κB binding sequence oligo occurs below 10 nM. The “hook effect” is common in ELISA assay that refers to measured levels of antigen displaying a significantly lower absorbance than the ac- tual level present in a sample [20]. To determine the binding equilibrium for NF-κB p50 protein and β-IFN-κB binding sequence oligo interaction, varying concentra- tions of oligo ranging from 0.1 nM to 100 nM and 10 nm to 60 nM of NF-κB p50 protein were titrated (Supple- mentary Figure S4). The results of 96 wells (Figure 1(a)) and 384 wells (Figure 1(b)) plate formats were the same (hook point at 10 nM) and the saturation curves were homologous to the previously reported data [2,15-18] thus, validating our methodology. Also the reproducibil- ity of this assay was demonstrated by performing the assay in triplicates for each of the concentrations. The binding is measured below this hooking point and the saturation curve can be observed as a function of binding. Thus, we have described a methodology comprising of protocols used in a HTP fashion which can speed up the NF-κB protein interaction with DNA studies. It will help in better understanding of the mechanisms of NF-kB signaling pathwa y and the physiological functions of activated NF-kB. 4. Acknowledgements We thank Prof. Gorenstein (IMM) of the University of Texas Health Science Center for helpful discussions. The authors would like to also acknowledge support from Dr. Kenda Evans and Dr. Dawn Mercer from Perkin Elmer, USA for analyzing data. REFERENCES [1] S. Blouin, T. D. Craggs, D. A. Lafontaine and J. C. Pene- do, “Functional Studies of DNA-Protein Interactions Us- ing FRET Techniques,” Methods in Molecular Biology, Vol. 543, 2009, pp. 475-502. http://dx.doi.org/10.1007/978-1-60327-015-1_28 [2] D. J. King, S. E. Bassett, X. Li, S. A. Fennewald, N. K. Herzog, B. A. Luxon, R. Shope and D. G. Gorenstein, “Combinatorial Selection and Binding of Phosphoro- thioate Aptamers Targeting Human NF-Kappa B RelA (p65) and p50,” Biochemistry, Vol. 41, No. 30, 2002, pp. 9696-9706. http://dx.doi.org/10.1021/bi020220k [3] G. Courtois and T. D. Gilmore, “Mutations in the NF-κB Signaling Pathway: Implications for Human Disease,” Oncogene, Vol. 25, 2006, pp. 6831-6843. [4] M. Karin, “Nuclear Factor-κB in Cancer Development and Progression,” Nature, Vol. 441, 2006, pp. 431-436. http://dx.doi.org/10.1038/nature04870 [5] R. G. Baker, M. S. Hayden and S. Ghosh, “NF-κB, In- flammation and Metabolic Disease,” Cell Metabolism, Vol. 13, No. 1, 2011, pp. 11-22. http://dx.doi.org/10.1016/j.cmet.2010.12.008 [6] A. Kumar, Y. Takada, A. M. Boriek and B. Aggarwal, “Nuclear Factor-κB: Its Role in Health and Disease,” Journal of Molecular Medicine, Vol. 82, No. 7, 2004, pp. 434-448. http://dx.doi.org/10.1007/s00109-004-0555-y [7] N. D. Perkins, “Integrating Cell-Signalling Pathways with NF-κB and IKK Function,” Nature Reviews Molecular Cell Biology, Vol. 8, No. 1, 2007, pp. 49-62. http://dx.doi.org/10.1038/nrm2083 [8] F. Arenzana-Seisdedos, P. Turpin, M. Rodriguez, et al., “Nuclear Localization of IkBa Promotes Active Transport of NF-kB from the Nucleus to the Cytoplasm,” Journal of Cell Science, Vol. 110, 1997, pp. 369-378. [9] Gel Shift Assays—EMSA, Protein Methods Library, Thermo Scientific. [10] C. W. Muller and S. C. Harrison, “The Structure of the NF-Kappa B p50: DNA-Complex: A Starting Point for Analyzing the Rel Family,” FEBS Letter, Vol. 369, No. 1, 1995, pp. 113-117. http://dx.doi.org/10.1016/0014-5793(95)00541-G [11] TR-FRET Basics. CISBIO Bioassays. [12] J. Paulo, “BIACORE T100: An Overview of Underlying Concepts, Basic Operation, Experimental Techniques and Potential Applications,” JP Biacore Presentation, 071106. [13] L. Beaudet, R. Rodriguez-Suarez, M. H. Venne, M. Caron, J. Bedard, V. Brechler, S. Parent and M. Bielefeld-Sevi- gny, “AlphaLISA Immunoassays: The No-Wash Alterna- tive to ELISAs for Research and Drug Discovery,” Na- ture Methods, Vol. 5, 2008. [14] PerkinElmer’s AlphaLISA®. Bead Selection and Bead Interference—Assay Support Knowledge Base. [15] R. Eglen and S. Howland, “AlphaLISA™ in Biomarker Detection for Drug Discovery,” Technology & Services Section, PerkinElmer, Inc. [16] D. E. Volk, X. Yang, S. M. Fennewald, D. J. King, S. Bassett, S. Venkitachalam, N. Herzog, B. A. Luxon and Copyright © 2013 SciRes. JASMI  Determination of Interaction between NFκB p50 and β-IFN-κB Binding Oligo Using AlphaLISA in HTP Fashion Copyright © 2013 SciRes. JASMI 176 D. G. Gorenstein, “Solution Structure and Design of Di- thiophosphate Backbone Aptamers Targeting Transcrip- tion Factor NF-Kappa B,” Bioorganic Chemistry, Vol. 30, No. 6, 2002, pp. 396-419. http://dx.doi.org/10.1016/S0045-2068(02)00510-2 [17] T. Fujita, G. P. Nolan, S. Ghosh and D. Baltimore, “In- dependent Modes of Transcriptional Activation by the p50 and p65 Subunits of NF-Kappa B,” Genes & Devel- opment, Vol. 6, 1992, pp. 775-787. http://dx.doi.org/10.1101/gad.6.5.775 [18] D. Thanos and T. Maniatis, “The High Mobility Group Protein HMG I (Y) Is Required for NF-Kappa B-Depen- dent Virus Induction of the Human IFN-Beta Gene,” Cell, Vol. 71, No. 5, 1992, pp. 777-789. http://dx.doi.org/10.1016/0092-8674(92)90554-P [19] PerkinElmer’s AlphaLISA®. Determining KD with an Alpha Assay. [20] PerkinElmer’s AlphaLISA®. The Hook Effect—Assay Support Knowledge Base.  Determination of Interaction between NFκB p50 and β-IFN-κB Binding Oligo Using AlphaLISA in HTP Fashion 177 Supplementary Data Materials and Methods Reagents 1) Anti-GST conjugated Acceptor beads (Perkin Elmer- AL110M) 2) Streptavidin coated donor beads (Perkin Elmer- 6760002) 3) DNA construct (5’-TGGGAATTCCC-3’) (Midland Certified Reagents, Midland, TX). 4) Purified Protein (NFκB p50) (Fujita et al., 1992) 5) MilliQ water Instrument 1) EnSpireTM Alphaplus multiplate reader (PerkinElmer). Miscellaneous 1) AlphaPlate-384 (PerkinElmer-6005350) 3) Pipettes Thermo Scientific (2 - 10 μl - 10 - 100 μl) 4) Pipette tips (10 μl - 200 μl) Figure S1. Schematic representation of AlphaLISA screen of NF-KB p50 binding sequence oligo motif Biotinylated- TGGGAATTCCC. Figure S2. Flowchart explaining the protocol for AlphaLISA screens (96 wells format). 1. Mix 10 μl oligo and 10 ul protein. 2. Add 15 μl of Anti-GST conjugate acceptor beads and incubate it for one hour at 23˚C to allow the conjugation between the beads and the protein. 3. Add 15 μl streptavidin coated donor beads (20 mg/ml final concentration) and again incubate it for one hour at 23˚C in dark since the beads are light sensitive and lastly. 4. Reading of samples in EnSpireTM Alphaplus multi- plate reader (PerkinElmer). Figure S3. Plate map of EnSpire Alphaplus (96 wells format): The highest peak was observed at 10 nM concentration of both DNA and protein. The maximum reading is highlighted by violet color square box (initial reaction was performed in dupli- cate). Data Analysis: The dynamic range for NF-κB DNA motif Biotinylated-TGGGAATTCCC assay were determined by preparing a diluted series ranging from 0.3 nM concentration of both protein and oligo. The data was generated using En- SpireTM Alphaplus reader (Figure S3). The binding equilibrium constant of the given protein-oligo interaction was deter- mined by plotting a graph of the signal obtained from the plate reader against the DNA-protein concentration. Copyright © 2013 SciRes. JASMI 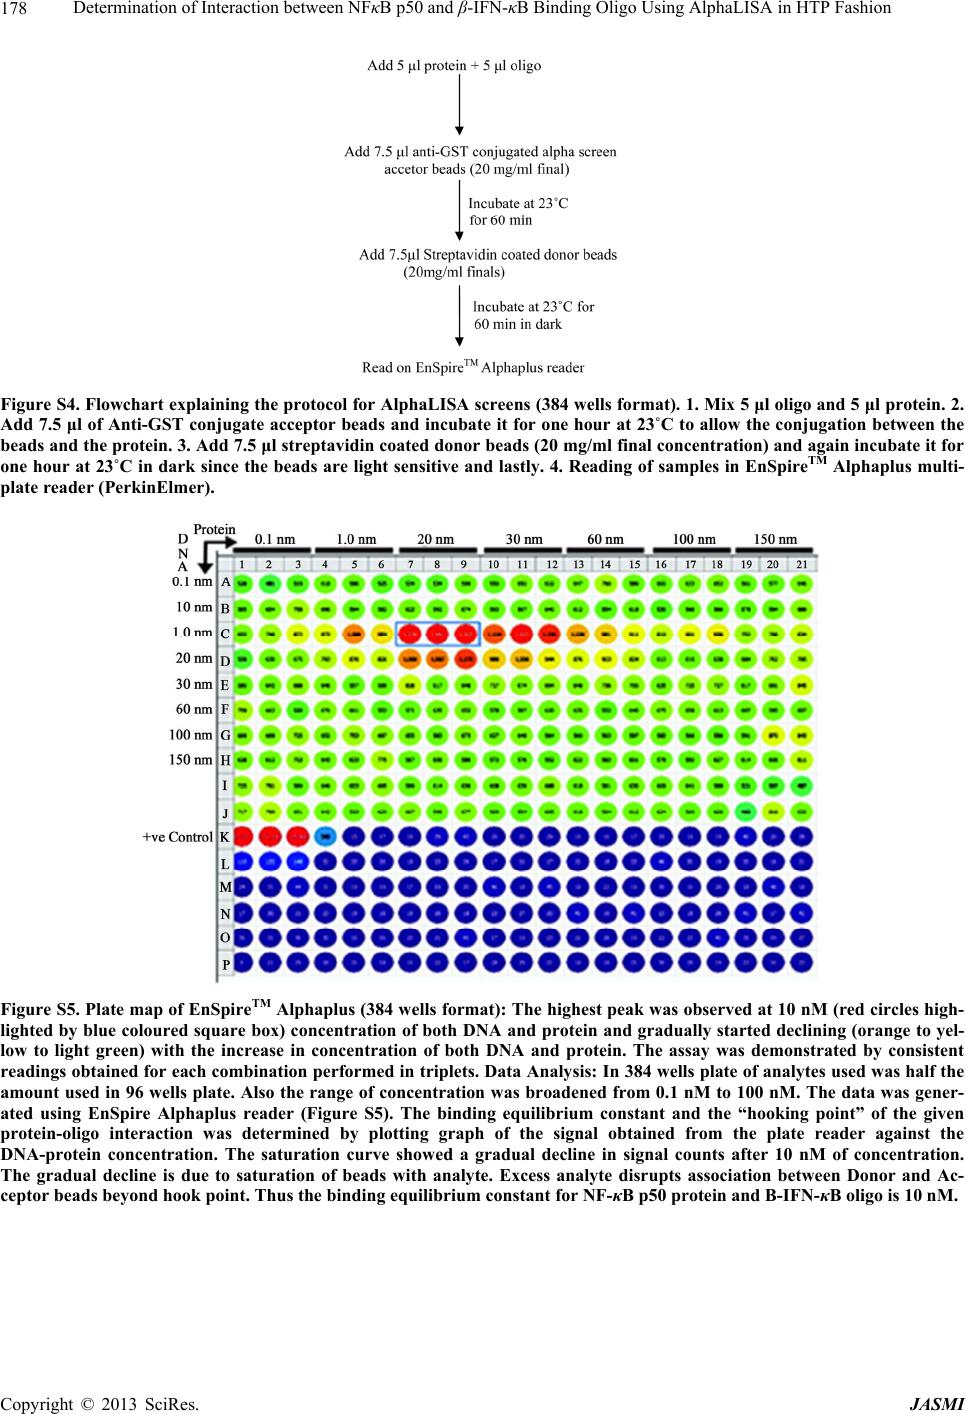 Determination of Interaction between NFκB p50 and β-IFN-κB Binding Oligo Using AlphaLISA in HTP Fashion 178 Figure S4. Flowchart explaining the protocol for AlphaLISA screens (384 wells format). 1. Mix 5 μl oligo and 5 μl protein. 2. Add 7.5 μl of Anti-GST conjugate acceptor beads and incubate it for one hour at 23˚C to allow the conjugation between the beads and the protein. 3. Add 7.5 μl streptavidin coated donor beads (20 mg/ml final concentration) and again incubate it for one hour at 23˚C in dark since the beads are light sensitive and lastly. 4. Reading of samples in EnSpireTM Alphaplus multi- plate reader (PerkinElmer). Figure S5. Plate map of EnSpireTM Alphaplus (384 wells format): The highest peak was observed at 10 nM (red circles high- lighted by blue coloured square box) concentration of both DNA and protein and gradually started declining (orange to yel- low to light green) with the increase in concentration of both DNA and protein. The assay was demonstrated by consistent readings obtained for each combination performed in triplets. Data Analysis: In 384 wells plate of analytes used was half the amount used in 96 wells plate. Also the range of concentration was broadened from 0.1 nM to 100 nM. The data was gener- ated using EnSpire Alphaplus reader (Figure S5). The binding equilibrium constant and the “hooking point” of the given protein-oligo interaction was determined by plotting graph of the signal obtained from the plate reader against the DNA-protein concentration. The saturation curve showed a gradual decline in signal counts after 10 nM of concentration. The gradual decline is due to saturation of beads with analyte. Excess analyte disrupts association between Donor and Ac- ceptor beads beyond hook point. Thus the binding equilibrium constant for NF-κB p50 protein and B-IFN-κB oligo is 10 nM. Copyright © 2013 SciRes. JASMI |