

Paper Menu >>
Journal Menu >>
 Journal of Analytical Sciences, Methods and Instrumentation, 2013, 3, 167-172 http://dx.doi.org/10.4236/jasmi.2013.33021 Published Online September 2013 (http://www.scirp.org/journal/jasmi) 167 Quantitati on of Ge netox I m purities Using a Surrogate Standard Approach Heather Wang, Regina Nardi, Yuri Bereznitski, Roy Helmy, David J. Waterhouse Analytical Chemistry, Merck Research Laboratories, Merck Sharp & Dohme Corp., Rahway, USA. Email: [email protected] Received August 20th, 2013; revised September 18th, 2013; accepted September 24th, 2013 Copyright © 2013 Heather Wang et al. This is an open access article distributed under the Creative Commons Attribu- tion License, which permits unrestricted use, distribution, and reproduction in any medium, provided the original work is properly cited. ABSTRACT With the ever increasing complexity of active pharmaceutical ingredient (API) preparations, more potential genotoxic impurities (PGI’s) are being observed. It is thus necessary to determine if these PGI’s are present in the final API’s, and if they are present, to ensure the levels are acceptable for any clinical uses. For PGI’s that have authentic standards available, quantitation can be accomplished in a straightforward manner. However, for PGI’s that are expected to form through rearrangements or side reactions, authentic standards may not be readily available, significantly complicating the analysis. In this study we describe a surrogate standard approach for quantifying PGI’s that allows for relative re- sponse factor calculations of PGI species utilizing both gas chromatography-mass spectrometry (GC-MS) and liquid chromatography-mass spectrometry (LC-MS). Keywords: Potential Genotoxic Impurity (PGI); Active Pharmaceutical Ingredient (API); Mass Spectrometry; Surrogate Standard; Analyte; Relative Response Factor (RRF) 1. Introduction Identification and control of genotoxic and potential genotoxic impurities (PGI’s) in active pharmaceutical ingredients (API’s) is of utmost importance to ensure patient safety. The allowable levels of PGI’s are deter- mined by a staged Toxicologic Threshold of Concern (TTC) based on both the dose and duration of the in- tended clinical study [1-3]. This allowable amount can be in the low ppm range, which is much lower than the al- lowable levels of non-PGI impurities controlled under guideline ICH Q3a [4]. Therefore, analytical detection and quantification of these low level PGI impurities can be problematic when utilizing only conventional analyti- cal tools such as HPLC with UV detection [5]. Once the synthetic process for the API preparation is finalized, an assessment is undertaken to evaluate the potential for genotoxic intermediates or reagents to per- sist, the potential for genotoxic impurities to form as by-products during the process, and the appropriate con- trol limits for any alerting structures identified [6]. For PGI’s that are reaction intermediates, reaction by-prod- ucts, and for which standards are readily available, con- ventional analytical detection and quantitation methods typically allow for a relatively straightforward analysis. However, the problem of PGI quantitation becomes sig- nificantly more complex when dealing with suspected theoretical PGI’s that could possibly be formed from synthetic rearrangements, byproducts, compound de- composition, etc. No authentic standards typically exist for these PGI’s, and synthetic preparation may not be feasible owing to inherent instability, synthetic complex- ity, or matrix effects. These “PGIs without standards” present the ultimate challenge for an analytical chemist, since without authentic standards, accurate quantitation is extremely difficult. In order to address this issue the cur- rent study focuses on the use of surrogate standards with MS detection as an alternative analytical strategy to de- termine the relative amounts of PGI’s without authentic standards. In order for this strategy to be effective, it is essential to choose a surrogate standard that will afford a similar detector response to the compound of interest. If the surrogate does not ionize in a similar manner, then the indirect quantitation of the PGI could be far from accurate. Dealing with these factors is the focus of this report. Copyright © 2013 SciRes. JASMI  Quantitation of Genetox Impurities Using a Surrogate Standard Approach 168 2. Materials and Methods of Use 2.1. Instrumentation and Analytical Conditions The LC-MS system was comprised of a single quadru- pole MS-9 Agilent (Palo Alto, CA) 1100 Series LC/MSD equipped with an APCI source run utilizing Single Ion Monitoring, an Agilent 1100 Series autosampler and di- ode array. Three mobile phase conditions were used for the study, Method 1: A/B 0.1% formic acid/acetonitrile using gradient elution starting at 90% A to 5% A over 18 minutes and then held for 2 minutes at 5% A; Method 2: A/B 0.1% formic acid/acetonitrile using gradient elution starting at 95% A to 5% A over 18 minutes and then held for 2 minutes at 5% A; Method 3: A/B 10 mM ammo- nium acetate (pH 8.7)/acetonitrile using gradient elution starting at 90% A to 5% A over 18 minutes and then held for 2 minutes at 5% A. Methods 1 and 2 were used for positive ion detection; Method 3 was used for negative ion detection. The flow rate was 1.0 ml/min, the injection volume was 10 µl, while the autosampler was kept at ambient conditions throughout. All separations were ac- complished using a Waters (Billerica, MA) XBridge C18 (4.6 × 150 mm, 3.5 µm) column. The MS conditions were as follows: Drying gas flow 12 ml/min; nebulizer pressure 60 psi; drying gas temperature 350˚C; vaporizer temperature 400˚C; capillary voltage 4000 V; and corona current 10 µA. The scans used were the full scan from 50 - 300 m/z and the fragmenter set at 80 V, while for SIM the fragmenter was set to 120 V. The GC-MS system was comprised of a single quad- rupole (Agilent 5973 Network Mass-Selective Detector) and an Agilent 6850 Series GC system and autosampler. All separations were accomplished using a Restek (Belle- fonte, PA) RX1-6245SIL MS column (20.0 m × 180 µm × 1.00 µm) under the following gradient conditions; Ini- tial: 70˚C for 3 min, increase 30˚C /min to 250 ˚C then held for 10 min. The flow was 1.3 ml/min and the injec- tion volume was 1 µl. Total Ion Monitoring was utilized for all runs. 2.2. Data Analysis All peaks were reviewed and integrated manually when necessary. All data analysis was performed using Agilent Chemstation. 2.3. Chemicals All surrogates and analytes tested were purchased from Sigma Aldrich (Madison, WI) except for 3-ethoxy-2- nitropyridine, 2-chloronicotinoyl chloride, 3-hydroxy-6- methyl-2-nitropyridine, 3-hydroxy-2-nitropyridine, 3- methylbenzyl chloride, 6-methylquinoline, 3,5-dimethyl- benzyl bromide, 3-methylbenzyl bromide, 2-amino-6- methylbenzoic acid, and 2-amino-3-methylbenzoic acid, which were purchased from Alfa Aesar (Ward Hill, MA). All solvents were HPLC-grade and purchased from Fisher Scientific (Pittsburgh, PA). 2.4. Sample Preparation For all positive mode analysis samples were dissolved in acetonitrile, while for all negative mode analysis samples were dissolved in 90/10 10 mM ammonium acetate (pH 8.7)/acetonitrile. 2.5. Calculation of Relative Response Factors RF analyte Relative Response Factors RRFRF surrogate (1) where the individual Response Factor (RF) of each compound is calculated as: MS peakarea RF=analyte concentration (2) Single Ion Monitoring (SIM) of the base peak utilized when calculating peak areas. 3. Results and Discussion In order to determine the feasibility of this surrogate methodology we began the study utilizing surrogate standard and analyte pairs as separate runs. Our reason- ing for this was that we could establish what compounds would serve as appropriate surrogate standards vs the corresponding analytes without the complications of any matrix effects. 3.1. Determination of a Suitable Surrogate Standard Initial attempts in choosing and detecting surrogate stan- dards involved exploring the work of Oss et al. [7]. This work involved directly infusing the organic compounds of interest into an electrospray ionization system. The authors’ purpose was to establish ionization efficiencies of various species, thus this procedure worked well for their application. However, due to the nature of the PGI’s being at much lower levels then the API’s themselves, it seemed that this infusion method used would not be fea- sible for quantitation since no separation occurs, and thus the ionization of the PGI could potentially be suppressed. Therefore, as an alternate approach, LC-ESI-MS was employed as a starting point. However, the LC-ESI-MS method quickly led to difficulties when gradient elution was employed. It was found that as the gradient condi- tions and mobile phase composition changed, so did the RF factors of the analytes of interest (Table 1). The ob- served effect is most likely due to the ESI ionization method itself, which involves ion formation on the sur- face of a droplet while exiting a narrow-bore capillary, Copyright © 2013 SciRes. JASMI  Quantitation of Genetox Impurities Using a Surrogate Standard Approach 169 Table 1. Comparison of the RRF of dimethyl-p-toluidine and dimethyl-m-toluidine under various LC conditions util- izing LC-ESI MS analysis. Mobile Phase dimethyl- p-toluidine dimethyl- m-toluidine 0.1% TFA/acetonitrile 1.0 0.8 0.1% acetic acid/acetonitrile 1.0 0.6 0.1% formic acid/acetonitrile 1.0 1.7 5 mM ammonium acetate/acetonitrile1.0 1.1 and therefore it is expected to be very dependent upon the solvent composition of the droplet [8-10]. In contrast the ionization mechanism of APCI is much different than that of ESI. This ionization technique relies on a corona discharge to supply the charge on the analyte, and thus it hypothesized that use of this method would aid in minimizing RF differences caused by variability of mobile phase and gradient conditions [11]. In addition, acceptable linearity utilizing this technique has been demonstrated; therefore APCI LC-MS seemed to be the logical choice for the present study [12]. A repeat of the previously mentioned experiment confirmed APCI to be a better ionization choice for our purposes and was thus utilized in this study (Ta ble 2). Day-to-day reproducibil- ity was also satisfactory as fresh samples were prepared on three different days and the RRF results obtained were consistent. In parallel, we also explored using GC-MS as the separation and detection mode. The underlying as- sumption was that since the EI ionization mode is rather universal, the detection of similar surrogate standard/ analyte species could be accomplished. As can be inferred from this study, the surrogate stan- dards that have the closest relative response factors are those having functionality similar to that of the PGI’s, the best choice being isomers of the PGI’s themselves. We have determined relative response factors of unity for positional isomers using LC-APCI-MS (M + H for posi- tive mode and M − H for negative mode). If positional isomers are not readily available other structures can be used provided that the ionization mechanism of both is carefully assessed. For instance, two species may seem structurally similar, however if one of the species has functionality that can readily fragment, or if it possess a labile functional group, this can lead to significant over/ underestimation where PGI calculated values do not re- flect the quantity of the PGI that is actually present in the sample. An example of this involves the 2-chloronicoti- noyl chloride/6-chloronicotinoyl chloride pair. When both species were subjected to chromatography followed by MS analysis the parent ions (m/z 176) were not ob- served. This can be clearly seen in the total ion chroma- togram (TIC) for both species (Figure 1). Table 2. Comparison of the RRF of dimethyl-p-toluidine and dimethyl-m-toluidine under various LC conditions util- izing LC-APCI MS analysis. Mobile Phase dimethyl- p-toluidine dimethyl- m-toluidine 0.1% TFA/acetonitrile 1.0 1.0 0.1% acetic acid/acetonitrile 1.0 1.0 0.1% formic acid/acetonitrile 1.0 1.2 5 mM ammonium acetate/acetonitrile 1.0 1.2 (a) (b) Figure 1. a) TIC of 2-chloronicotinoyl chloride; b) TIC of 6-chloronicotinoyl chloride. The base peak detected was the carboxylic acid de- rivative for both (m/z 157.6). When comparing the RRF for this pair utilizing this base peak (see Table 3), the value was 1.6 in the positive APCI mode. However, if another species without the corresponding label aldehyde functionality was used for the calculation, the value may be very different depending on the ion chosen for analy- sis. The results of the surrogate standard/analyte RRF study are shown in Tables 3 and 4. The species are sepa- rated into two tables, one displaying isomers (Table 3) and the other displaying surrogate/analyte species con- taining similar functional groups but different formula weights (FW’s) (Table 4). For the isomer pairs, the RRF’s using APCI vary from 0.8 to 2.9, while the me- thylquinoline pair RRF’s utilizing EI ionization were unity. Greater variability was observed for the pairings containing similar functional groups but different FW’s. These values varied from 0.9 to 4.9 when using APCI and from 0.9 to 1.4 for EI ionization. Copyright © 2013 SciRes. JASMI  Quantitation of Genetox Impurities Using a Surrogate Standard Approach Copyright © 2013 SciRes. JASMI 170 Table 3. Comparison of surrogate standard and analyte RRF values of structural isomers utilizing APCI (positive and nega- tive) and EI modes. Surrogate Analyte RRF Mode dimethyl-p-toluidine dimethyl-m-toluidine 1.0 APCI/positive 2-chloro-3-pyridine carboxaldehyde 3-chloro-4-pyridine carboxaldehyde 1.5 APCI/positive 2-amino-6-methylbenzoic acid 2-amino-3-methylbenzoic acid 2.2 APCI/positive 4-chloromethyl benzoic acid 3-chloromethyl benzoic acid 0.8 APCI/negative 6-nitroquinoline 8-nitroquinoline 2.9 APCI/positive 6-chloronicotinoyl 2-chloronicotinoyl 1.6 APCI/positive 6-methylquinoline 8-methylquinoline 1.0 EI Table 4. Comparison of surrogate standard and analyte RRF values of compounds containing similar functional groups util- izing APCI (positive and negative) and EI modes. Surrogate Analyte RRF Mode 3-methoxy-2-nitropyridine 3-ethoxy-2-nitropyridine 2.2 APCI/positive 8-methylquinoline 8-quinolin-N-oxide 0.9 APCI/positive 2-hydrazinopyridine 2-chloro-6-hydrazinopyridine 1.3 APCI/positive 2-(chloromethyl)pyridine hydrochloride 2-chloromethyl quinoline 1.3 APCI/positive 4-chloromethyl benzoic acid 4-nitrobenzoic acid 0.9 APCI/negative 3-hydroxy-2-nitropyridine 3-hydroxy-6-methyl-2-nitropyridine 4.9 APCI/positive N-ethylcarbazol carbazol-9-ethanol 3.3 APCI/positive benzyl chloride 2-methyl benzyl chloride 1.0 EI benzyl chloride 3-methyl benzyl chloide 1.0 EI 2-chloropyrimidine 2-bromopyrimidine 1.3 EI benzyl bromide alpha-bromo-p-xylene 1.0 EI 2-ethylthiophene 5-ethyl-2-thiophenecarboxaldehyde 0.9 EI N,N-dimethylaniline dimethyl p-toluidine 1.2 EI and APCI/positive benzyl bromide 3-methylbenzyl bromide 1.1 EI benzyl bromide 3,5-dimethylbenzyl bromide 1.4 EI 3.2. Method Specificity and Utility In addition to comparisons of RRF’s of pure compounds in solutions, the comparison of compounds in the pres- ence of API’s was undertaken. This was utilized to estab- lish if the overwhelming excess of API in the sample matrix vs the PGI/surrogate standard would lead to quan- titative errors. In order to investigate this, quantities of PGI’s were spiked into API’s known to contain none of the PGI’s of interest, and the amounts obtained utilizing the surrogate standard method were compared with the actual amounts added. From the data shown (Table 5), it was determined that satisfactory quantitation can be ob- tained utilizing the surrogate standard method. To further evaluate the API matrix effect, an API which contained a known amount of a PGI (non spiked) was analyzed to establish if the surrogate approach would yield a value close to that actually determined using the authentic standard. The API of interest con- tained 78 ppm of the 3-methyl substituted indole (Figure 2) with indole-6-carboxylic acid employed as the surro- gate standard for quantitation. The calculated value of the 3-methyl substituted indole in the API utilizing the RRF method described was found to be 75 ppm. Therefore, proof of concept for this methodology in an actual API as been demonstrated. h 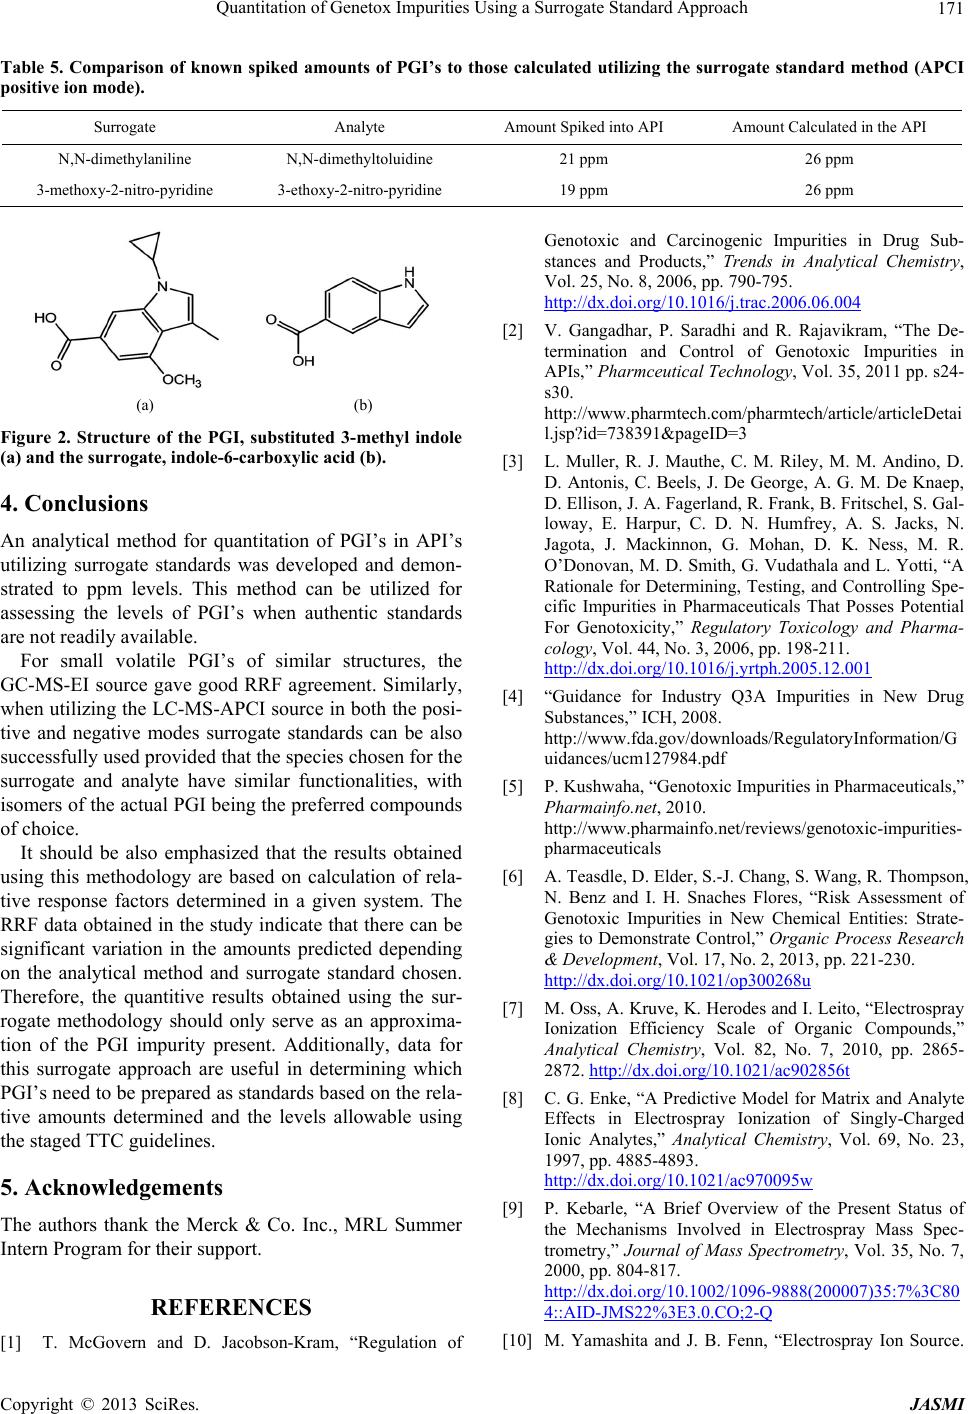 Quantitation of Genetox Impurities Using a Surrogate Standard Approach 171 Table 5. Comparison of known spiked amounts of PGI’s to those calculated utilizing the surrogate standard method (APCI positive ion mode). Surrogate Analyte Amount Spiked into API Amount Calculated in the API N,N-dimethylaniline N,N-dimethyltoluidine 21 ppm 26 ppm 3-methoxy-2-nitro-pyridine 3-ethoxy-2-nitro-pyridine 19 ppm 26 ppm (a) (b) Figure 2. Structure of the PGI, substituted 3-methyl indole (a) and the surrogate, indole-6-carboxylic acid (b). 4. Conclusions An analytical method for quantitation of PGI’s in API’s utilizing surrogate standards was developed and demon- strated to ppm levels. This method can be utilized for assessing the levels of PGI’s when authentic standards are not readily available. For small volatile PGI’s of similar structures, the GC-MS-EI source gave good RRF agreement. Similarly, when utilizing the LC-MS-APCI source in both the posi- tive and negative modes surrogate standards can be also successfully used provided that the species chosen for the surrogate and analyte have similar functionalities, with isomers of the actual PGI being the preferred compounds of choice. It should be also emphasized that the results obtained using this methodology are based on calculation of rela- tive response factors determined in a given system. The RRF data obtained in the study indicate that there can be significant variation in the amounts predicted depending on the analytical method and surrogate standard chosen. Therefore, the quantitive results obtained using the sur- rogate methodology should only serve as an approxima- tion of the PGI impurity present. Additionally, data for this surrogate approach are useful in determining which PGI’s need to be prepared as standards based on the rela- tive amounts determined and the levels allowable using the staged TTC guidelines. 5. Acknowledgements The authors thank the Merck & Co. Inc., MRL Summer Intern Program for their support. REFERENCES [1] T. McGovern and D. Jacobson-Kram, “Regulation of Genotoxic and Carcinogenic Impurities in Drug Sub- stances and Products,” Trends in Analytical Chemistry, Vol. 25, No. 8, 2006, pp. 790-795. http://dx.doi.org/10.1016/j.trac.2006.06.004 [2] V. Gangadhar, P. Saradhi and R. Rajavikram, “The De- termination and Control of Genotoxic Impurities in APIs,” Pharmceutical Technology, Vol. 35, 2011 pp. s24- s30. http://www.pharmtech.com/pharmtech/article/articleDetai l.jsp?id=738391&pageID=3 [3] L. Muller, R. J. Mauthe, C. M. Riley, M. M. Andino, D. D. Antonis, C. Beels, J. De George, A. G. M. De Knaep, D. Ellison, J. A. Fagerland, R. Frank, B. Fritschel, S. Gal- loway, E. Harpur, C. D. N. Humfrey, A. S. Jacks, N. Jagota, J. Mackinnon, G. Mohan, D. K. Ness, M. R. O’Donovan, M. D. Smith, G. Vudathala and L. Yotti, “A Rationale for Determining, Testing, and Controlling Spe- cific Impurities in Pharmaceuticals That Posses Potential For Genotoxicity,” Regulatory Toxicology and Pharma- cology, Vol. 44, No. 3, 2006, pp. 198-211. http://dx.doi.org/10.1016/j.yrtph.2005.12.001 [4] “Guidance for Industry Q3A Impurities in New Drug Substances,” ICH, 2008. http://www.fda.gov/downloads/RegulatoryInformation/G uidances/ucm127984.pdf [5] P. Kushwaha, “Genotoxic Impurities in Pharmaceuticals,” Pharmainfo.net, 2010. http://www.pharmainfo.net/reviews/genotoxic-impurities- pharmaceuticals [6] A. Teasdle, D. Elder, S.-J. Chang, S. Wang, R. Thompson, N. Benz and I. H. Snaches Flores, “Risk Assessment of Genotoxic Impurities in New Chemical Entities: Strate- gies to Demonstrate Control,” Organic Process Research & Development, Vol. 17, No. 2, 2013, pp. 221-230. http://dx.doi.org/10.1021/op300268u [7] M. Oss, A. Kruve, K. Herodes and I. Leito, “Electrospray Ionization Efficiency Scale of Organic Compounds,” Analytical Chemistry, Vol. 82, No. 7, 2010, pp. 2865- 2872. http://dx.doi.org/10.1021/ac902856t [8] C. G. Enke, “A Predictive Model for Matrix and Analyte Effects in Electrospray Ionization of Singly-Charged Ionic Analytes,” Analytical Chemistry, Vol. 69, No. 23, 1997, pp. 4885-4893. http://dx.doi.org/10.1021/ac970095w [9] P. Kebarle, “A Brief Overview of the Present Status of the Mechanisms Involved in Electrospray Mass Spec- trometry,” Journal of Mass Spectrometry, Vol. 35, No. 7, 2000, pp. 804-817. http://dx.doi.org/10.1002/1096-9888(200007)35:7%3C80 4::AID-JMS22%3E3.0.CO;2-Q [10] M. Yamashita and J. B. Fenn, “Electrospray Ion Source. Copyright © 2013 SciRes. JASMI  Quantitation of Genetox Impurities Using a Surrogate Standard Approach 172 Another Variation on the Free-Jet Theme,” Journal of Physical Chemistry, Vol. 88, No. 20, 1984, pp. 4451- 4459. http://dx.doi.org/10.1021/j150664a002 [11] D. I. Carroll, I. Dzidic, R. N. Stillwell, K. D. Haegele and E. C. Horning, “Atmospheric Pressure Ionization Mass Spectrometry: Corona Discharge Ion Source for Use in Liquid Chromatograph-Mass Spectrometer-Computer Analytical System,” Analytical Chemistry, Vol. 47, No. 14, 1975, pp. 2369-2373. http://dx.doi.org/10.1021/ac60364a031 [12] J. F. Anacleto, L. Ramaley, F. M. Benoit, R. K. Boyd and M. A. Quilliam, “Comparison of Liquid Chromatogra- phy/Mass Spectrometry Interfaces for the Analysis of Polycyclic Aromatic Compounds,” Analytical Chemistry, Vol. 67, No. 22, 1995, pp. 4145-4154. http://dx.doi.org/10.1021/ac00118a018 Copyright © 2013 SciRes. JASMI |