

Paper Menu >>
Journal Menu >>
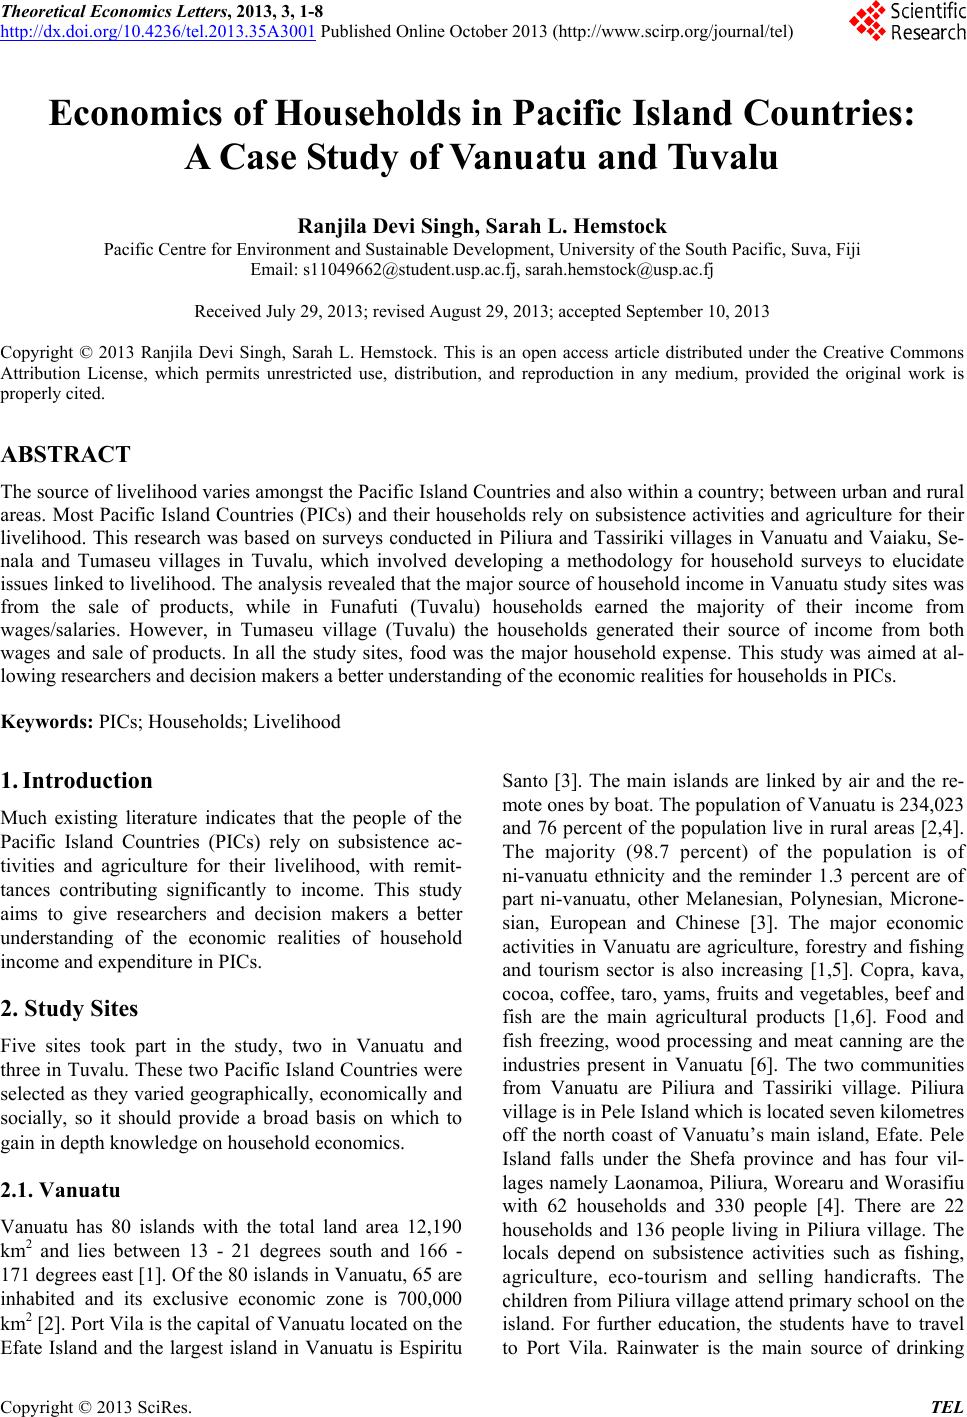 Theoretical Economics Letters, 2013, 3, 1-8 http://dx.doi.org/10.4236/tel.2013.35A3001 Published Online October 2013 (http://www.scirp.org/journal/tel) Economics of Households in Pacific Island Countries: A Case Study of Vanuatu and Tuvalu Ranjila Devi Singh, Sarah L. Hemstock Pacific Centre for Environment and Sustainable Development, University of the South Pacific, Suva, Fiji Email: [email protected], [email protected] Received July 29, 2013; revised August 29, 2013; accepted September 10, 2013 Copyright © 2013 Ranjila Devi Singh, Sarah L. Hemstock. This is an open access article distributed under the Creative Commons Attribution License, which permits unrestricted use, distribution, and reproduction in any medium, provided the original work is properly cited. ABSTRACT The source of livelihood varies amongst the Pacific Island Countries and also within a country; between urban and rural areas. Most Pacific Island Countries (PICs) and their households rely on subsistence activities and agriculture for their livelihood. This research was based on surveys conducted in Piliura and Tassiriki villages in Vanuatu and Vaiaku, Se- nala and Tumaseu villages in Tuvalu, which involved developing a methodology for household surveys to elucidate issues linked to liveliho od. The analysis revealed th at the major sour ce of household inco me in Vanuatu stud y sites was from the sale of products, while in Funafuti (Tuvalu) households earned the majority of their income from wages/salaries. However, in Tumaseu village (Tuvalu) the households generated their source of income from both wages and sale of products. In all the study sites, food was the major household expense. This study was aimed at al- lowing researcher s and decision makers a better understanding of th e economic realities for households in PICs. Keywords: PICs; Households; Livelihood 1. Introduction Much existing literature indicates that the people of the Pacific Island Countries (PICs) rely on subsistence ac- tivities and agriculture for their livelihood, with remit- tances contributing significantly to income. This study aims to give researchers and decision makers a better understanding of the economic realities of household income and expenditure in PICs. 2. Study Sites Five sites took part in the study, two in Vanuatu and three in Tuvalu. These two Pacific Island Countries were selected as they varied geographically, economically and socially, so it should provide a broad basis on which to gain in depth knowledge on household economics. 2.1. Vanuatu Vanuatu has 80 islands with the total land area 12,190 km2 and lies between 13 - 21 degrees south and 166 - 171 degrees east [1]. Of the 80 islands in Vanuatu, 65 are inhabited and its exclusive economic zone is 700,000 km2 [2]. Port Vila is the capital of Vanuatu located on the Efate Island and the largest island in Vanuatu is Espiritu Santo [3]. The main islands are linked by air and the re- mote ones by boat. The pop ulation of Vanu atu is 234,023 and 76 percen t of the population live in rural areas [2,4]. The majority (98.7 percent) of the population is of ni-vanuatu ethnicity and the reminder 1.3 percent are of part ni-vanuatu, other Melanesian, Polynesian, Microne- sian, European and Chinese [3]. The major economic activities in Vanuatu are agriculture, forestry and fishing and tourism sector is also increasing [1,5]. Copra, kava, cocoa, coffee, taro, yams, fruits and vegetables, beef and fish are the main agricultural products [1,6]. Food and fish freezing, wood processing and meat canning are the industries present in Vanuatu [6]. The two communities from Vanuatu are Piliura and Tassiriki village. Piliura village is in Pele Island which is located seven kilometres off the north coast of Vanuatu’s main island, Efate. Pele Island falls under the Shefa province and has four vil- lages namely Laonamoa, Piliura, Worearu and Worasifiu with 62 households and 330 people [4]. There are 22 households and 136 people living in Piliura village. The locals depend on subsistence activities such as fishing, agriculture, eco-tourism and selling handicrafts. The children from Piliura v illage attend primary school on the island. For further education, the students have to travel to Port Vila. Rainwater is the main source of drinking C opyright © 2013 SciRes. TEL 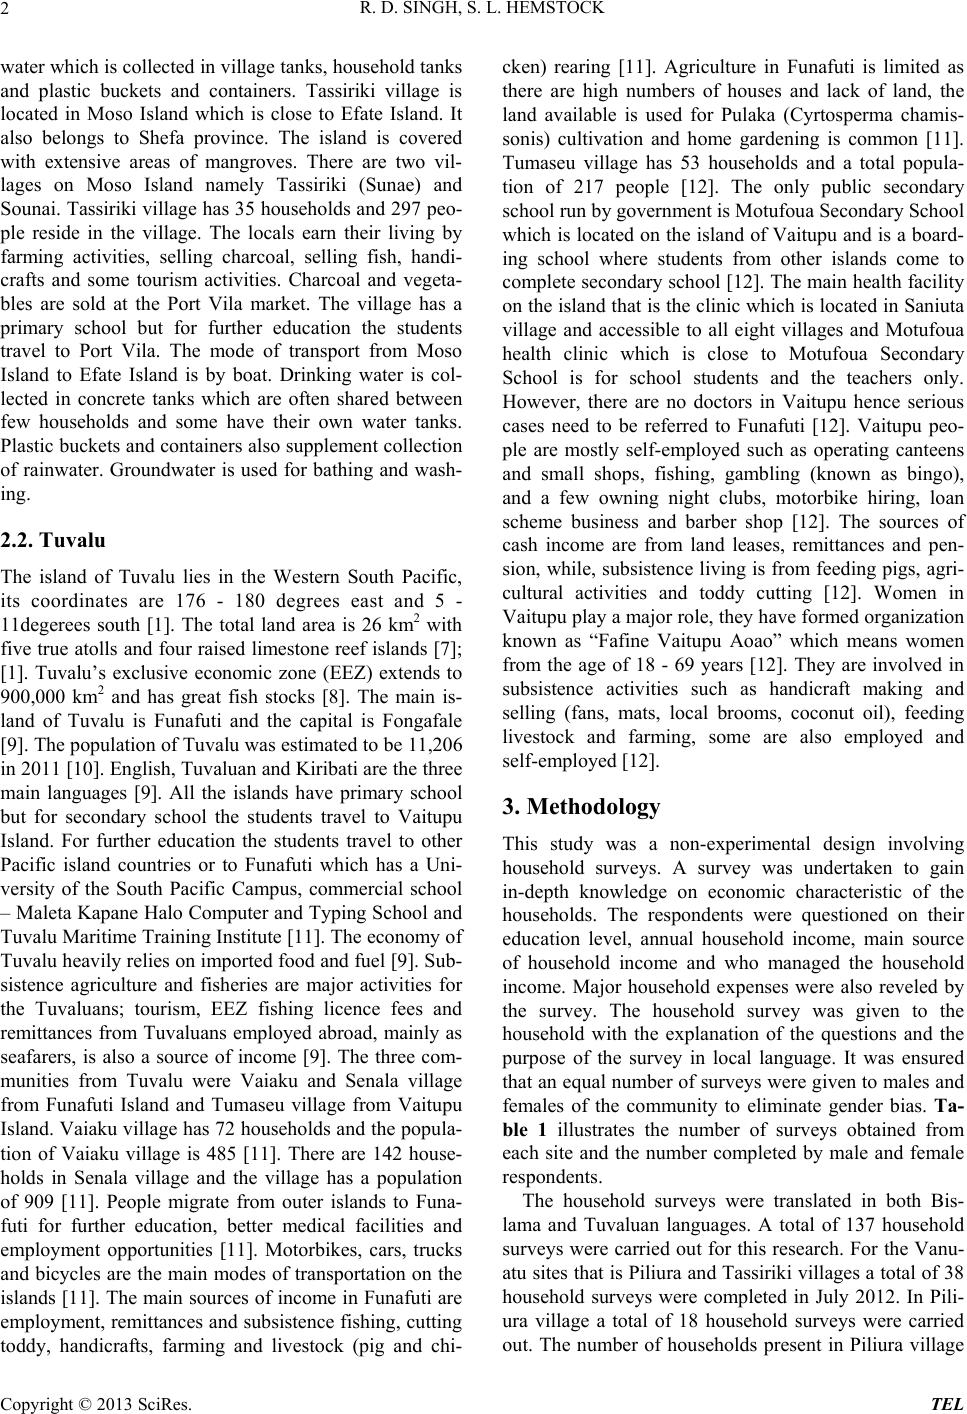 R. D. SINGH, S. L. HEMSTOCK 2 water which is collected in village tanks, household tanks and plastic buckets and containers. Tassiriki village is located in Moso Island which is close to Efate Island. It also belongs to Shefa province. The island is covered with extensive areas of mangroves. There are two vil- lages on Moso Island namely Tassiriki (Sunae) and Sounai. Tassiriki village has 35 househo lds and 297 peo- ple reside in the village. The locals earn their living by farming activities, selling charcoal, selling fish, handi- crafts and some tourism activities. Charcoal and vegeta- bles are sold at the Port Vila market. The village has a primary school but for further education the students travel to Port Vila. The mode of transport from Moso Island to Efate Island is by boat. Drinking water is col- lected in concrete tanks which are often shared between few households and some have their own water tanks. Plastic buckets and containers also supplement collection of rainwater. Groundwater is used for bathing and wash- ing. 2.2. Tuvalu The island of Tuvalu lies in the Western South Pacific, its coordinates are 176 - 180 degrees east and 5 - 11degerees south [1]. The total land area is 26 km2 with five true atolls and four raised limestone reef islands [7]; [1]. Tuvalu’s exclusive economic zone (EEZ) extends to 900,000 km2 and has great fish stocks [8]. The main is- land of Tuvalu is Funafuti and the capital is Fongafale [9]. The population of Tuvalu was estimated to be 11,206 in 2011 [10]. English, Tuvaluan and Kiribati are the three main languages [9]. All the islands have primary school but for secondary school the students travel to Vaitupu Island. For further education the students travel to other Pacific island countries or to Funafuti which has a Uni- versity of the South Pacific Campus, commercial school – Maleta Kapane Halo Computer and Typing School and Tuvalu Maritime Training Institute [11 ]. The economy of Tuvalu heavily relies on imported food and fuel [9]. Sub- sistence agriculture and fisheries are major activities for the Tuvaluans; tourism, EEZ fishing licence fees and remittances from Tuvaluans employed abroad, mainly as seafarers, is also a source of income [9]. The three com- munities from Tuvalu were Vaiaku and Senala village from Funafuti Island and Tumaseu village from Vaitupu Island. Vaiaku village has 72 households and th e popula- tion of Vaiaku village is 485 [11]. There are 142 house- holds in Senala village and the village has a population of 909 [11]. People migrate from outer islands to Funa- futi for further education, better medical facilities and employment opportunities [11]. Motorbikes, cars, trucks and bicycles are the main modes of transportation on the islands [11]. The main sources of in come in Funafuti are employment, remittances and subs istence fishing, cutting toddy, handicrafts, farming and livestock (pig and chi- cken) rearing [11]. Agriculture in Funafuti is limited as there are high numbers of houses and lack of land, the land available is used for Pulaka (Cyrtosperma chamis- sonis) cultivation and home gardening is common [11]. Tumaseu village has 53 households and a total popula- tion of 217 people [12]. The only public secondary school run by government is Motufoua Secondary School which is located on the island of Vaitupu and is a board- ing school where students from other islands come to complete secondary school [12]. The main health facility on the island that is the clin ic which is located in Saniu ta village and accessible to all eight villages and Motufoua health clinic which is close to Motufoua Secondary School is for school students and the teachers only. However, there are no doctors in Vaitupu hence serious cases need to be referred to Funafuti [12]. Vaitupu peo- ple are mostly self-employed such as operating canteens and small shops, fishing, gambling (known as bingo), and a few owning night clubs, motorbike hiring, loan scheme business and barber shop [12]. The sources of cash income are from land leases, remittances and pen- sion, while, subsistence living is from feeding pigs, agri- cultural activities and toddy cutting [12]. Women in Vaitupu play a major role, they have formed organization known as “Fafine Vaitupu Aoao” which means women from the age of 18 - 69 years [12]. They are involved in subsistence activities such as handicraft making and selling (fans, mats, local brooms, coconut oil), feeding livestock and farming, some are also employed and self-employed [12] . 3. Methodology This study was a non-experimental design involving household surveys. A survey was undertaken to gain in-depth knowledge on economic characteristic of the households. The respondents were questioned on their education level, annual household income, main source of household income and who managed the household income. Major household expenses were also reveled by the survey. The household survey was given to the household with the explanation of the questions and the purpose of the survey in local language. It was ensured that an equal number of surveys were given to males and females of the community to eliminate gender bias. Ta- ble 1 illustrates the number of surveys obtained from each site and the number completed by male and female respondents. The household surveys were translated in both Bis- lama and Tuvaluan languages. A total of 137 household surveys were carried out for this research. For the Vanu- atu sites that is Piliura and Tassirik i villages a total of 38 household surveys were completed in July 2012. In Pili- ura village a total of 18 household surveys were carried out. The number of households present in Piliura village Copyright © 2013 SciRes. TEL 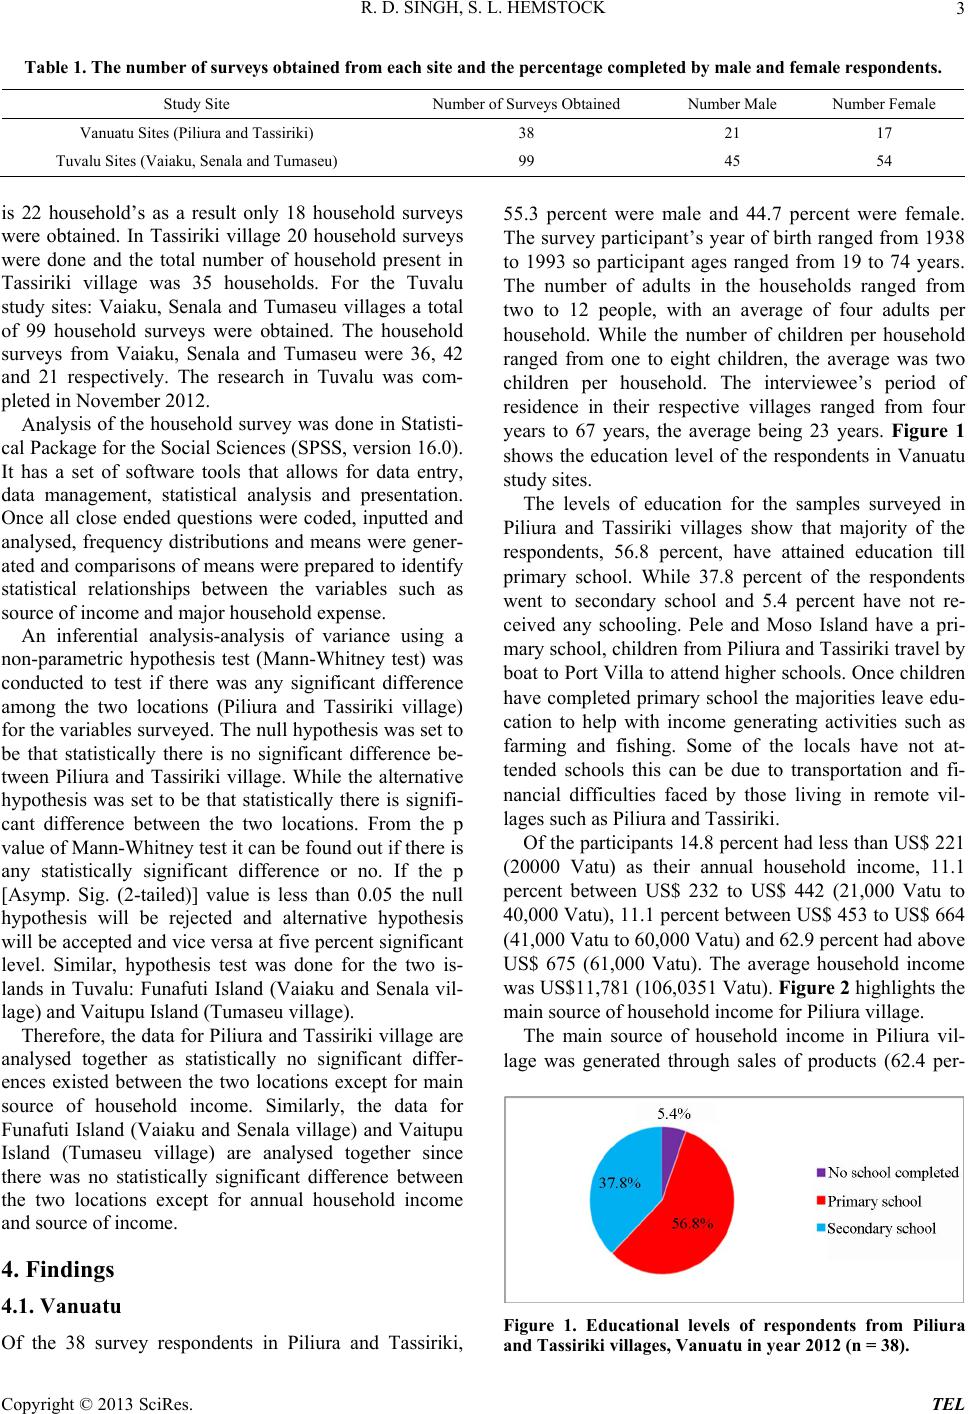 R. D. SINGH, S. L. HEMSTOCK Copyright © 2013 SciRes. TEL 3 Table 1. The number of surveys obtained from each site and the percentage completed by male and female respondents. Study Site Number of Surveys Obtained Number Male Number Female Vanuatu Sites (Piliura and Tassiriki) 38 21 17 Tuvalu Sites (Vaia k u , Senala and Tumaseu) 99 45 54 is 22 household’s as a result only 18 household surveys were obtained. In Tassiriki village 20 household surveys were done and the total number of household present in Tassiriki village was 35 households. For the Tuvalu study sites: Vaiaku, Senala and Tumaseu villages a total of 99 household surveys were obtained. The household surveys from Vaiaku, Senala and Tumaseu were 36, 42 and 21 respectively. The research in Tuvalu was com- pleted in November 2012. 55.3 percent were male and 44.7 percent were female. The survey participant’s year of birth ranged from 1938 to 1993 so participant ages ranged from 19 to 74 years. The number of adults in the households ranged from two to 12 people, with an average of four adults per household. While the number of children per household ranged from one to eight children, the average was two children per household. The interviewee’s period of residence in their respective villages ranged from four years to 67 years, the average being 23 years. Figure 1 shows the education level of the respondents in Vanuatu study sites. Analysis of the household survey was done in Statisti- cal Package for the Social Sciences (SPSS, version 16.0). It has a set of software tools that allows for data entry, data management, statistical analysis and presentation. Once all close ended questions were coded, inputted and analysed, frequency distributions and means were gener- ated and comparisons of means were prepared to identify statistical relationships between the variables such as source of income and major household expense. The levels of education for the samples surveyed in Piliura and Tassiriki villages show that majority of the respondents, 56.8 percent, have attained education till primary school. While 37.8 percent of the respondents went to secondary school and 5.4 percent have not re- ceived any schooling. Pele and Moso Island have a pri- mary school, children from Piliura and Tassiriki travel by boat to Port Villa to attend higher schools. Once children have completed primary school the majorities leave edu- cation to help with income generating activities such as farming and fishing. Some of the locals have not at- tended schools this can be due to transportation and fi- nancial difficulties faced by those living in remote vil- lages such as Piliura and Tassiriki. An inferential analysis-analysis of variance using a non-parametric hypothesis test (Mann-Whitney test) was conducted to test if there was any significant difference among the two locations (Piliura and Tassiriki village) for the variables surveyed. The null hypo thesis was set to be that statistically there is no significant difference be- tween Piliura and Tassiriki village. While the alternative hypothesis was set to be that statistically there is signifi- cant difference between the two locations. From the p value of Mann-Whitney test it can be fou nd ou t if th ere is any statistically significant difference or no. If the p [Asymp. Sig. (2-tailed)] value is less than 0.05 the null hypothesis will be rejected and alternative hypothesis will be accepted and vice versa at five percent significant level. Similar, hypothesis test was done for the two is- lands in Tuvalu: Funafuti Island (Vaiaku and Senala vil- lage) and Vaitupu Island (Tumaseu village). Of the participants 14.8 percent had less than US$ 221 (20000 Vatu) as their annual household income, 11.1 percent between US$ 232 to US$ 442 (21,000 Vatu to 40,000 Vatu), 11.1 p ercent between US$ 453 to US$ 664 (41,000 Vatu to 60,000 Vatu) and 62 .9 percent had above US$ 675 (61,000 Vatu). The average household income was US$11,781 (106,0351 Vatu). Figure 2 highlights the main source of household income for Piliura village. Therefore, the data for Piliura an d Tassiriki village are analysed together as statistically no significant differ- ences existed between the two locations except for main source of household income. Similarly, the data for Funafuti Island (Vaiaku and Senala village) and Vaitupu Island (Tumaseu village) are analysed together since there was no statistically significant difference between the two locations except for annual household income and source of income. The main source of household income in Piliura vil- lage was generated through sales of products (62.4 per- 4. Findings 4.1. Vanuatu Figure 1. Educational levels of respondents from Piliura and Tassiriki villages, Vanuatu in year 2012 (n = 38). Of the 38 survey respondents in Piliura and Tassiriki, 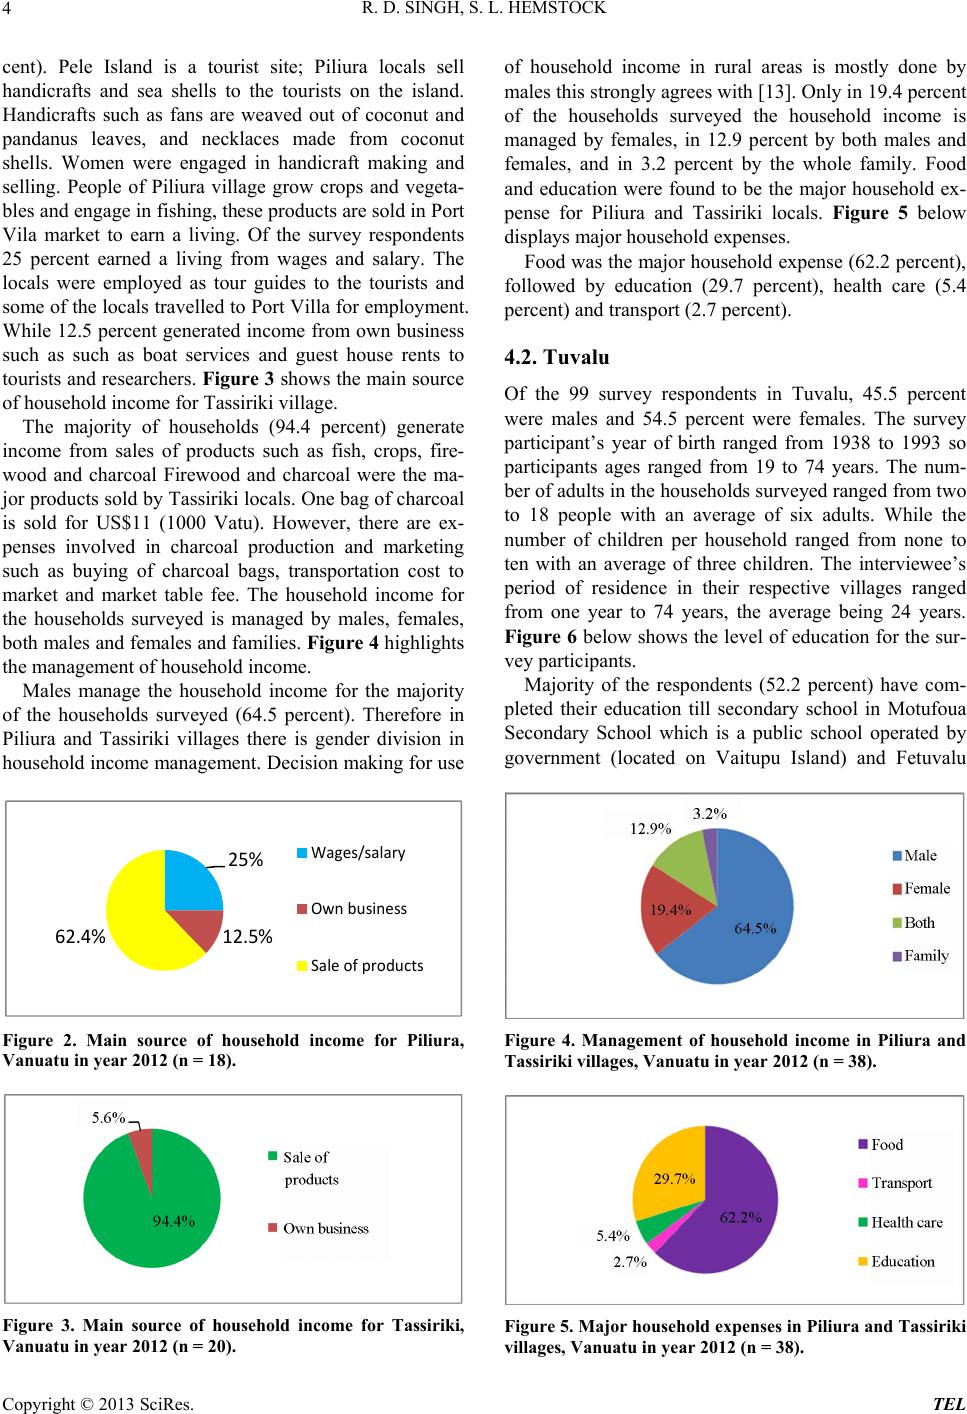 R. D. SINGH, S. L. HEMSTOCK 4 cent). Pele Island is a tourist site; Piliura locals sell handicrafts and sea shells to the tourists on the island. Handicrafts such as fans are weaved out of coconut and pandanus leaves, and necklaces made from coconut shells. Women were engaged in handicraft making and selling. People of Piliura village grow crops and vegeta- bles and engage in fishing, these products are sold in Port Vila market to earn a living. Of the survey respondents 25 percent earned a living from wages and salary. The locals were employed as tour guides to the tourists and some of the locals travelled to Port Villa for employment. While 12.5 percent generated income from own business such as such as boat services and guest house rents to tourists and researchers. Figure 3 shows the main source of household income for Tassiriki village. The majority of households (94.4 percent) generate income from sales of products such as fish, crops, fire- wood and charcoal Firewood and charcoal were the ma- jor products sold by Tassiriki locals. One bag of charcoal is sold for US$11 (1000 Vatu). However, there are ex- penses involved in charcoal production and marketing such as buying of charcoal bags, transportation cost to market and market table fee. The household income for the households surveyed is managed by males, females, bo th ma le s an d f ema les an d fa mi lie s. Figure 4 highlights the management of household income. Males manage the household income for the majority of the households surveyed (64.5 percent). Therefore in Piliura and Tassiriki villages there is gender division in household income management. Decision making for use 25% 12.5%62.4% Wag es/salary Ownbusiness Saleofproducts Figure 2. Main source of household income for Piliura, Vanuatu in year 2012 (n = 18). Figure 3. Main source of household income for Tassiriki, Vanuatu in year 2012 (n = 20). of household income in rural areas is mostly done by males this strongly agrees with [13]. Only in 19.4 percent of the households surveyed the household income is managed by females, in 12.9 percent by both males and females, and in 3.2 percent by the whole family. Food and education were found to be the major household ex- pense for Piliura and Tassiriki locals. Figure 5 below displays major household expenses. Food was the major household expense (62.2 percent), followed by education (29.7 percent), health care (5.4 percent) and transp ort (2.7 percent). 4.2. Tuvalu Of the 99 survey respondents in Tuvalu, 45.5 percent were males and 54.5 percent were females. The survey participant’s year of birth ranged from 1938 to 1993 so participants ages ranged from 19 to 74 years. The num- ber of adults in the households surveyed ranged from two to 18 people with an average of six adults. While the number of children per household ranged from none to ten with an average of three children. The interviewee’s period of residence in their respective villages ranged from one year to 74 years, the average being 24 years. Figure 6 below shows the level of education for the sur- vey participants. Majority of the respondents (52.2 percent) have com- pleted their education till secondary school in Motufoua Secondary School which is a public school operated by government (located on Vaitupu Island) and Fetuvalu Figure 4. Management of household income in Piliura and Tassiriki villages, Vanuatu in year 2012 (n = 38). Figure 5. Major household expenses in Piliura and Tassiriki villages, Vanuatu in year 2012 (n = 38). Copyright © 2013 SciRes. TEL 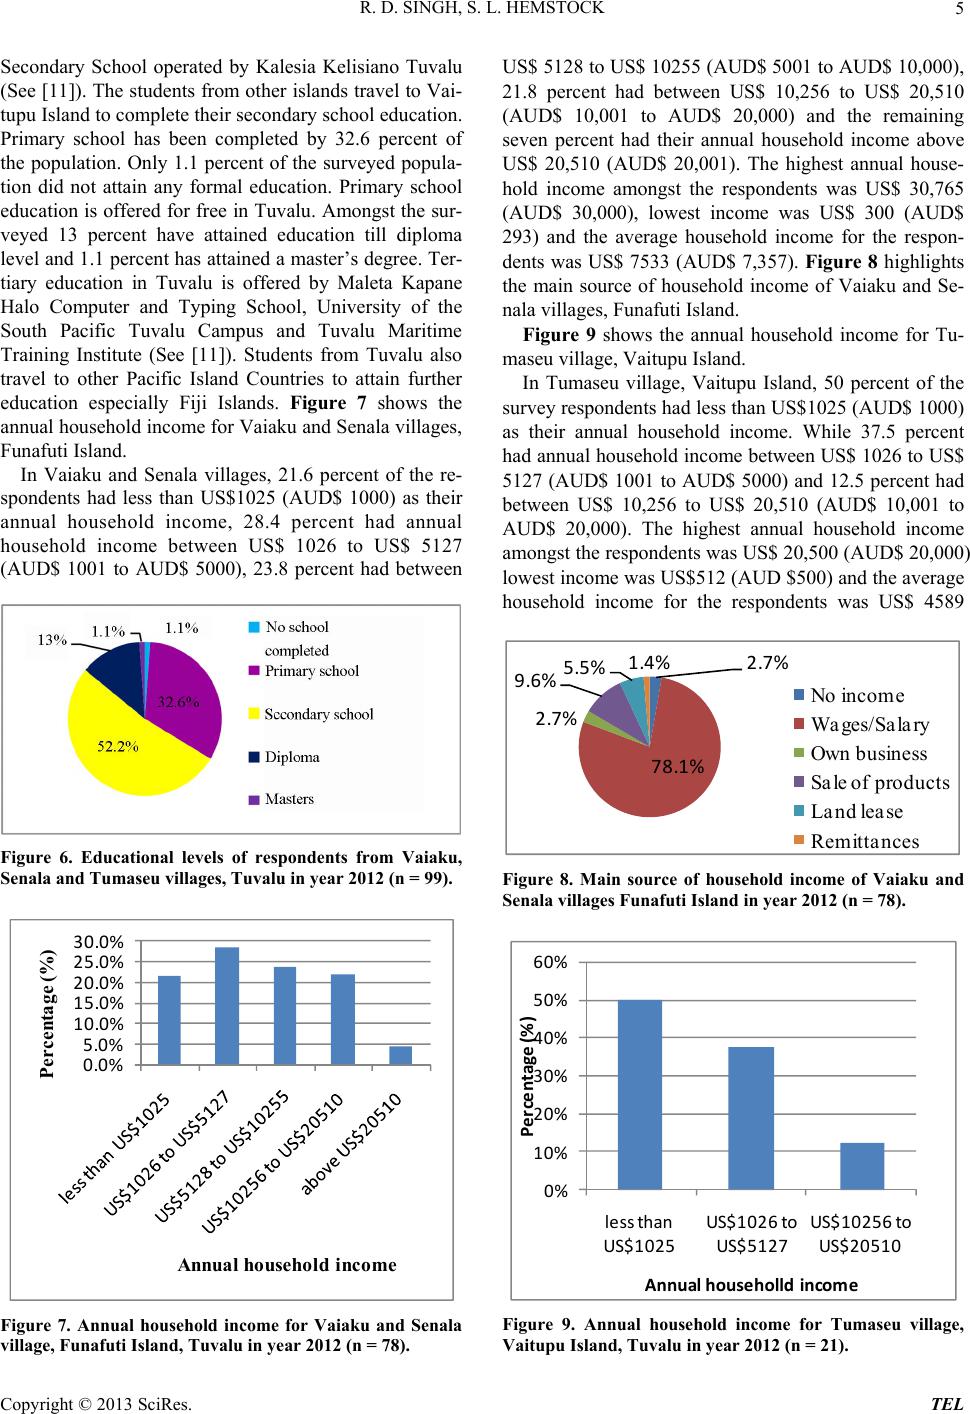 R. D. SINGH, S. L. HEMSTOCK 5 Secondary School operated by Kalesia Kelisiano Tuvalu (See [11]). The students from other islands travel to Vai- tupu Island to complete their second ary schoo l educatio n. Primary school has been completed by 32.6 percent of the population. Only 1.1 percent of the surveyed popula- tion did not attain any formal education. Primary school education is offered for free in Tuvalu. Amongst the sur- veyed 13 percent have attained education till diploma level and 1.1 percent has attained a master’s degree. Ter- tiary education in Tuvalu is offered by Maleta Kapane Halo Computer and Typing School, University of the South Pacific Tuvalu Campus and Tuvalu Maritime Training Institute (See [11]). Students from Tuvalu also travel to other Pacific Island Countries to attain further education especially Fiji Islands. Figure 7 shows the annual household income for Vaiaku and Senala v illages, Funafuti Island. In Vaiaku and Senala villages, 21.6 percent of the re- spondents had less than US$1025 (AUD$ 1000) as their annual household income, 28.4 percent had annual household income between US$ 1026 to US$ 5127 (AUD$ 1001 to AUD$ 5000), 23.8 percent had between Figure 6. Educational levels of respondents from Vaiaku, Senala and Tumaseu villages, Tuvalu in year 2012 (n = 99). 0.0% 5.0% 10.0% 15.0% 20.0% 25.0% 30.0% Percentage (%) Annual h ousehold in come Figure 7. Annual household income for Vaiaku and Senala village, Funafuti Island, Tuvalu in year 2012 (n = 78). US$ 5128 to US$ 10255 (AUD$ 5001 to AUD$ 10,000), 21.8 percent had between US$ 10,256 to US$ 20,510 (AUD$ 10,001 to AUD$ 20,000) and the remaining seven percent had their annual household income above US$ 20,510 (AUD$ 20,001). The highest annual house- hold income amongst the respondents was US$ 30,765 (AUD$ 30,000), lowest income was US$ 300 (AUD$ 293) and the average household income for the respon- dents was US$ 7533 (AUD$ 7,357). Figure 8 highlights the main source of household income of Vaiaku and Se- nala villages, Funafuti Island. Figure 9 shows the annual household income for Tu- maseu village, Vaitupu Island. In Tumaseu village, Vaitupu Island, 50 percent of the survey responden ts had less than U S$1025 (AUD$ 1 000) as their annual household income. While 37.5 percent had annual household income between US$ 1026 to US$ 5127 (AUD$ 1001 to AUD$ 5000) and 12.5 percent had between US$ 10,256 to US$ 20,510 (AUD$ 10,001 to AUD$ 20,000). The highest annual household income amongst the resp ondents was US$ 2 0,500 (AU D$ 20,0 00) lowest income was US$512 (AUD $500) and th e av era ge household income for the respondents was US$ 4589 2.7% 78.1% 2.7% 9.6% 5.5% 1.4% No i ncome Wages/Salary Own business Sal e of products Land lease Remitt an ces Figure 8. Main source of household income of Vaiaku and Senala villages Funafuti Island in year 2012 (n = 78). 0% 10% 20% 30% 40% 50% 60% lessthan US$1025 US$1026to US$5127 US$10256to US$20510 Pe rcentage(% ) Annualhou seholldincome Figure 9. Annual household income for Tumaseu village, Vaitupu Island, Tuvalu in year 2012 (n = 21). Copyright © 2013 SciRes. TEL 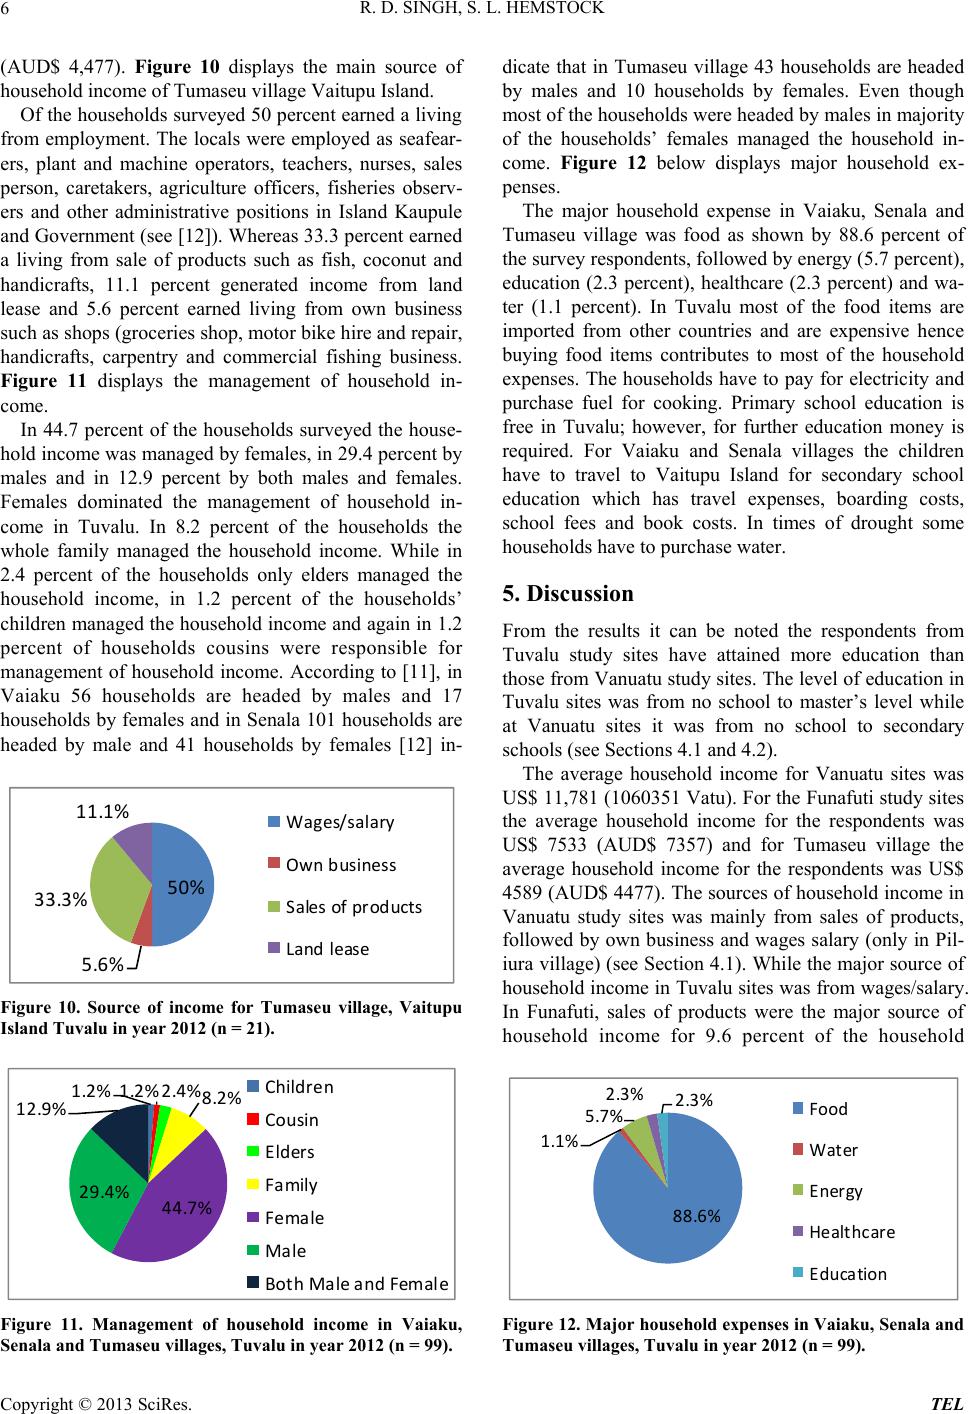 R. D. SINGH, S. L. HEMSTOCK 6 (AUD$ 4,477). Figure 10 displays the main source of household income of Tumaseu village Vaitupu Island. Of the households su rveyed 50 percent earned a living from employment. The locals were employed as seafear- ers, plant and machine operators, teachers, nurses, sales person, caretakers, agriculture officers, fisheries observ- ers and other administrative positions in Island Kaupule and Government (see [12]). Whereas 33.3 percent earned a living from sale of products such as fish, coconut and handicrafts, 11.1 percent generated income from land lease and 5.6 percent earned living from own business such as shops (groceries shop, motor bike hire and repair, handicrafts, carpentry and commercial fishing business. Figure 11 displays the management of household in- come. In 44.7 percent of the households surveyed the house- hold income was managed by females, in 29.4 percent by males and in 12.9 percent by both males and females. Females dominated the management of household in- come in Tuvalu. In 8.2 percent of the households the whole family managed the household income. While in 2.4 percent of the households only elders managed the household income, in 1.2 percent of the households’ children managed the household income and again in 1.2 percent of households cousins were responsible for management of household income. According to [11], in Vaiaku 56 households are headed by males and 17 households by females and in Senala 101 households are headed by male and 41 households by females [12] in- 50% 5.6% 33.3% 11.1% Wages/salary Ow nbusiness Salesofproducts Landlease Figure 10. Source of income for Tumaseu village, Vaitupu Island Tuvalu in year 2012 (n = 21). 1.2%1.2%2.4%8.2% 44.7% 29.4% 12.9% Child ren Cousin Elders Family Fema le Male BothMaleandFemale Figure 11. Management of household income in Vaiaku, Senala and Tumaseu villages, Tuvalu in year 2012 (n = 99). dicate that in Tumaseu village 43 households are headed by males and 10 households by females. Even though most of the households were headed by males in majority of the households’ females managed the household in- come. Figure 12 below displays major household ex- penses. The major household expense in Vaiaku, Senala and Tumaseu village was food as shown by 88.6 percent of the survey respondents, followed by energy (5.7 percent), education (2.3 percent), healthcare (2.3 percent) and wa- ter (1.1 percent). In Tuvalu most of the food items are imported from other countries and are expensive hence buying food items contributes to most of the household expenses. The households have to pay for electricity and purchase fuel for cooking. Primary school education is free in Tuvalu; however, for further education money is required. For Vaiaku and Senala villages the children have to travel to Vaitupu Island for secondary school education which has travel expenses, boarding costs, school fees and book costs. In times of drought some households have to purchase water. 5. Discussion From the results it can be noted the respondents from Tuvalu study sites have attained more education than those from Vanuatu study sites. The level of education in Tuvalu sites was from no school to master’s level while at Vanuatu sites it was from no school to secondary schools (see Sections 4.1 and 4. 2). The average household income for Vanuatu sites was US$ 11,781 (1060351 Vatu). For the Funafuti study sites the average household income for the respondents was US$ 7533 (AUD$ 7357) and for Tumaseu village the average household income for the respondents was US$ 4589 (AUD$ 4477) . The sources of household in come in Vanuatu study sites was mainly from sales of products, followed by own business and wages salary (only in Pil- iura village) (see Section 4.1). While the major source of household income in Tuvalu sites was from wages/salary. In Funafuti, sales of products were the major source of household income for 9.6 percent of the household 88.6% 1.1% 5.7% 2.3% 2.3%Food Water Energy Healthcare E duca tion Figure 12. Major household expense s in Vaiaku, Senala and umaseu villages, Tuvalu in year 2012 (n = 99). T Copyright © 2013 SciRes. TEL 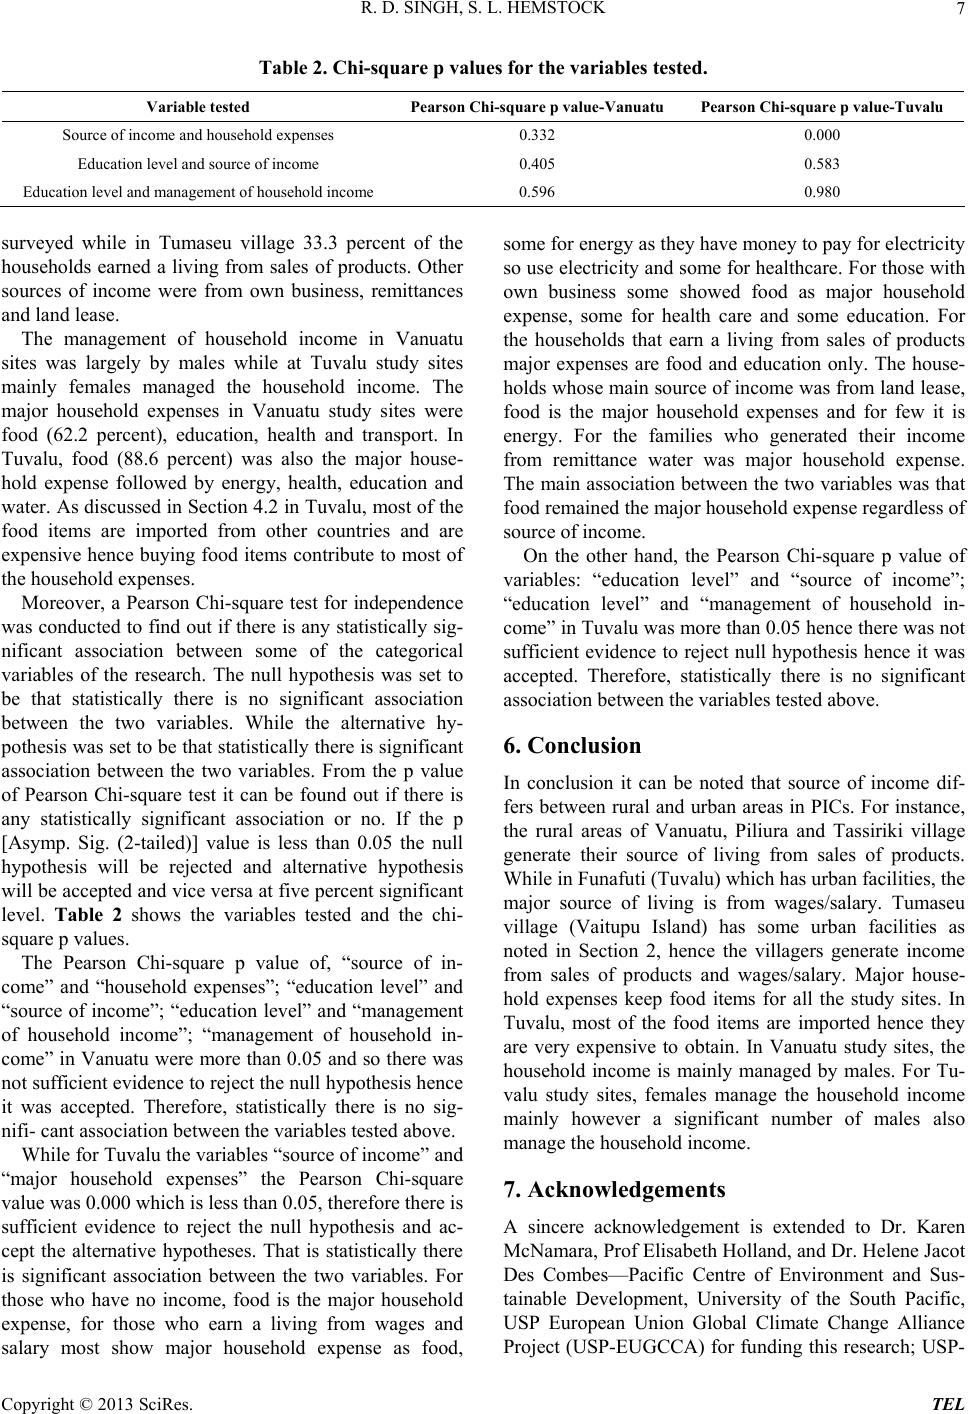 R. D. SINGH, S. L. HEMSTOCK Copyright © 2013 SciRes. TEL 7 Table 2. Chi-square p values for the variables tested. Variable tested Pearson Chi-square p value-VanuatuPearson Chi-square p value-Tuvalu Source of income and househ o l d e xpenses 0.332 0.000 Education level and source of income 0.405 0.583 Education level and management of household income 0.596 0.980 surveyed while in Tumaseu village 33.3 percent of the households earned a living from sales of products. Other sources of income were from own business, remittances and land lease. The management of household income in Vanuatu sites was largely by males while at Tuvalu study sites mainly females managed the household income. The major household expenses in Vanuatu study sites were food (62.2 percent), education, health and transport. In Tuvalu, food (88.6 percent) was also the major house- hold expense followed by energy, health, education and water. As discussed in Section 4.2 in Tuvalu, most of the food items are imported from other countries and are expensive hence buying food ite ms contribute to most of the household expenses. Moreover, a Pearson Chi-square test for independence was conducted to find out if there is any statistically sig- nificant association between some of the categorical variables of the research. The null hypothesis was set to be that statistically there is no significant association between the two variables. While the alternative hy- pothesis was set to be that statistically there is sign ificant association between the two variables. From the p value of Pearson Chi-square test it can be found out if there is any statistically significant association or no. If the p [Asymp. Sig. (2-tailed)] value is less than 0.05 the null hypothesis will be rejected and alternative hypothesis will be accepted and vice versa at five percent significant level. Table 2 shows the variables tested and the chi- square p values. The Pearson Chi-square p value of, “source of in- come” and “household expenses”; “education level” and “source of income”; “education level” and “management of household income”; “management of household in- come” in Vanuatu were more than 0.05 and so there was not sufficient evid ence to reject the nu ll hypo thesis hence it was accepted. Therefore, statistically there is no sig- nifi- cant association between the variables tested above. While for Tuvalu the variables “source of income” and “major household expenses” the Pearson Chi-square value was 0.000 which is less than 0.05, therefore there is sufficient evidence to reject the null hypothesis and ac- cept the alternative hypotheses. That is statistically there is significant association between the two variables. For those who have no income, food is the major household expense, for those who earn a living from wages and salary most show major household expense as food, some for energy as they have money to pay for electricity so use electricity and some for healthcare. For those with own business some showed food as major household expense, some for health care and some education. For the households that earn a living from sales of products major expenses are food and education only. The house- holds whose main source of income was from land lease, food is the major household expenses and for few it is energy. For the families who generated their income from remittance water was major household expense. The main association between the two variables was that food remained the major household expense regardless of source of income. On the other hand, the Pearson Chi-square p value of variables: “education level” and “source of income”; “education level” and “management of household in- come” in Tuvalu was more than 0.05 hence there was not sufficient evidence to reject null hypothesis hence it was accepted. Therefore, statistically there is no significant association between the variables tested above. 6. Conclusion In conclusion it can be noted that source of income dif- fers between rural and urban areas in PICs. For instance, the rural areas of Vanuatu, Piliura and Tassiriki village generate their source of living from sales of products. While in Funafuti (Tuvalu) which has urb a n facilities, the major source of living is from wages/salary. Tumaseu village (Vaitupu Island) has some urban facilities as noted in Section 2, hence the villagers generate income from sales of products and wages/salary. Major house- hold expenses keep food items for all the study sites. In Tuvalu, most of the food items are imported hence they are very expensive to obtain. In Vanuatu study sites, the household income is mainly managed by males. For Tu- valu study sites, females manage the household income mainly however a significant number of males also manage the household income. 7. Acknowledgements A sincere acknowledgement is extended to Dr. Karen McNamara, Prof Elisabeth Holland, and Dr. Helene Jacot Des Combes—Pacific Centre of Environment and Sus- tainable Development, University of the South Pacific, USP European Union Global Climate Change Alliance Project (USP-EUGCCA) for funding this research; USP- 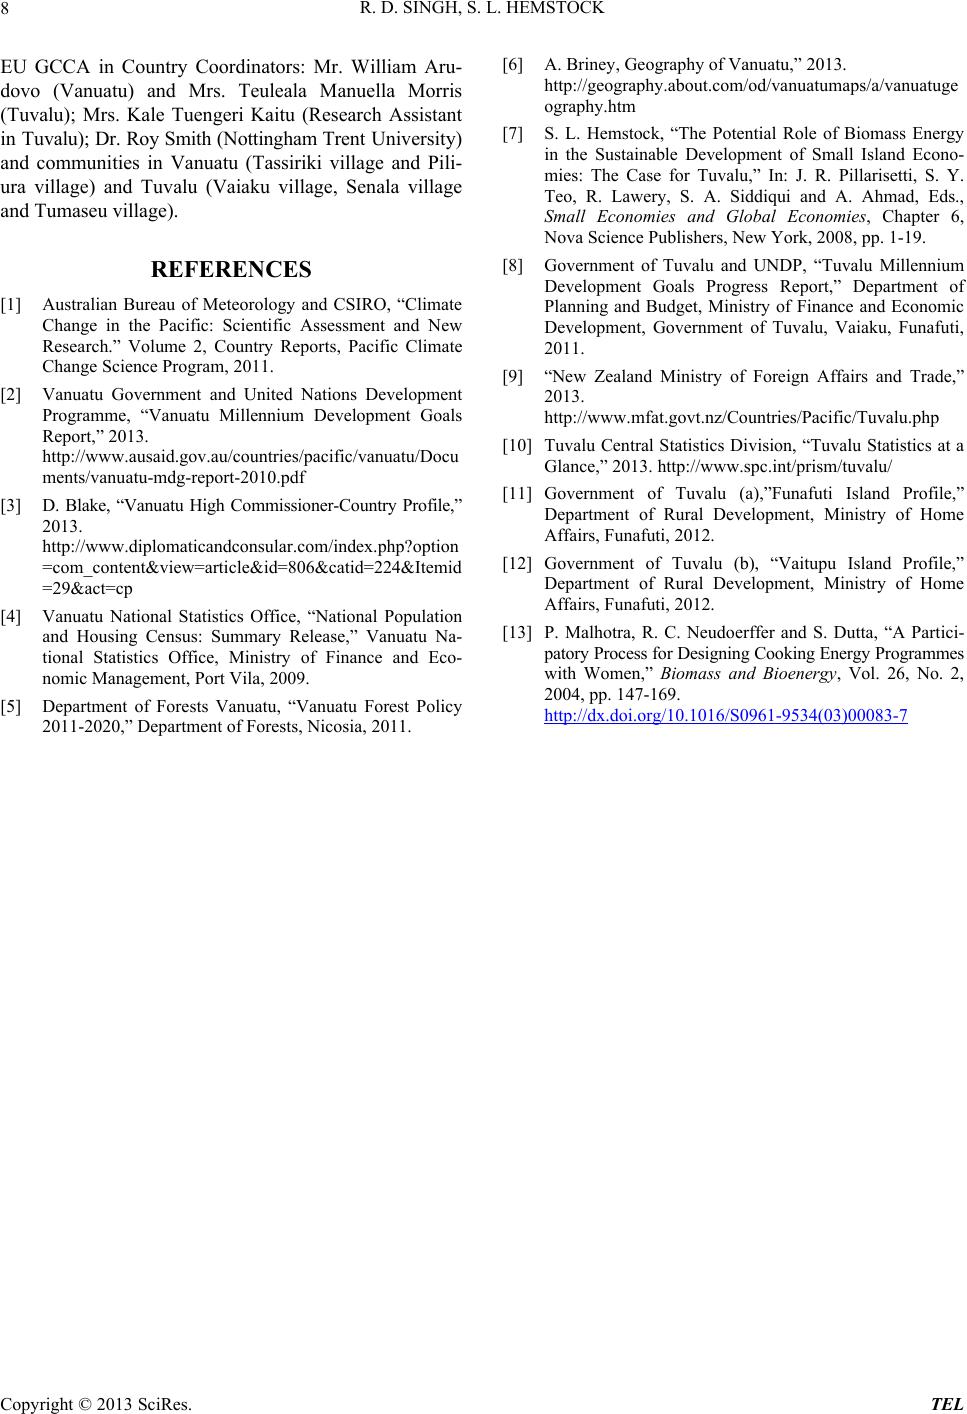 R. D. SINGH, S. L. HEMSTOCK 8 EU GCCA in Country Coordinators: Mr. William Aru- dovo (Vanuatu) and Mrs. Teuleala Manuella Morris (Tuvalu); Mrs. Kale Tuengeri Kaitu (Research Assistant in Tuvalu); Dr. Roy Smith (Nottingham Trent U nive rsit y) and communities in Vanuatu (Tassiriki village and Pili- ura village) and Tuvalu (Vaiaku village, Senala village and Tumaseu village). REFERENCES [1] Australian Bureau of Meteorology and CSIRO, “Climate Change in the Pacific: Scientific Assessment and New Research.” Volume 2, Country Reports, Pacific Climate Change Science Program, 2011. [2] Vanuatu Government and United Nations Development Programme, “Vanuatu Millennium Development Goals Report,” 2013. http://www.ausaid.gov.au/countries/pacific/vanuatu/Docu ments/vanuatu-mdg-report-2010.pdf [3] D. Blake, “Vanuatu High Commissioner-Country Profile,” 2013. http://www.diplomaticandconsular.com/index.php?option =com_content&view=article&id=806&catid=224&Itemid =29&act=cp [4] Vanuatu National Statistics Office, “National Population and Housing Census: Summary Release,” Vanuatu Na- tional Statistics Office, Ministry of Finance and Eco- nomic Management, Port Vila, 2009. [5] Department of Forests Vanuatu, “Vanuatu Forest Policy 2011-2020,” Department of Forests, Nicosia, 2011. [6] A. Briney, Geography of Vanuatu,” 2013. http://geography.about.com/od/vanuatumaps/a/vanuatuge ography.htm [7] S. L. Hemstock, “The Potential Role of Biomass Energy in the Sustainable Development of Small Island Econo- mies: The Case for Tuvalu,” In: J. R. Pillarisetti, S. Y. Teo, R. Lawery, S. A. Siddiqui and A. Ahmad, Eds., Small Economies and Global Economies, Chapter 6, Nova Science Publishers, New York, 2008, pp. 1-19. [8] Government of Tuvalu and UNDP, “Tuvalu Millennium Development Goals Progress Report,” Department of Planning and Budget, Ministry of Finance and Economic Development, Government of Tuvalu, Vaiaku, Funafuti, 2011. [9] “New Zealand Ministry of Foreign Affairs and Trade,” 2013. http://www.mfat.govt.nz/Countries/Pacific/Tuvalu.php [10] Tuvalu Central Statistics Division, “Tuvalu Statistics at a Glance,” 2013. http://www.spc.int/prism/tuvalu/ [11] Government of Tuvalu (a),”Funafuti Island Profile,” Department of Rural Development, Ministry of Home Affairs, Funafuti, 2012. [12] Government of Tuvalu (b), “Vaitupu Island Profile,” Department of Rural Development, Ministry of Home Affairs, Funafuti, 2012. [13] P. Malhotra, R. C. Neudoerffer and S. Dutta, “A Partici- patory Process for Desi gning Coo king Energy Pro grammes with Women,” Biomass and Bioenergy, Vol. 26, No. 2, 2004, pp. 147-169. http://dx.doi.org/10.1016/S0961-9534(03)00083-7 Copyright © 2013 SciRes. TEL |