

Paper Menu >>
Journal Menu >>
 Open Journal of Forestry 2013. Vol.3, No.4, 122-128 Published Online October 2013 in SciRes (http://www.scirp.org/journal/ojf) http://dx.doi.org/10.4236/ojf.2013.34020 Copyright © 2013 SciRes. 122 An Evaluation Model for Improving Biodiversity in Artificial Coniferous Forests Invaded by Broadleaf Trees Yozo Yamada, Sayumi Kosaka Graduate School of Bio-Agricultural Sciences, Nagoya University, Nagoya, Japan Email: [email protected] Received July 16th, 2013; revised August 17th, 2013; accepted August 29th, 2013 Copyright © 2013 Yozo Yamada, Sayumi Kosaka. This is an open access article distributed under the Creative Commons Attribution License, which permits unrestricted use, distribution, and reproduction in any medium, provided the original work is properly cited. Increasing attention is being paid to the various functions of forests, especially the conservation of biodi- versity. In Japan, 67% of national land is covered by forest, 41% of which is artificial forest (i.e., planta- tions). Therefore, efforts to conserve forest biodiversity should also target artificial forests. In this study, we investigated the increase in biodiversity resulting from broadleaf tree invasion of artificial coniferous forests. We examined diversity indices and combinations of indices to identify which ones can aid forest managers in evaluating forest diversity. We also studied classification according to the richness of diver- sity, which corresponded to the growth stages of Chamaecyparisobtusa and Cryptomeria japonica planta- tion forests. Moreover, we developed a model that will contribute to sustainable forest management and biodiversity over an entire area. The model, based on a specific rotation scenario in a geographic informa- tion system, is easy to use and presents spatial and temporal changes at sites visually. Keywords: Artificial Forest; Invading Broadleaf Trees; Broadleaf Tree Diversity; Sustainable Forestry Management; Basin Scale Introduction The importance of forest biodiversity has been discussed since the United Nations Conference on Environment and De- velopment (UNCED) in 1992. The UNCED adopted the Dec- laration on Forest Principles in Agenda 21, which is a series of principles for sustainable forest use (Lund et al., 2004). In 1994, the Montréal Process Working Group agreed on seven criteria of sustainable forest management and 54 indicators of the crite- ria. Criterion 1 stipulates the conservation of biological diver- sity and states that conserving the diversity of organisms and their habitats supports forest ecosystems and their ability to function, reproduce, and remain productive (Montreal Process, 2009). Many studies have confirmed the importance of forest diversity, although most have focused on natural forests (Bur- slem, 2004; Ehrlich, 1996; Kondoh, 2002; Noss, 1990). Artificial forests account for approximately 6.5% of the global forested area. The percentage of artificial forest varies by country. In Japan, 68.5% of the land area is covered by forest, 41.3% of which is artificial forest (FAO, 2012). By age, artifi- cial forests in Japan form a nearly perfect normal distribution, with a top age of 50 years. Thus, vast areas of forest require immediate thinning (Forestry Agency, 2012). However, many of the artificial forests that require thinning have been deterio- rating, mainly because of reductions in forestry surplus. In countries such as Japan that have vast areas of artificial forest, biodiversity loss has become a problem, even in the artificial forests since last few decades. Many artificial forests are de- signed as monoculture plantations with the aim of growing high-quality timber. Thus, these forests are generally dark with sparse understory vegetation. Brockerhoff et al. (2008) noted that artificial forests usually have less habitat diversity and complexity. Yamaura (2007) also suggested that artificial for- ests have been treated as a homogeneous non-habitat (matrix) and ignored in biodiversity conservation. However, the environment in an artificial forest can be al- tered to become more favorable to biodiversity. Hartley (2002) indicated that earlier thinning schedules or longer rotations can strongly affect biodiversity, as can reserve trees that are left after plantation harvest and remain through a second rotation. Busing and Garman (2002) argued that proportional thinning retains understory stems, thereby expediting the recruitment of shade-tolerant trees. El-Keblawy (2005) suggested the impor- tance of reducing forest crowns to promote species growth. Yamaura (2007) proposed that the negative effects of artificial forest could be mitigated by increasing the complexity of the structure and composition of a plantation through extended rotation, strong thinning, wider tree spacing, and the retention of broadleaf trees and coarse woody debris in clear-cuts. Broc- kerhoff et al. (2008) also stressed that to sustain native biodi- versity within an artificial forest, managers should consider using a greater diversity of planted species, extending rotation lengths in some stands, and adopting a variety of harvesting approaches. The overall aim of the present study was to promote the di- versity of invading broadleaf trees in artificial coniferous for- ests. We examined effective diversity indices and combinations of these indices that can be used by forest managers to evaluate forest diversity. In addition, we studied classification according to the richness of diversity, which was found to correspond to growth stages in Chamaecyparisobtusa and Cryptomeria ja- ponica artificial forests. Moreover, to help forest managers 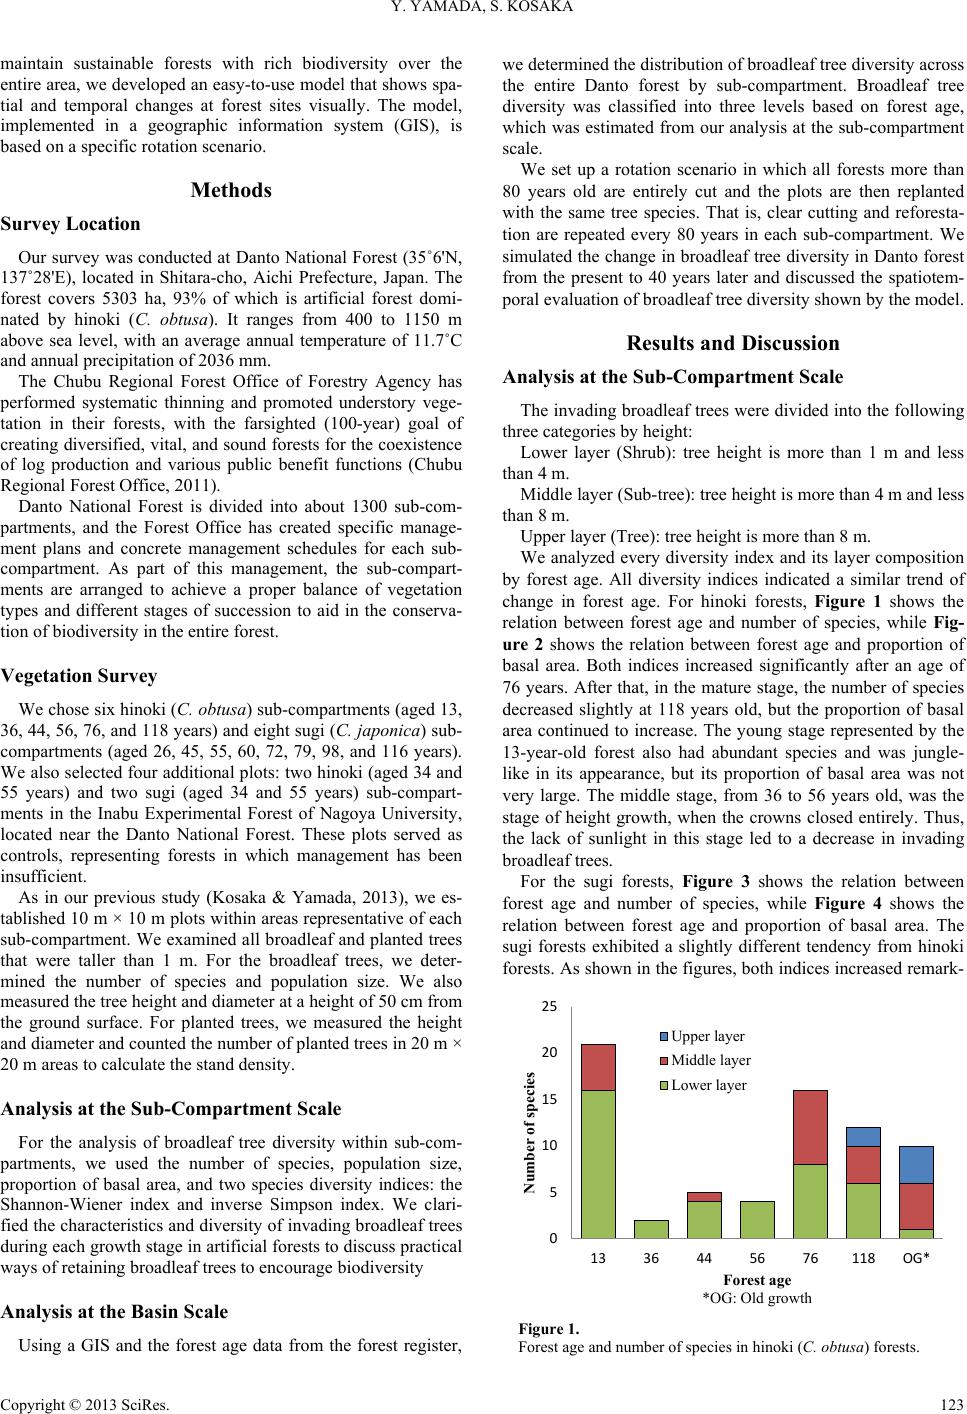 Y. YAMADA, S. KOSAKA maintain sustainable forests with rich biodiversity over the entire area, we developed an easy-to-use model that shows spa- tial and temporal changes at forest sites visually. The model, implemented in a geographic information system (GIS), is based on a specific rotation scenario. Methods Survey Location Our survey was conducted at Danto National Forest (35˚6'N, 137˚28'E), located in Shitara-cho, Aichi Prefecture, Japan. The forest covers 5303 ha, 93% of which is artificial forest domi- nated by hinoki (C. obtusa). It ranges from 400 to 1150 m above sea level, with an average annual temperature of 11.7˚C and annual precipitation of 2036 mm. The Chubu Regional Forest Office of Forestry Agency has performed systematic thinning and promoted understory vege- tation in their forests, with the farsighted (100-year) goal of creating diversified, vital, and sound forests for the coexistence of log production and various public benefit functions (Chubu Regional Forest Office, 2011). Danto National Forest is divided into about 1300 sub-com- partments, and the Forest Office has created specific manage- ment plans and concrete management schedules for each sub- compartment. As part of this management, the sub-compart- ments are arranged to achieve a proper balance of vegetation types and different stages of succession to aid in the conserva- tion of biodiversity in the entire forest. Vegetation Survey We chose six hinoki (C. obtusa) sub-compartments (aged 13, 36, 44, 56, 76, and 118 years) and eight sugi (C. japonica) sub- compartments (aged 26, 45, 55, 60, 72, 79, 98, and 116 years). We also selected four additional plots: two hinoki (aged 34 and 55 years) and two sugi (aged 34 and 55 years) sub-compart- ments in the Inabu Experimental Forest of Nagoya University, located near the Danto National Forest. These plots served as controls, representing forests in which management has been insufficient. As in our previous study (Kosaka & Yamada, 2013), we es- tablished 10 m × 10 m plots within areas representative of each sub-compartment. We examined all broadleaf and planted trees that were taller than 1 m. For the broadleaf trees, we deter- mined the number of species and population size. We also measured the tree height and diameter at a height of 50 cm from the ground surface. For planted trees, we measured the height and diameter and counted the number of planted trees in 20 m × 20 m areas to calculate the stand density. Analysis at the Sub-Compartment Scale For the analysis of broadleaf tree diversity within sub-com- partments, we used the number of species, population size, proportion of basal area, and two species diversity indices: the Shannon-Wiener index and inverse Simpson index. We clari- fied the characteristics and diversity of invading broadleaf trees during each growth stage in artificial forests to discuss practical ways of retaining broadleaf trees to encourage biodiversity Analysis at the Basin Scale Using a GIS and the forest age data from the forest register, we determined the distribution of broadleaf tree diversity across the entire Danto forest by sub-compartment. Broadleaf tree diversity was classified into three levels based on forest age, which was estimated from our analysis at the sub-compartment scale. We set up a rotation scenario in which all forests more than 80 years old are entirely cut and the plots are then replanted with the same tree species. That is, clear cutting and reforesta- tion are repeated every 80 years in each sub-compartment. We simulated the change in broadleaf tree diversity in Danto forest from the present to 40 years later and discussed the spatiotem- poral evaluation of broadleaf tree diversity shown by the model. Results and Discussion Analysis at the Sub-Compartment Scale The invading broadleaf trees were divided into the following three categories by height: Lower layer (Shrub): tree height is more than 1 m and less than 4 m. Middle layer (Sub-tree): tree height is more than 4 m and less than 8 m. Upper layer (Tree): tree height is more than 8 m. We analyzed every diversity index and its layer composition by forest age. All diversity indices indicated a similar trend of change in forest age. For hinoki forests, Figure 1 shows the relation between forest age and number of species, while Fig- ure 2 shows the relation between forest age and proportion of basal area. Both indices increased significantly after an age of 76 years. After that, in the mature stage, the number of species decreased slightly at 118 years old, but the proportion of basal area continued to increase. The young stage represented by the 13-year-old forest also had abundant species and was jungle- like in its appearance, but its proportion of basal area was not very large. The middle stage, from 36 to 56 years old, was the stage of height growth, when the crowns closed entirely. Thus, the lack of sunlight in this stage led to a decrease in invading broadleaf trees. For the sugi forests, Figure 3 shows the relation between forest age and number of species, while Figure 4 shows the relation between forest age and proportion of basal area. The sugi forests exhibited a slightly different tendency from hinoki forests. As shown in the figures, both indices increased remark- 0 5 10 15 20 25 13 36 44 56 76118OG* Number of species Forest age *OG: Old growth Upper layer Middle layer Lower layer Figure 1. Forest age and number of species in hinoki (C. obtusa) forests. Copyright © 2013 SciRes. 123 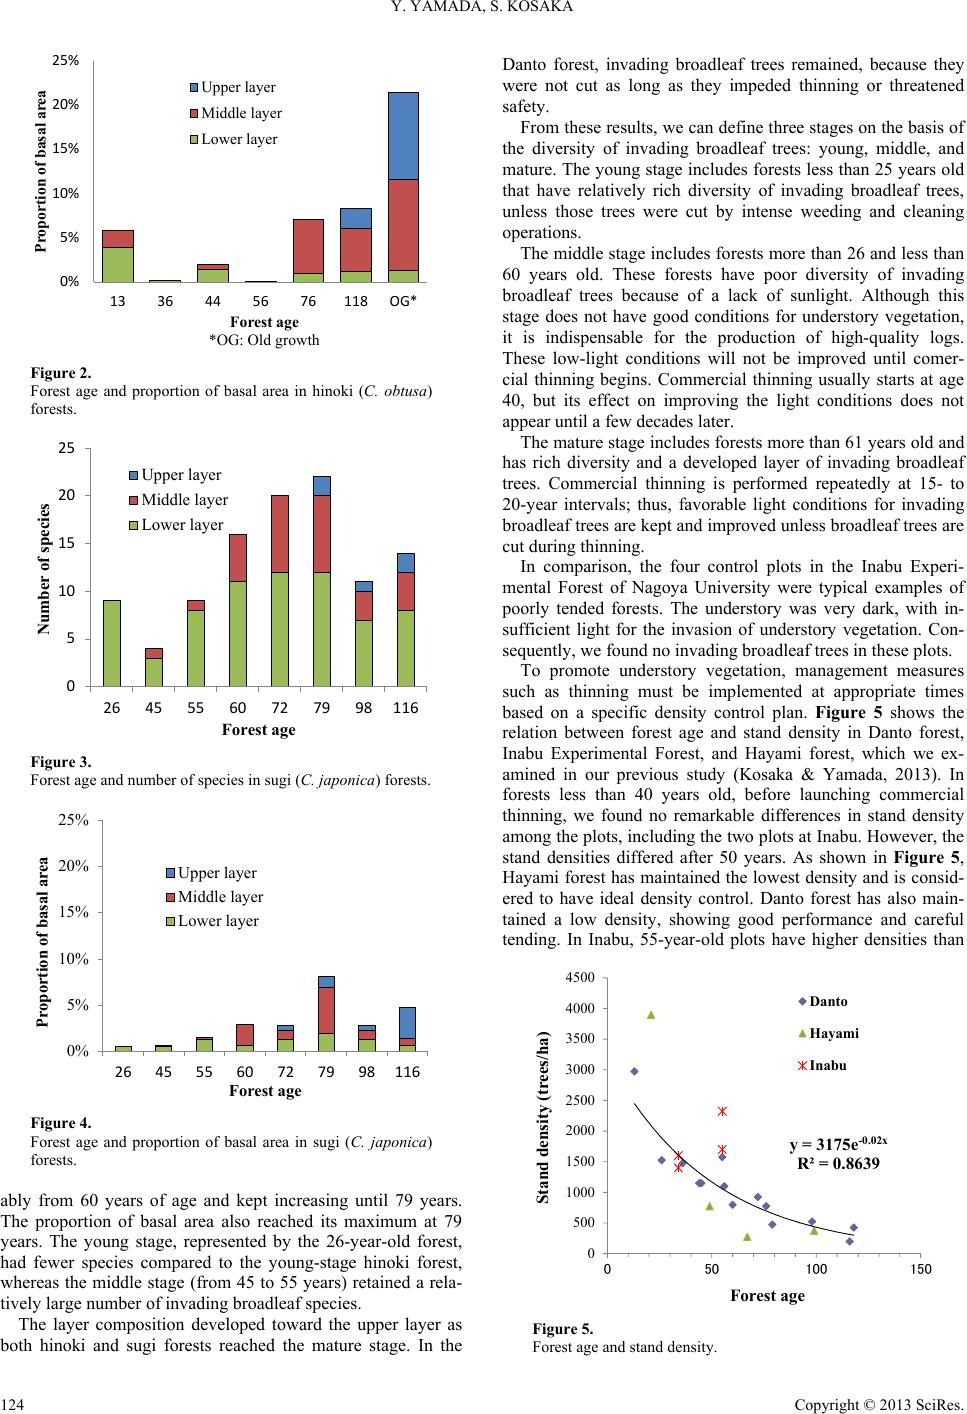 Y. YAMADA, S. KOSAKA 0% 5% 10% 15% 20% 25% 13 36 44 56 76118OG* P roportion of basa l area Forest age *OG: Old growth Upper layer Middle layer Lower layer Figure 2. Forest age and proportion of basal area in hinoki (C. obtusa) forests. 0 5 10 15 20 25 26 45 55 60 72 79 98116 Number of species Forest age Upper layer Middle layer Lower layer Figure 3. Forest age and number of species in sugi (C. japonica) forests. 0% 5% 10% 15% 20% 25% 26 45 55 60 72 79 98116 P roportion o f basal area Forest age Upper layer Middle layer Lower layer Figure 4. Forest age and proportion of basal area in sugi (C. japonica) forests. ably from 60 years of age and kept increasing until 79 years. The proportion of basal area also reached its maximum at 79 years. The young stage, represented by the 26-year-old forest, had fewer species compared to the young-stage hinoki forest, whereas the middle stage (from 45 to 55 years) retained a rela- tively large number of invading broadleaf species. The layer composition developed toward the upper layer as both hinoki and sugi forests reached the mature stage. In the Danto forest, invading broadleaf trees remained, because they were not cut as long as they impeded thinning or threatened safety. From these results, we can define three stages on the basis of the diversity of invading broadleaf trees: young, middle, and mature. The young stage includes forests less than 25 years old that have relatively rich diversity of invading broadleaf trees, unless those trees were cut by intense weeding and cleaning operations. The middle stage includes forests more than 26 and less than 60 years old. These forests have poor diversity of invading broadleaf trees because of a lack of sunlight. Although this stage does not have good conditions for understory vegetation, it is indispensable for the production of high-quality logs. These low-light conditions will not be improved until comer- cial thinning begins. Commercial thinning usually starts at age 40, but its effect on improving the light conditions does not appear until a few decades later. The mature stage includes forests more than 61 years old and has rich diversity and a developed layer of invading broadleaf trees. Commercial thinning is performed repeatedly at 15- to 20-year intervals; thus, favorable light conditions for invading broadleaf trees are kept and improved unless broadleaf trees are cut during thinning. In comparison, the four control plots in the Inabu Experi- mental Forest of Nagoya University were typical examples of poorly tended forests. The understory was very dark, with in- sufficient light for the invasion of understory vegetation. Con- sequently, we found no invading broadleaf trees in these plots. To promote understory vegetation, management measures such as thinning must be implemented at appropriate times based on a specific density control plan. Figure 5 shows the relation between forest age and stand density in Danto forest, Inabu Experimental Forest, and Hayami forest, which we ex- amined in our previous study (Kosaka & Yamada, 2013). In forests less than 40 years old, before launching commercial thinning, we found no remarkable differences in stand density among the plots, including the two plots at Inabu. However, the stand densities differed after 50 years. As shown in Figure 5, Hayami forest has maintained the lowest density and is consid- ered to have ideal density control. Danto forest has also main- tained a low density, showing good performance and careful tending. In Inabu, 55-year-old plots have higher densities than y = 3175e-0.02x R² = 0.8639 0 500 1000 1500 2000 2500 3000 3500 4000 4500 050100 150 Stand density (trees/ha) For est age Danto Hayami Inabu Figure 5. Forest age and stand density. Copyright © 2013 SciRes. 124 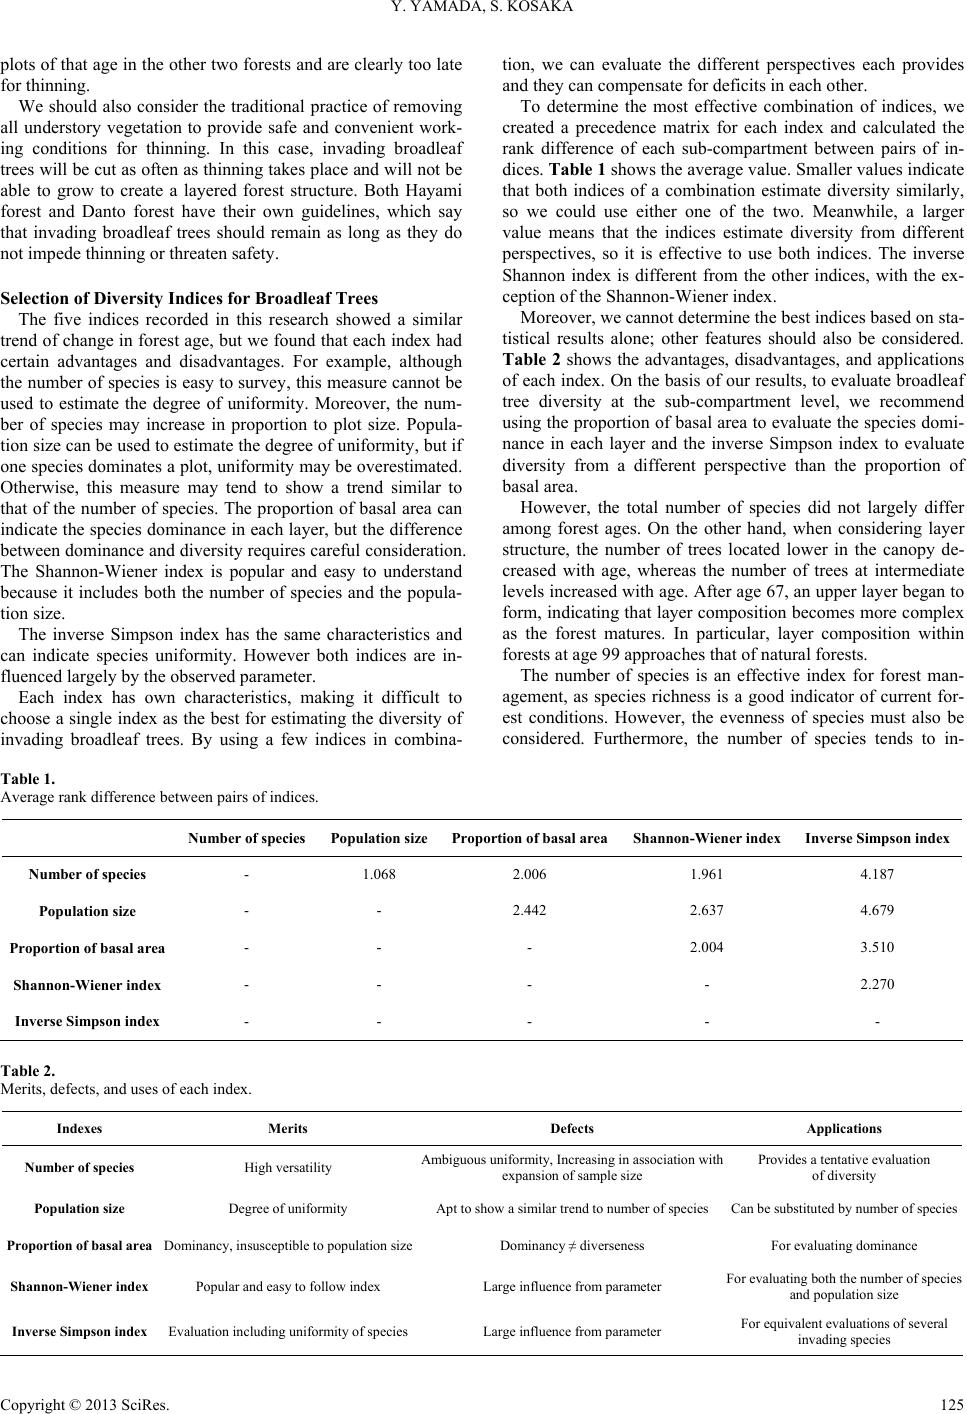 Y. YAMADA, S. KOSAKA Copyright © 2013 SciRes. 125 plots of that age in the other two forests and are clearly too late for thinning. We should also consider the traditional practice of removing all understory vegetation to provide safe and convenient work- ing conditions for thinning. In this case, invading broadleaf trees will be cut as often as thinning takes place and will not be able to grow to create a layered forest structure. Both Hayami forest and Danto forest have their own guidelines, which say that invading broadleaf trees should remain as long as they do not impede thinning or threaten safety. Selection of Diversity Indices for Broadleaf Trees The five indices recorded in this research showed a similar trend of change in forest age, but we found that each index had certain advantages and disadvantages. For example, although the number of species is easy to survey, this measure cannot be used to estimate the degree of uniformity. Moreover, the num- ber of species may increase in proportion to plot size. Popula- tion size can be used to estimate the degree of uniformity, but if one species dominates a plot, uniformity may be overestimated. Otherwise, this measure may tend to show a trend similar to that of the number of species. The proportion of basal area can indicate the species dominance in each layer, but the difference between dominance and diversity requires careful consideration. The Shannon-Wiener index is popular and easy to understand because it includes both the number of species and the popula- tion size. The inverse Simpson index has the same characteristics and can indicate species uniformity. However both indices are in- fluenced largely by the observed parameter. Each index has own characteristics, making it difficult to choose a single index as the best for estimating the diversity of invading broadleaf trees. By using a few indices in combina- tion, we can evaluate the different perspectives each provides and they can compensate for deficits in each other. To determine the most effective combination of indices, we created a precedence matrix for each index and calculated the rank difference of each sub-compartment between pairs of in- dices. Table 1 shows the average value. Smaller values indicate that both indices of a combination estimate diversity similarly, so we could use either one of the two. Meanwhile, a larger value means that the indices estimate diversity from different perspectives, so it is effective to use both indices. The inverse Shannon index is different from the other indices, with the ex- ception of the Shannon-Wiener index. Moreover, we cannot determine the best indices based on sta- tistical results alone; other features should also be considered. Table 2 shows the advantages, disadvantages, and applications of each index. On the basis of our results, to evaluate broadleaf tree diversity at the sub-compartment level, we recommend using the proportion of basal area to evaluate the species domi- nance in each layer and the inverse Simpson index to evaluate diversity from a different perspective than the proportion of basal area. However, the total number of species did not largely differ among forest ages. On the other hand, when considering layer structure, the number of trees located lower in the canopy de- creased with age, whereas the number of trees at intermediate levels increased with age. After age 67, an upper layer began to form, indicating that layer composition becomes more complex as the forest matures. In particular, layer composition within forests at age 99 approaches that of natural forests. The number of species is an effective index for forest man- agement, as species richness is a good indicator of current for- est conditions. However, the evenness of species must also be considered. Furthermore, the number of species tends to in- Table 1. Average rank difference between pairs of indices. Number of species Population sizeProportio n o f basal areaShannon-Wiener index I nv erse Simpson inde x Number of species - 1.068 2.006 1.961 4.187 Population size - - 2.442 2.637 4.679 Proportio n o f basal area - - - 2.004 3.510 Shannon-Wiener index - - - - 2.270 Inverse Simpson index - - - - - Table 2. Merits, defects, and uses of each index. Indexes Merits Defects Applications Number of species High versatility Ambiguous uniformity, Increasing in association with expansion of sample size Provides a tentative evaluation of diversity Population size Degree of uniformity Apt to show a similar trend to number of species Can be substituted by number of species Proportion of basal a re a Dominancy, insusceptible to population sizeDominancy ≠ diverseness For evaluating dominance Shannon-Wiener index Popular and easy to follow index Large influence from parameter For evaluating both the number of species and population size Inverse Simpson index Evaluation including uniformity of speciesLarge influence from parameter For equivalent evaluations of several invading species 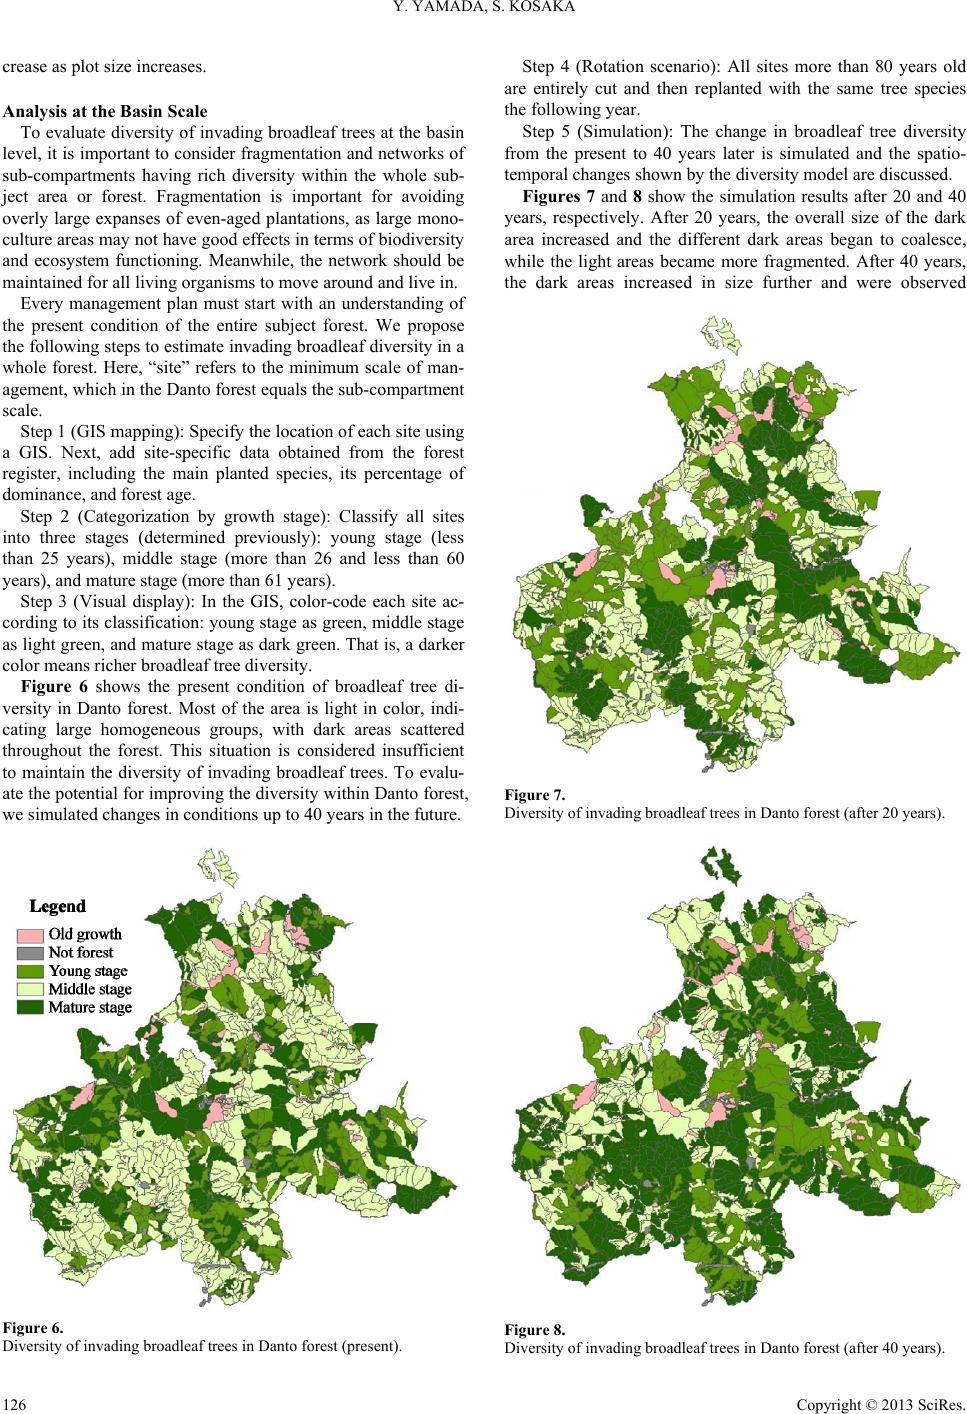 Y. YAMADA, S. KOSAKA crease as plot size increases. Analysis at the Basin Scale To evaluate diversity of invading broadleaf trees at the basin level, it is important to consider fragmentation and networks of sub-compartments having rich diversity within the whole sub- ject area or forest. Fragmentation is important for avoiding overly large expanses of even-aged plantations, as large mono- culture areas may not have good effects in terms of biodiversity and ecosystem functioning. Meanwhile, the network should be maintained for all living organisms to move around and live in. Every management plan must start with an understanding of the present condition of the entire subject forest. We propose the following steps to estimate invading broadleaf diversity in a whole forest. Here, “site” refers to the minimum scale of man- agement, which in the Danto forest equals the sub-compartment scale. Step 1 (GIS mapping): Specify the location of each site using a GIS. Next, add site-specific data obtained from the forest register, including the main planted species, its percentage of dominance, and forest age. Step 2 (Categorization by growth stage): Classify all sites into three stages (determined previously): young stage (less than 25 years), middle stage (more than 26 and less than 60 years), and mature stage (more than 61 years). Step 3 (Visual display): In the GIS, color-code each site ac- cording to its classification: young stage as green, middle stage as light green, and mature stage as dark green. That is, a darker color means richer broadleaf tree diversity. Figure 6 shows the present condition of broadleaf tree di- versity in Danto forest. Most of the area is light in color, indi- cating large homogeneous groups, with dark areas scattered throughout the forest. This situation is considered insufficient to maintain the diversity of invading broadleaf trees. To evalu- ate the potential for improving the diversity within Danto forest, we simulated changes in conditions up to 40 years in the future. Figure 6. Diversity of invading broadleaf trees in Danto forest (present). Step 4 (Rotation scenario): All sites more than 80 years old are entirely cut and then replanted with the same tree species the following year. Step 5 (Simulation): The change in broadleaf tree diversity from the present to 40 years later is simulated and the spatio- temporal changes shown by the diversity model are discussed. Figures 7 and 8 show the simulation results after 20 and 40 years, respectively. After 20 years, the overall size of the dark area increased and the different dark areas began to coalesce, while the light areas became more fragmented. After 40 years, the dark areas increased in size further and were observed Figure 7. Diversity of invading broadleaf trees in Danto forest (after 20 years). Figure 8. Diversity of invading broadleaf trees in Danto forest (after 40 years). Copyright © 2013 SciRes. 126 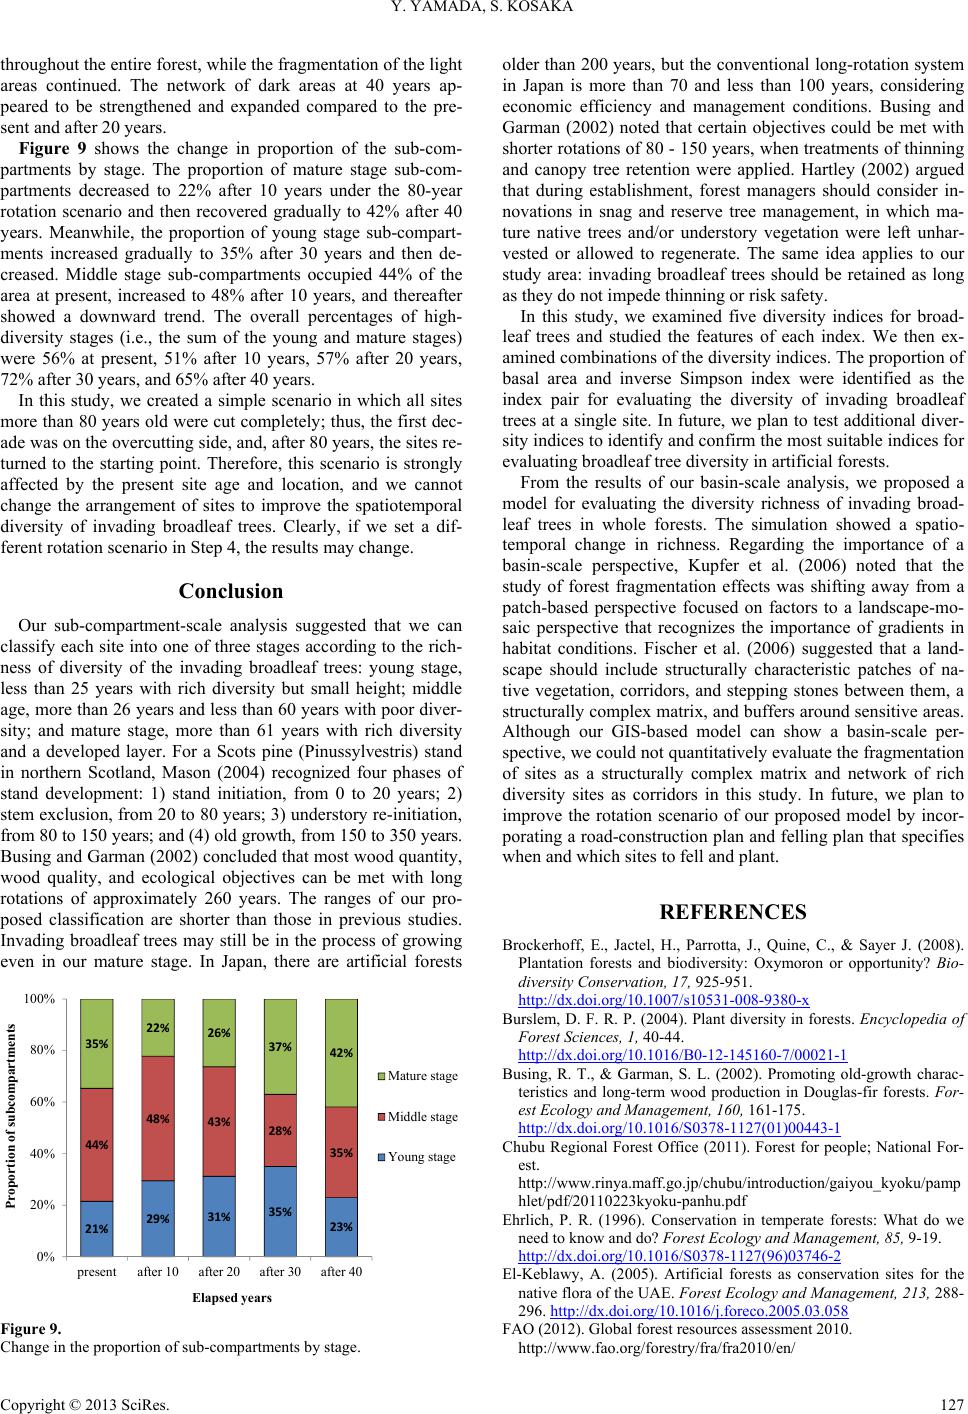 Y. YAMADA, S. KOSAKA throughout the entire forest, while the fragmentation of the light areas continued. The network of dark areas at 40 years ap- peared to be strengthened and expanded compared to the pre- sent and after 20 years. Figure 9 shows the change in proportion of the sub-com- partments by stage. The proportion of mature stage sub-com- partments decreased to 22% after 10 years under the 80-year rotation scenario and then recovered gradually to 42% after 40 years. Meanwhile, the proportion of young stage sub-compart- ments increased gradually to 35% after 30 years and then de- creased. Middle stage sub-compartments occupied 44% of the area at present, increased to 48% after 10 years, and thereafter showed a downward trend. The overall percentages of high- diversity stages (i.e., the sum of the young and mature stages) were 56% at present, 51% after 10 years, 57% after 20 years, 72% after 30 years, and 65% after 40 years. In this study, we created a simple scenario in which all sites more than 80 years old were cut completely; thus, the first dec- ade was on the overcutting side, and, after 80 years, the sites re- turned to the starting point. Therefore, this scenario is strongly affected by the present site age and location, and we cannot change the arrangement of sites to improve the spatiotemporal diversity of invading broadleaf trees. Clearly, if we set a dif- ferent rotation scenario in Step 4, the results may change. Conclusion Our sub-compartment-scale analysis suggested that we can classify each site into one of three stages according to the rich- ness of diversity of the invading broadleaf trees: young stage, less than 25 years with rich diversity but small height; middle age, more than 26 years and less than 60 years with poor diver- sity; and mature stage, more than 61 years with rich diversity and a developed layer. For a Scots pine (Pinussylvestris) stand in northern Scotland, Mason (2004) recognized four phases of stand development: 1) stand initiation, from 0 to 20 years; 2) stem exclusion, from 20 to 80 years; 3) understory re-initiation, from 80 to 150 years; and (4) old growth, from 150 to 350 years. Busing and Garman (2002) concluded that most wood quantity, wood quality, and ecological objectives can be met with long rotations of approximately 260 years. The ranges of our pro- posed classification are shorter than those in previous studies. Invading broadleaf trees may still be in the process of growing even in our mature stage. In Japan, there are artificial forests 21% 29% 31% 35% 23% 44% 48% 43% 28% 35% 35% 22% 26% 37% 42% 0% 20% 40% 60% 80% 100% presentafter 10after 20after 30after 40 Pr oportion of subcom partm ents Elapsed year s Mature stage Middle stage Young stage Figure 9. Change in the proportion of sub-compartments by stage. older than 200 years, but the conventional long-rotation system in Japan is more than 70 and less than 100 years, considering economic efficiency and management conditions. Busing and Garman (2002) noted that certain objectives could be met with shorter rotations of 80 - 150 years, when treatments of thinning and canopy tree retention were applied. Hartley (2002) argued that during establishment, forest managers should consider in- novations in snag and reserve tree management, in which ma- ture native trees and/or understory vegetation were left unhar- vested or allowed to regenerate. The same idea applies to our study area: invading broadleaf trees should be retained as long as they do not impede thinning or risk safety. In this study, we examined five diversity indices for broad- leaf trees and studied the features of each index. We then ex- amined combinations of the diversity indices. The proportion of basal area and inverse Simpson index were identified as the index pair for evaluating the diversity of invading broadleaf trees at a single site. In future, we plan to test additional diver- sity indices to identify and confirm the most suitable indices for evaluating broadleaf tree diversity in artificial forests. From the results of our basin-scale analysis, we proposed a model for evaluating the diversity richness of invading broad- leaf trees in whole forests. The simulation showed a spatio- temporal change in richness. Regarding the importance of a basin-scale perspective, Kupfer et al. (2006) noted that the study of forest fragmentation effects was shifting away from a patch-based perspective focused on factors to a landscape-mo- saic perspective that recognizes the importance of gradients in habitat conditions. Fischer et al. (2006) suggested that a land- scape should include structurally characteristic patches of na- tive vegetation, corridors, and stepping stones between them, a structurally complex matrix, and buffers around sensitive areas. Although our GIS-based model can show a basin-scale per- spective, we could not quantitatively evaluate the fragmentation of sites as a structurally complex matrix and network of rich diversity sites as corridors in this study. In future, we plan to improve the rotation scenario of our proposed model by incor- porating a road-construction plan and felling plan that specifies when and which sites to fell and plant. REFERENCES Brockerhoff, E., Jactel, H., Parrotta, J., Quine, C., & Sayer J. (2008). Plantation forests and biodiversity: Oxymoron or opportunity? Bio- diversity Conservation, 17, 925-951. http://dx.doi.org/10.1007/s10531-008-9380-x Burslem, D. F. R. P. (2004). Plant diversity in forests. Encyclopedia of Forest Sciences, 1, 40-44. http://dx.doi.org/10.1016/B0-12-145160-7/00021-1 Busing, R. T., & Garman, S. L. (2002). Promoting old-growth charac- teristics and long-term wood production in Douglas-fir forests. For- est Ecology and Management, 16 0 , 161-175. http://dx.doi.org/10.1016/S0378-1127(01)00443-1 Chubu Regional Forest Office (2011). Forest for people; National For- est. http://www.rinya.maff.go.jp/chubu/introduction/gaiyou_kyoku/pamp hlet/pdf/20110223kyoku-panhu.pdf Ehrlich, P. R. (1996). Conservation in temperate forests: What do we need to know and do? Forest Ecology and Management, 85, 9-19. http://dx.doi.org/10.1016/S0378-1127(96)03746-2 El-Keblawy, A. (2005). Artificial forests as conservation sites for the native flora of the UAE. Forest Ecology and Management, 213, 288- 296. http://dx.doi.org/10.1016/j.foreco.2005.03.058 FAO (2012). Global forest resources assessment 2010. http://www.fao.org/forestry/fra/fra2010/en/ Copyright © 2013 SciRes. 127  Y. YAMADA, S. KOSAKA Copyright © 2013 SciRes. 128 Fischer, J., Lindenmayer, D. B., & Manning, A. D. (2006). Biodiversity, ecosystem function, and resilience: Ten guiding principles for com- modity production landscape. Frontiers in Ecology and the Envi- ronment, 4, 80-86. http://dx.doi.org/10.1890/1540-9295(2006)004[0080:BEFART]2.0.C O;2 Forestry Agency (2012). Annual report on forest and forestry in Japan, fiscal year 2011. Hartley, M. J. (2002). Rationale and methods for conserving biodiver- sity in plantation forests. Forest Ecology and Management, 155, 81- 95. http://dx.doi.org/10.1016/S0378-1127(01)00549-7 Kondoh, M. (2002). What determines the biodiversity pattern? Unify- ing “intermediate disturbance hypothesis” and “procuctively hypo- thesis”. Biological Science, 5 3, 195-203. Kosaka, S., & Yamada, Y. (2013). Evaluation of broadleaf tree diver- sity at the basin scale: In case of artificial Chamaecyparisobtusa for- ests. Open Journal of Forestry, 3, 62-65. http://dx.doi.org/10.4236/ojf.2013.32010 Kupfer, J. A., Malanson, G. P., & Franklin, S. B. (2006). Not seeing the ocean for the islands: The mediating influence of matrix-based proc- esses on forest fragmentation effects. Global Ecology and Biogeog- raphy, 15, 8-20. http://dx.doi.org/10.1111/j.1466-822X.2006.00204.x Lund, H., Dallmeier, F., & Alonso, A. (2004). Biodiversity in forests. Encyclopedia of Forest Scienc es, 1, 33-40. Mason, W. (2004). Multiple-use silviculture in temperate plantation forestry. Encyclopedia of Forest Sciences, 2, 859-865. http://dx.doi.org/10.1016/B0-12-145160-7/00225-8 Montreal Process (2009). Criteria and indicators for the conservation and sustainable management of temperate and boreal forests. 4th Edition, 29 p. Noss, R. F. (1990). Indicators for monitoring biodiversity: A hierarchi- cal approach. Conservation Biology, 4, 355-364. http://dx.doi.org/10.1111/j.1523-1739.1990.tb00309.x Yamaura, Y. (2007). Mitigating effects of broadleaved forest fragmen- tation on birds: Proposal of plantation matrix management. Journal of Japanese Forest Society, 89, 416-430. http://dx.doi.org/10.4005/jjfs.89.416 |