

Paper Menu >>
Journal Menu >>
 Open Journal of Forestry 2013. Vol.3, No.4, 115-121 Published Online October 2013 in SciRes (http://www.scirp.org/journal/ojf) http://dx.doi.org/10.4236/ojf.2013.34019 Copyright © 2013 SciRes. 115 Modeling the Distribution of Marketable Timber Products of Private Teak (Tectona grandis L.f.) Plantations Noël H. Fonton1*, Gilbert Atindogbé1, Arcadius Y. Akossou2, Brice T. Missanon1, Belarmain Fadohan1, Philippe Lejeune3 1Laboratory of Study and Research in Applied Statistics and Biometry, University of Abomey-Calavi, Abomey-Calavi, Benin 2Faculty of Agronomy, University of Parakou, Parakou, Benin 3Unit of Forest and Nature Management, Gembloux Agro-Bio Tech, University of Liege, Gembloux, Belgium Email: *[email protected] Received May 16th, 2013; revised July 2nd, 2013; accepted July 22nd, 2013 Copyright © 2013 Noël H. Fonton et al. This is an open access article distributed under the Creative Commons Attribution License, which permits unrestricted use, distribution, and reproduction in any medium, provided the original work is properly cited. Management of marketable products of private plantations will not be sustainable without class girth be- ing identifiable readily. Modeling marketable products is a key to obtain good fitness between observed and theoretical girth distribution. We determine the best parameter recovery method with the Weibull function for two sylvicultural regimes (coppice and high forest). Data on stand variables were collected from 1101 sample plots. The three Weibull function parameters were estimated with three parameters re- covery methods: the maximum likelihood method, the method of moments and the method of percentiles. Stepwise regression and the simultaneously re-estimated parameter using the Seemingly Unrelated Re- gression Estimation were applied to model each parameter. The results indicated that the three methods successfully predicted girth size distributions within the sample stands. The method of moments was the best one with lowest values of Reynolds error index and Kolmogorov-Smirnov statistic however the syl- vicultural regimes. The Weibull parameter distribution model developed for each of the two sylvicultural regimes was quite reliable. Keywords: Weibull; Parameter Recovery Method; Reynolds Index; Sylvicultural Regime; Poles; Logs Introduction The multipurpose management of small woodlots by small- holder forestry has been gaining more importance (Harrison et al., 2002). The growing of the demand for forest products (Scheer, 2004) explained the importance of their management mainly for the smallholder farmer to generate substantial in- come (Aoudji et al., 2012). Teak (Tectona grandis L.f.) is the most important reforestation and commercial plant species in coastal West Africa due to its fast growing potential (Niskane, 1998), good-quality timber (Louppe, 2008). Reforestation with this specie has increased the above ground biomass and carbon stock at 10-year-old about 45% higher than a nearby degraded secondary forest (Odiwe et al., 2012). In Benin, the success of state-owned plantations has encouraged farmers to invest in teak sylviculture, establishing plantations on small plots rang- ing from 0.05 ha to 28.10 ha (Atindogbé, 2012). Various prob- lems constrain both traders and smallholder farmers (Aoudji et al., 2012). These include the lack of market information, high transaction costs, difficulties for traders to get timber supplies (Anyonge and Roshetko, 2003; Nawir et al., 2007), and the low return to smallholder farmers (Maldonado & Louppe, 1999; Nawir et al., 2007). According to the above problems, efforts were needed to have information on the different classes of the merchants products on stand before harvesting. Forest owners and managers have no reliable tools to provide them with a comprehensive scheme of resources available and monitoring, harvesting and sales operations. Therefore, one challenge is to determine the minimum level of information required to char- acterize harvests (Lafond et al., 2012). Stand tables for total or marketable volume are based on the distribution of tree diameters using traditionally probability density functions (PDFs) (Parresol et al., 2010). Many func- tions have been suggested for establishing tree diameters size class distribution (e.g., normal, exponential, beta, Johnson’s B S, Gamma, Weibull, logit-logistic). However, the Weibull function appears the most often used (Little, 1983; Rennolls et al., 1985; Rondeux et al., 1992; Lindsay et al., 1996; Liu et al., 2004; Newton & Amponsah, 2005; Lei, 2008) owing to its flexibility (Hafley & Schreuder, 1977; Kilkki et al., 1989) and the best description of diameter structure. This function can also model many types of failure rate behaviors when appropri- ate parameters are included. Many techniques for estimating Weibull function parameters have been developed: the graphical methods and the analytical methods. The accuracy of the estimate depends on the size of the sample and the method used. Graphical methods tend to provide crude estimates, while analytical methods provide bet- ter estimates that include confidence limits (Murthy et al., 2004) and are reported to be more accurate (Razali et al., 2009). The common analytical methods are the method of moments (MOM), *Corresponding author. 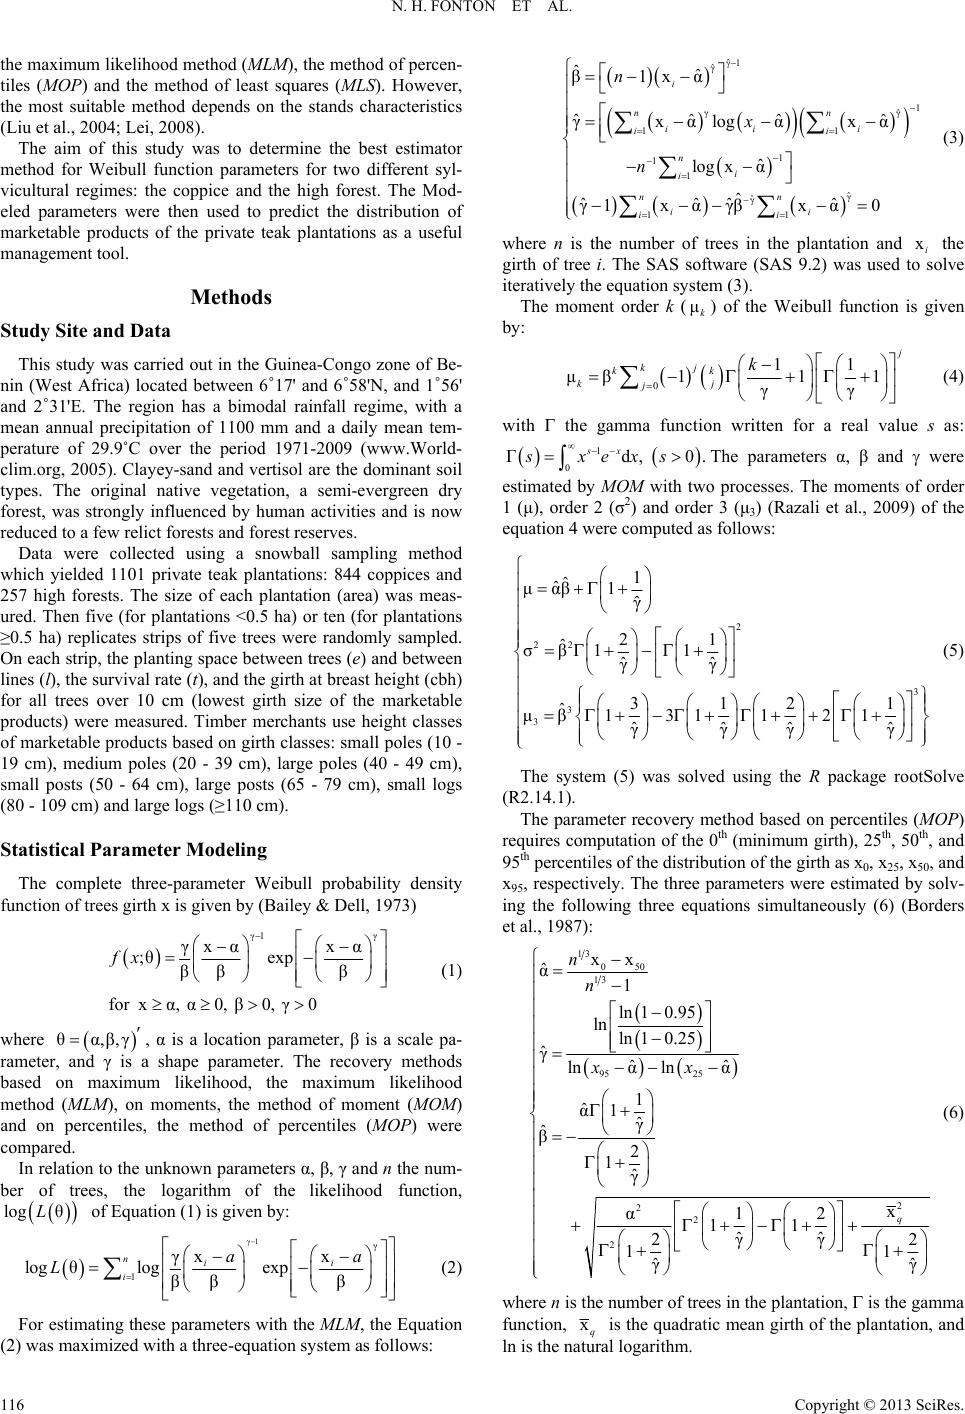 N. H. FONTON ET AL. the maximum likelihood method (MLM), the method of percen- tiles (MOP) and the method of least squares (MLS). However, the most suitable method depends on the stands characteristics (Liu et al., 2004; Lei, 2008). The aim of this study was to determine the best estimator method for Weibull function parameters for two different syl- vicultural regimes: the coppice and the high forest. The Mod- eled parameters were then used to predict the distribution of marketable products of the private teak plantations as a useful management tool. Methods Study Site and Data This study was carried out in the Guinea-Congo zone of Be- nin (West Africa) located between 6˚17' and 6˚58'N, and 1˚56' and 2˚31'E. The region has a bimodal rainfall regime, with a mean annual precipitation of 1100 mm and a daily mean tem- perature of 29.9˚C over the period 1971-2009 (www.World- clim.org, 2005). Clayey-sand and vertisol are the dominant soil types. The original native vegetation, a semi-evergreen dry forest, was strongly influenced by human activities and is now reduced to a few relict forests and forest reserves. Data were collected using a snowball sampling method which yielded 1101 private teak plantations: 844 coppices and 257 high forests. The size of each plantation (area) was meas- ured. Then five (for plantations <0.5 ha) or ten (for plantations ≥0.5 ha) replicates strips of five trees were randomly sampled. On each strip, the planting space between trees (e) and between lines (l), the survival rate (t), and the girth at breast height (cbh) for all trees over 10 cm (lowest girth size of the marketable products) were measured. Timber merchants use height classes of marketable products based on girth classes: small poles (10 - 19 cm), medium poles (20 - 39 cm), large poles (40 - 49 cm), small posts (50 - 64 cm), large posts (65 - 79 cm), small logs (80 - 109 cm) and large logs (≥110 cm). Statistical Parameter Modeling The complete three-parameter Weibull probability density function of trees girth x is given by (Bailey & Dell, 1973) γ1γ γxαxα ;θexp ββ β for xα, α0, β0, γ0 fx (1) where , α is a location parameter, β is a scale pa- rameter, and γ is a shape parameter. The recovery methods based on maximum likelihood, the maximum likelihood method (MLM), on moments, the method of moment (MOM) and on percentiles, the method of percentiles (MOP) were compared. θα,β,γ In relation to the unknown parameters α, β, γ and n the num- ber of trees, the logarithm of the likelihood function, of Equation (1) is given by: log θL γ1γ 1 γxx log θlog exp ββ β nii i aa L (2) For estimating these parameters with the MLM, the Equation (2) was maximized with a three-equation system as follows: ˆ γ1 ˆ γ 1 ˆ γγ 11 1 1 1 ˆ γ ˆ γ 11 ˆˆ β1x α ˆˆˆ ˆ γxαlog αxα ˆ log xα ˆ ˆˆ ˆˆ γ1xαγβ xα0 i nn ii i ii n i i nn ii ii n x n (3) where n is the number of trees in the plantation and the girth of tree i. The SAS software (SAS 9.2) was used to solve iteratively the equation system (3). xi The moment order k (μ) of the Weibull function is given by: k 0 11 μβ 11 γγ 1 j kj kk kj j k (4) with the gamma function written for a real value s as: 1 0 Γd, 0. sx sxexs The parameters α, β and were estimated by MOM with two processes. The moments of order 1 (μ), order 2 (σ2) and order 3 (μ3) (Razali et al., 2009) of the equation 4 were computed as follows: 2 22 3 3 3 1 ˆ ˆ μαβ 1ˆ γ 21 ˆ σβ11 ˆˆ γγ 312 1 ˆ μβ 131 121 ˆˆˆ ˆ γγγγ (5) The system (5) was solved using the R package rootSolve (R2.14.1). The parameter recovery method based on percentiles (MOP) requires computation of the 0th (minimum girth), 25th, 50th, and 95th percentiles of the distribution of the girth as x0, x25, x50, and x95, respectively. The three parameters were estimated by solv- ing the following three equations simultaneously (6) (Borders et al., 1987): 13 050 13 95 25 2 2 2 xx ˆ α1 ln 10.95 ln ln 10.25 ˆ γˆˆ ln αln α 1 ˆ α1ˆ γ ˆ β2 1ˆ γ x α12 11 ˆˆ γγ 22 211 ˆˆ γ γ q n n xx (6) where n is the number of trees in the plantation, is the gamma function, xq is the quadratic mean girth of the plantation, and ln is the natural logarithm. Copyright © 2013 SciRes. 116 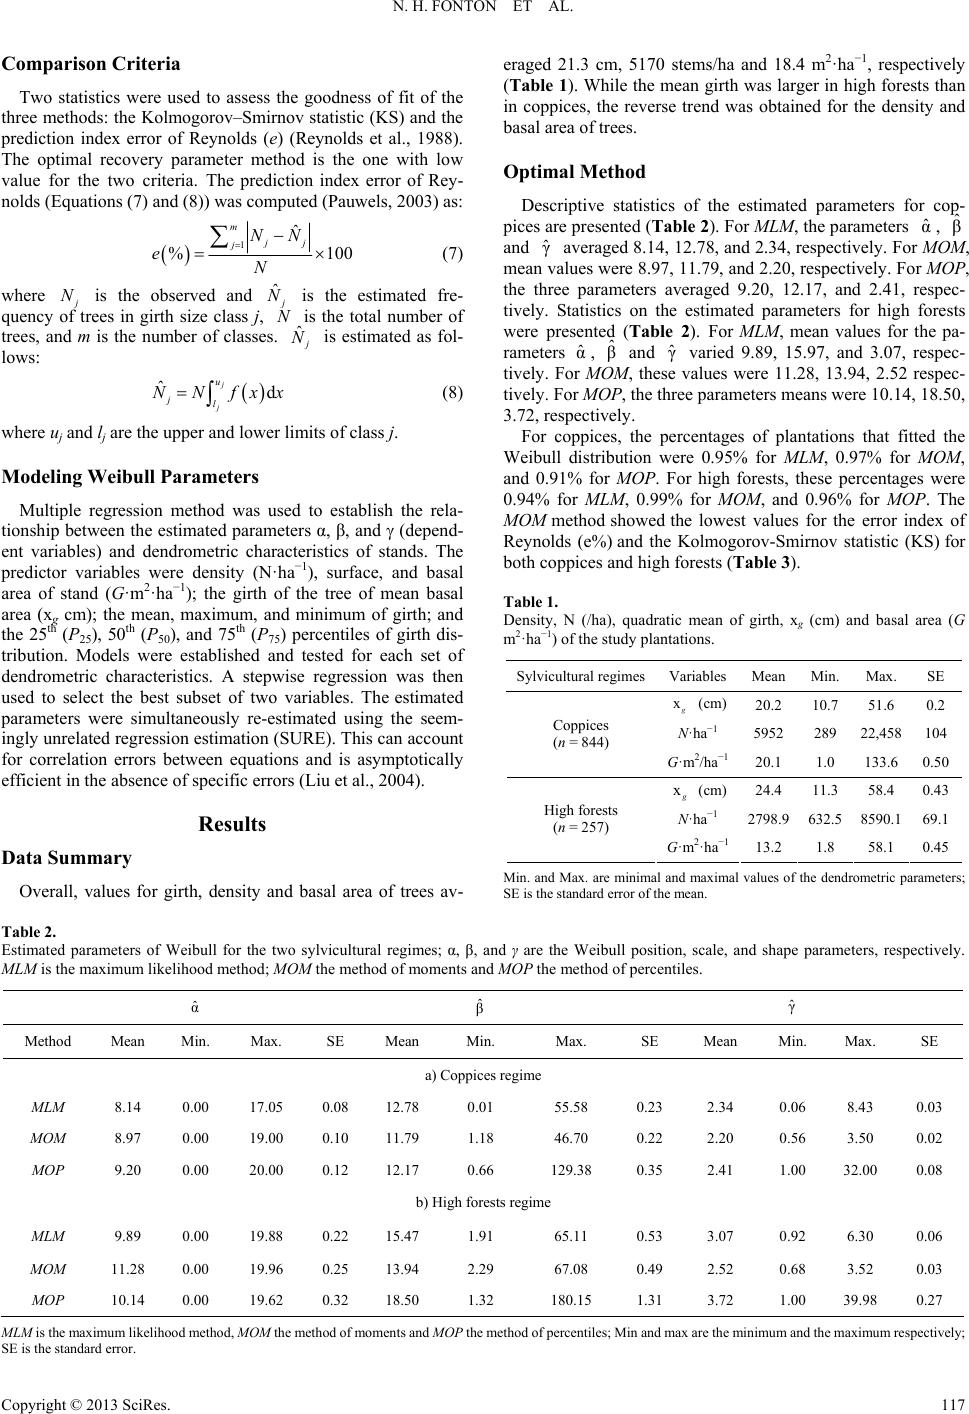 N. H. FONTON ET AL. Copyright © 2013 SciRes. 117 d to assess the goodness of fit of the th Comparison Criteria eraged 21.3 cm, 5170 stems/ha and 18.4 m2·ha−1, respectively (Table 1). While the mean girth was larger in high forests than in coppices, the reverse trend was obtained for the density and basal area of trees. Two statistics were use ree methods: the Kolmogorov–Smirnov statistic (KS) and the prediction index error of Reynolds (e) (Reynolds et al., 1988). The optimal recovery parameter method is the one with low value for the two criteria. The prediction index error of Rey- nolds (Equations (7) and (8)) was computed (Pauwels, 2003) as: Optimal Method Descriptive statistics of the estimated parameters for cop- pices are presented (Table 2). For MLM, the parameters , and ˆ αˆ β ˆ γ averaged 8.14, 12.78, and 2.34, respectively. For MOM, mean values were 8.97, 11.79, and 2.20, respectively. For MOP, the three parameters averaged 9.20, 12.17, and 2.41, respec- tively. Statistics on the estimated parameters for high forests were presented (Table 2). For MLM, mean values for the pa- rameters , and ˆ αˆ βˆ γ varied 9.89, 15.97, and 3.07, respec- tively. For MOM, these values were 11.28, 13.94, 2.52 respec- tively. For MOP, the three parameters means were 10.14, 18.50, 3.72, respectively. 1 ˆ mNN %100 jj j eN (7) where is the observed and ˆ j N j N is the estimated fre- quencytrees in girth size class j, of N is the total number of trees, and m is the number of classesˆ . j N is estimated as fol- lows: ˆd j j u jl NNfxx (8) where uj and lj are the upper and lower limits of class j. Modeling Weibull Parameters sed to establish the rela- tio Results Data Summary , density and basal area of trees av- For coppices, the percentages of plantations that fitted the Weibull distribution were 0.95% for MLM, 0.97% for MOM, and 0.91% for MOP. For high forests, these percentages were 0.94% for MLM, 0.99% for MOM, and 0.96% for MOP. The MOM method showed the lowest values for the error index of Reynolds (e%) and the Kolmogorov-Smirnov statistic (KS) for both coppices and high forests (Table 3). Multiple regression method was u nship between the estimated parameters α, β, and (depend- ent variables) and dendrometric characteristics of stands. The predictor variables were density (N·ha−1), surface, and basal area of stand (G·m2·ha−1); the girth of the tree of mean basal area (xg cm); the mean, maximum, and minimum of girth; and the 25th (P25), 50th (P50), and 75th (P75) percentiles of girth dis- tribution. Models were established and tested for each set of dendrometric characteristics. A stepwise regression was then used to select the best subset of two variables. The estimated parameters were simultaneously re-estimated using the seem- ingly unrelated regression estimation (SURE). This can account for correlation errors between equations and is asymptotically efficient in the absence of specific errors (Liu et al., 2004). Table 1. Density, N (/ha), quadratic mean of girth, xg (cm) and basal area (G m2·ha−1) of the study plantations. Sylvicultural regimesVariablesMean Min. Max.SE x g (cm)20.2 10.7 51.60.2 N·ha−1 5952 289 22,458104 Coppices (n = 844) G·m2/ha−120.1 1.0 133.60.50 xg (cm)24.4 11.3 58.40.43 N·ha−1 2798.9 632.5 8590.169.1 High forests (n = 257) G·m2·ha−1 13.2 1.8 58.10.45 Min. and Max. are minimal and maximal values of the dendrometric parameters; SE is the standard error of the mean. Overall, values for girth able 2. parameters of Weibull for the two sylvicultural regimes; α, β, and γ are the Weibull position, scale, and shape parameters, respectively. T Estimated MLM is the maximum likelihood method; MOM the method of moments and MOP the method of percentiles. ˆ ˆ α β ˆ γ MeMan Min. Mx. SE Mean MiMx. SE Men Min. Mx. SE thod ean. aaa a) Coppicgime es re MLM 8.14 0.00 17.05 0.08 12.78 0.01 55.58 0.23 2.34 0.06 8.43 0.03 High regim MLM 9.89 0.00 19.88 0.22 15.4765.11 0.53 3.07 0.92 6.30 0.06 11.2 0.00 MOM 8.97 0.00 19.00 0.10 11.79 1.18 46.70 0.22 2.20 0.56 3.50 0.02 MOP 9.20 0.00 20.00 0.12 12.17 0.66 129.38 0.35 2.41 1.00 32.00 0.08 b) forestse 1.91 MOM 819.96 0.25 13.94 2.29 67.08 0.49 2.52 0.68 3.52 0.03 MOP 10.14 0.00 19.62 0.32 18.50 1.32 180.15 1.31 3.72 1.00 39.98 0.27 MLM aximihoood, Mmeth omMOP thod of s; Miax arinimuhe m resy; SE is the standard error. is the mum likeld methOM the od of ments and the mepercentilen and me the mm and taximumpectivel 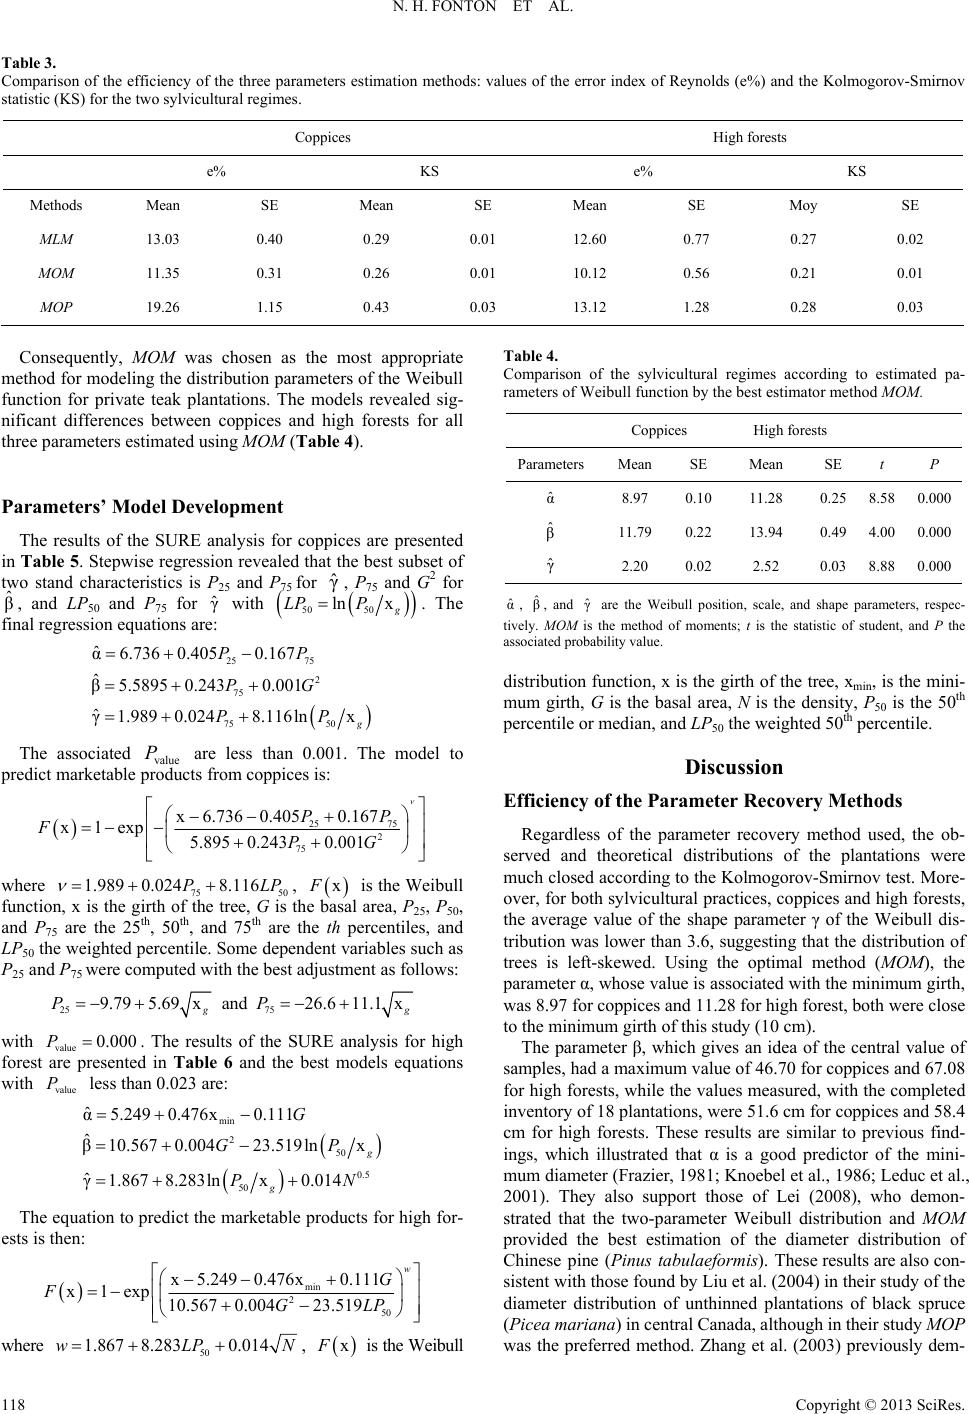 N. H. FONTON ET AL. Table 3. Comparison of the efficiency of the three parameters estimation methods: values of the error index of Reynolds (e%) and the Kolmogorov-Smirnov es High forests statistic (KS) for the two sylvicultural regimes. Coppic e% KS e% KS Metds Mean SE Mean SE Mean SE Moy SE ho MLM 13.03 0.40 0.29 0.01 12.60 0.77 0.27 0.02 MOM 11.35 0.31 0.26 0.01 10.12 0.56 0.21 0.01 MOP 19.26 1.15 0.43 0.03 13.12 1.28 0.28 0.03 Consequently, MOM was chosen as the most appropriate arameters’ Model Development oppices are presented in method for modeling the distribution parameters of the Weibull function for private teak plantations. The models revealed sig- nificant differences between coppices and high forests for all three parameters estimated using MOM (Table 4). P The results of the SURE analysis for c Table 5. Stepwise regression revealed that the best subset of two stand characteristics is P25 and P75 for ˆ γ, P75 and G2 for ˆ β, and LP50 and P75 for ˆ γ with 50 50 ln xg LP P. The f nal regression equations are: i 25 75 2 75 75 50 ˆ α6.736 0.4050.167 ˆ β5.58950.2430.001 ˆ γ1.989 0.0248.116lnx g P P PG PP The associated are less than 0.001. The model to pr value P roduedict marketable pcts from coppices is: 25 75 2 75 x 6.736 0.4050.167P x1 exp5.8950.2430.001 P FPG where 75 50 1.989 0.0248.116PLP , n, x is the girth of the tree, G is xF e basa is the Weibull th thth functio thl area, P25, P50, and P75 are the 25, 50, and 75 are the th percentiles, and LP50 the weighted percentile. Some dependent variables such as P25 and P75 were computed with the best adjustment as follows: 25 75 9.795.69x and 26.611.1x g g PP with The results of the SURE analysis f high value 0.000P. are presented or forest in Table 6 and the best models equations with value P less than 0.023 are: min ˆ α5.249 0.476x 2 50 0.5 50 0.111 ˆ β10.567 0.00423.519lnx ˆ γ1.8678.283lnx0.014 g g G GP PN The equation to predict the marketable products for high for- es ts is then: min 2 50 x 5.249 0.476x0.111 x1exp 10.567 0.00423.519 w G FGLP where 50 1.867 8.2830.014wLPN xF i , s the Weibull Table 4. Comparison of the sylvicultural regimes according to estimated pa- rameters of Weibull function by the best estimator method MOM. Coppices High forests Param t P eters Mean SE Mean SE ˆ α 8.97 0.10 11.28 0.25 8.580.000 ˆ β 11.79 0.2213.94 0.49 4.000.000 ˆ γ 2.20 0.020. 02.52 0.03 8.8800 ˆ α, ˆ β, and ˆ γ are the Weibuition,shape parters, respec- tively. M is thed ofents; statis ae associatedrobabilit. distribution func is min e m mum gth, G isas, Ne de th percentile or median, and LP50 the weighted 50 percentile. fficiency of the Parameter Recovery Methods e irn over, for both sylvicultuppices and high forests, the average value of the γ of the Weibull dis- of tr ll pos scale, and ame OM p metho y value momt is the stic of tudent,nd P th tion, xthe girth of the tree, x, is thini- ir the bal area is thnsity, th P50 is the 50 Discussion E Regardless of the parameter recovery method used, the ob- served and theoretical distributions of the plantations wer much closed according to the Kolmogorov-Smov test. More- ral practices, co shape parameter tribution was lower than 3.6, suggesting that the distribution ees is left-skewed. Using the optimal method (MOM), the parameter α, whose value is associated with the minimum girth, was 8.97 for coppices and 11.28 for high forest, both were close to the minimum girth of this study (10 cm). The parameter β, which gives an idea of the central value of samples, had a maximum value of 46.70 for coppices and 67.08 for high forests, while the values measured, with the completed inventory of 18 plantations, were 51.6 cm for coppices and 58.4 cm for high forests. These results are similar to previous find- ings, which illustrated that α is a good predictor of the mini- mum diameter (Frazier, 1981; Knoebel et al., 1986; Leduc et al., 2001). They also support those of Lei (2008), who demon- strated that the two-parameter Weibull distribution and MOM provided the best estimation of the diameter distribution of Chinese pine (Pinus tabulaeformis). These results are also con- sistent with those found by Liu et al. (2004) in their study of the diameter distribution of unthinned plantations of black spruce (Picea mariana) in central Canada, although in their study MOP was the preferred method. Zhang et al. (2003) previously dem- Copyright © 2013 SciRes. 118 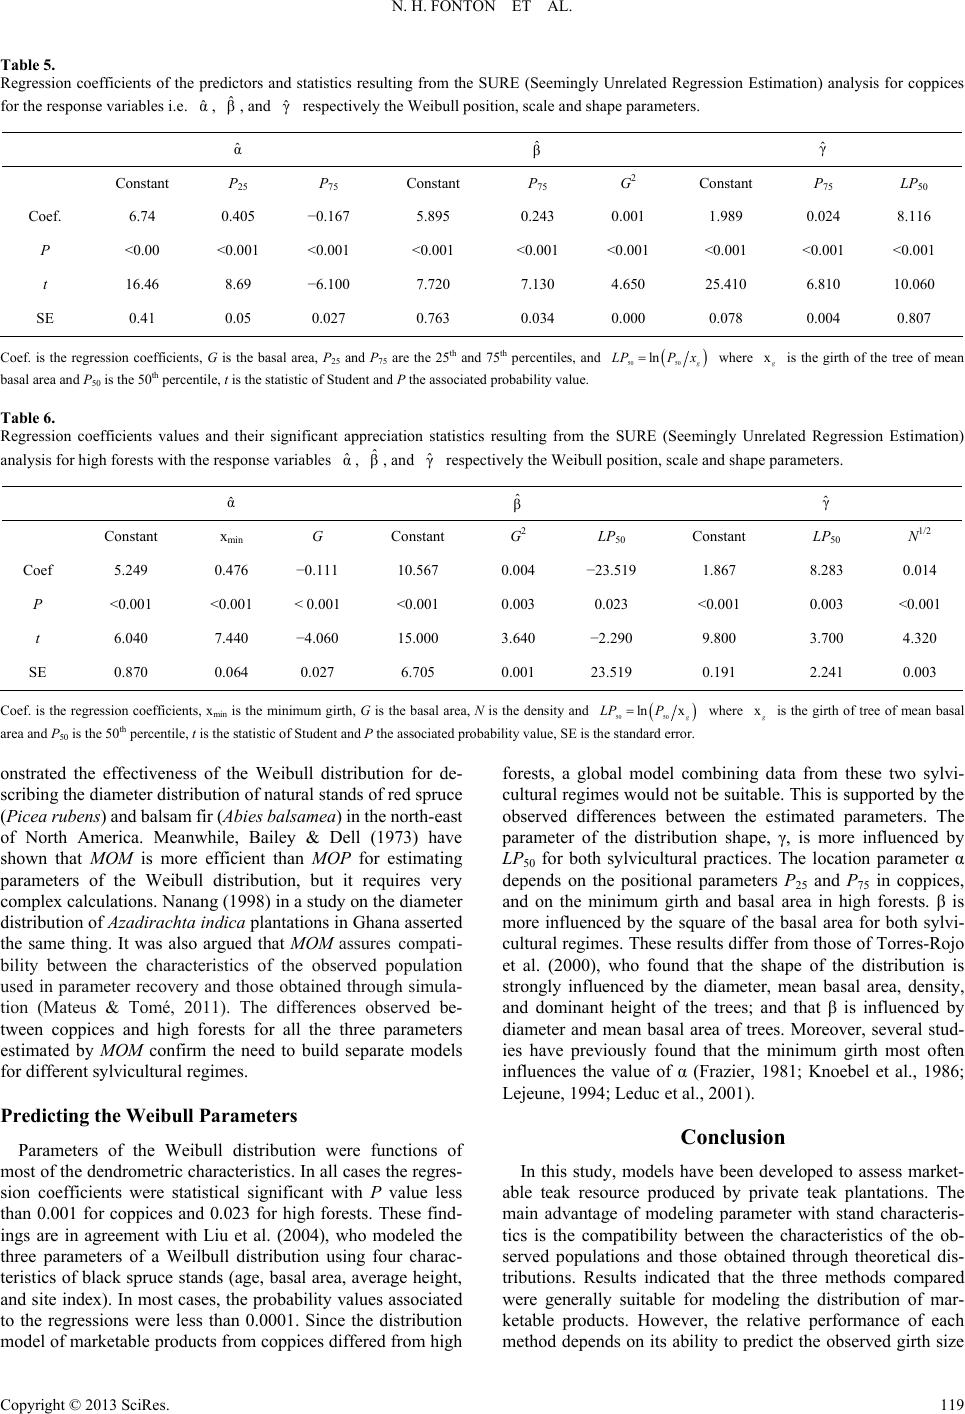 N. H. FONTON ET AL. Table 5. Regression coefficients of the predictors and statistics resulting from the RE (Seemingly Unrelated Regression Estimation) analysis for coppices for the response variables i.e. ˆ α, ˆ β, and ˆ γ respectively the Weibull position, scale and shape parameters. SU ˆ α ˆ β ˆ γ Constant 25 P75 Constant P75 G2 CPonstant P75 LP50 Coef. 6.74 0.405 −0.167 5.895 0.243 0.001 1.989 0.02 8.116 P <0.00 <0.001 <0.001 <0.001 <0.001 <0.001 <0.001 <0.001 <0.001 t 16.46 8.69 −6.100 7.720 7.130 4.650 25.410 6.810 10.060 SE 0.41 0.05 0.027 0.763 0.034 0.000 0.078 0.004 0.807 4 Coef. is the regressioients, G ard P75 are 75th ps, and n coefficis the basal ea, P25 an the 25th andercentile 50 lnLP 50 g P xis ean basal arnd P50 is thercentile, tstatistic of Snt and P the associated proba Table 6. SURE (Seemi where xg the girth of the tree of m ea ae 50th p is the tudebility value. Regression coefficients values and their significant appreciation statistics resulting from thengly Unrelated Regression Estimation) analysis for high forests with the response variables ˆ α, ˆ β, and ˆ γ respectively the Weibull position, scale and shape parameters. ˆ α ˆ β ˆ γ Constant xmin G Consnt G2 LP50 Constant LP50 1/2 ta N Coef 5.249 0.476 −0.111 10.567 0.004 −23.519 1.867 8.280.014 P <0.001 <0.001 < 0.001 <0.001 0.003 0.023 <0.001 0.003 <0.001 SE 3 t 6.040 7.440 −4.060 15.000 3.640 −2.290 9.800 3.700 4.320 0.870 0.064 0.027 6.705 0.001 23.519 0.191 2.241 0.003 Coef.the regressficients, xe minih, G is trea, N is sity and is ion coefmin is thmum girthe basal a the den 50 lnLP n 50 xg P xg is the tree ofsal area aP50 is the 5 t is thistic of S P the ased probabilie, SE is the stadard error. onstrated the effectiveness of the Weibull distribution for de- f North America. Meanwhile, Bailey & Dell (1973) have ribution were functions of cs. In all cases the regres- nt with P value less forests. These find- in forests, a global model combining data from these two sylvi- es would notb e estimated parameters. The parameter of the distribution shape, γ, is more influenced by ed through theoretical dis- tributions. Results indicated that the three methods compared were generally suitablee distribution of mar- ketable products. Howeverformance of each m where girth of mean ba nd 0th percentile,e stattudent andsociatty valu scribing the diameter distribution of natural stands of red spruce (Picea rubens) and balsam fir (Abies balsamea) in the north-east cultural regim be suitale. This is supported by the observed differences between th o shown that MOM is more efficient than MOP for estimating parameters of the Weibull distribution, but it requires very complex calculations. Nanang (1998) in a study on the diameter distribution of Azadirachta indica plantations in Ghana asserted the same thing. It was also argued that MOM assures compati- bility between the characteristics of the observed population used in parameter recovery and those obtained through simula- tion (Mateus & Tomé, 2011). The differences observed be- tween coppices and high forests for all the three parameters estimated by MOM confirm the need to build separate models for different sylvicultural regimes. Predicting the Weibull Parameters Parameters of the Weibull dist most of the dendrometric characteristi sion coefficients were statistical significa than 0.001 for coppices and 0.023 for high gs are in agreement with Liu et al. (2004), who modeled the three parameters of a Weilbull distribution using four charac- teristics of black spruce stands (age, basal area, average height, and site index). In most cases, the probability values associated to the regressions were less than 0.0001. Since the distribution model of marketable products from coppices differed from high LP50 for both sylvicultural practices. The location parameter α depends on the positional parameters P25 and P75 in coppices, and on the minimum girth and basal area in high forests. β is more influenced by the square of the basal area for both sylvi- cultural regimes. These results differ from those of Torres-Rojo et al. (2000), who found that the shape of the distribution is strongly influenced by the diameter, mean basal area, density, and dominant height of the trees; and that β is influenced by diameter and mean basal area of trees. Moreover, several stud- ies have previously found that the minimum girth most often influences the value of α (Frazier, 1981; Knoebel et al., 1986; Lejeune, 1994; Leduc et al., 2001). Conclusion In this study, models have been developed to assess market- able teak resource produced by private teak plantations. The main advantage of modeling parameter with stand characteris- tics is the compatibility between the characteristics of the ob- served populations and those obtain for modeling th er, the relative p ethod depends on its ability to predict the observed girth size Copyright © 2013 SciRes. 119  N. H. FONTON ET AL. class frequencies. The method based on moment (MOM) appears to be the most appropriate. Distribution models for marketable products were developed for coppices and for high forests using stand variables and MOM. Acknowledgements This study was sponsored by the Belgiun “Commission Uni- versitaire pour le Développement (CUD)”—through le Projet Interuniversitaire Ciblé: Contribution au développement d’une filière du teck au départ des forêts privées du Sud-Bénin (Dé- partement de l’Atlantique)”. REFERENCES A L.f.) poles value chain in Southern Benin. Forest Policy and Economics, 15, 98-107. http://dx.doi.org/10.1 nyonge, C. H., & Roshetko, J. M. (2003). Farm-level timber produc- tion: Orienting farmers towards the market. Unasylva, 54, 48-56. Aoudji, A. K. N., Adégbidi, A., Agbo, V., Atindogbé, G., Toyi, M. S. S., Yêvidé, A. S. I., Ganglo, J. C., & Lebailly, P. (2012). Functioning of farm-grown timber value chains: Lessons from the smallholder- produced teak (Tectona grandis 016/j.forpol.2011.10.004 valuation et caractérisa Atindogbé, G. (2012). Etion de la ressource en B Fr meter distribution H teck (Tectona grandis L.f.) dans les plantations privées du Sud-Bénin. Thèse de doctorat, Bénin: Université d’Abomey-Calavi. Bailey, R. L., & Dell, T. R. (1973). Quantifying diameter distributions with Weibull function. Forest Sciences, 19, 97-104. orders, B. E., Souter, R. A., Bailey, R. L., & Ware, K. D. (1987). Per- centile-based distributions characterize forest stand tables. Forest Sciences, 33, 570-576. azier, J. R. (1981). Compatible whole-stand and dia models for loblolly pine stands. Ph.D. Thesis, Blacksburg: Virginia Polytechnic Institute. afley, W. L., & Schreuder, H. T. (1977). Statistical distributions for fitting diameter and height data in even-aged stands. Canadian Jour- nal of Forest Research, 7, 481-487. http://dx.doi.org/10.1139/x77-062 Harrison, S. R., Herbohn, J. L., & Niskanen, A. J. (2002). Non-indus- trial, smallholder, small-scale and family forestry: What’s in a name? Small-Scale Forest Economics. Management and Policy, 1, 1-11. Kilkki, P., & Paivinen, R. (1986). Weibull function in the estimation of the basal area dbh-distribution. Silva Fennica, 20, 149-156. Kilkki, P., Maltamo, M., Mykkanen, R., & Paivinen, R. (1989). Use of the Weibull function in estimating the basal area dbhdistribution. Silva Fennica, 23, 311-318. noebel, B. R., Burkhart, H. E., & Beck,K D. E. (1986). A growth and L yield model for thinned stands of yellow-poplar. Forest Sciences Mo- nograph, 27, 64. afond, V., Cordonnier, T., De Coligny, F., & Courbaud, B. (2012). Reconstructing harvesting diameter distribution from aggregate data. Annals of Forest Science, 69, 235-243. http://dx.doi.org/10.1007/s13595-011-0155-2 Leduc, D. J., Matney, T. G., Belli, K. L., & Baldwin, V. C. (2001). Pre- dicting diameter distributions of longleaf pine plantations: A com- parison between artificial neural networks and other accepted me- thodologies. USDA For Serv Res Pap SRS-25. ei, Y. (2008). Evaluation of three methods for estimating the Weibull L L picéa commun (Picea distribution parameters of Chinese pine (Pinus tabulaeformis). For- est Sciences, 54, 566-571. ejeune, P. (1994). Construction d’un modèle de répartition des arbres par classes de grosseur pour des plantations d’é abies L Karst) en Ardenne belge. Annals of Forest Science, 51, 53- 65. http://dx.doi.org/10.1051/forest:19940104 indsay, S. R., Wood, G. R., & Woollons, R. C. (1996). Stand table modeling through the Weibull distribution and usage of skewness information. Forest Ecology and Management, 81, 19-23. http://dx.doi.org/10.1016/0378-1127(95)03669-5 ittle, S. N. (1983). Weibull diameter distributions for mixed stands of western conifers. Canadian L Journal of Forest Research, 13, 85-88. http://dx.doi.org/10.1139/x83-012 iu, C., Zhang, S. Y., Lei, Y., Newton, P. F., & Zhang, L. (2004). Evaluation of three methods predicting diameter distributions of black spruce (Picea mariana) plantations in ce L ntral. Canadian Jour- nal of Forest Research, 34, 2424-2432. http://dx.doi.org/10.1139/x04-117 ouppe, D. (2008). Tectona grandis (L. f). In D. Louppe, A. Amoako, & M. Brink (Eds.), Ressources végé LA. Oteng- tales de l’Afrique n ys Publishers; Wageningen, Pays- M M the diameter distribution of n’s SB probability density func- Tropicale. Bois d’oeuvre 1. [Traduction de: Plant Resources of Tro- pical Africa. Timbers 1. 2008]. Wageningen, Pays-Bas: Fondatio PROTA; Leiden, Pays-Bas: Backhu Bas: CTA. aldonado, G., & Louppe, D. (1999). Les plantations villageoises de teck en Côte d’Ivoire. Bois et Forêts des Tropiques, 262, 19-30. ateus, A., & Tomé, M. (2011). Modelling eucalyptus plantations with Johnso tion: Parameters recovery from a compatible system of equations to predict stand variables. Annals of Forest Science, 68, 325-335. http://dx.doi.org/10.1007/s13595-011-0037-7 urthy, P. D. N., Xie, M., & Jiang, R. (2004). Weibull models. Wiley series in probability and statistics. Hoboken. M Nanang, D. M. (1998). Suitability of the normal, log-normal and Wei- 7. bull distributions for fitting diameter distributions of neem planta- tions in Northern Ghana. Forest Ecology and Management, 103, 1- http://dx.doi.org/10.1016/S0378-1127(97)00155-2 awir, A. A., Kassa, H., Sandewall, M., Dore, D., Campbell, B., Ohls- son, B., & Bekele, M. (2007). Stimulating smallholder tree plant- ing—Lessons from Africa and Asia. Unasylva, 58, 53-59. ewton, P. F., & Amponsah, I. G. (2005). Evalua N Ntion of Weibull-based structural stand density parameter prediction equation systems for black spruce and jack pine stand types within the context of developing management diagrams. Canadian Journal of Forest Research, 35, 2996-3010. http://dx.doi.org/10.1139/x05-216 iskanen, A. (1998). Financial and economic profitability of reforesta- tion in Thaïland. Forest Ecology and Management, N 104, 57-68. http://dx.doi.org/10.1016/S0378-1127(97)00263-6 diwe, A. F., Adewumi, R. A., Alami, A. A., & Ogunsanwo, O. (2012). Carbon stock in topsoil, standing floor litter and above g O round bio- P ry of the SB distribu- P la decision pour R eibull distribution. Proceed- R R992). Construction d’une 62, 357-370. mass in Tectona grandis plantation 10-years after establishment in Ile-Ife, Southwestern Nigeria. International Journal of Biological and Chemical Sciences, 6, 3006-3016. arresol, B. R., Fonseca, T. F., & Marques, C. P. (2010). Numerical details and SAS programs for parameter recove tion. Forest Service, Southern Research Station, General Technical Report SRS-122, United States Department of Agriculture, 31 p. auwels, D. (2003). Conception d’un systeme d’aide à le choix d’un Scenario sylvicole: Application aux peuplements de mélèze en Région wallonne. Thèse de Doctorat, Gembloux: Faculté Universitaire des Sciences Agronomiques. azali, A. M., Salih, A. A., & Mahdi, A. A. (2009). Best estimate for the parameters of the three parameter W ings of the 5th Asian Mathematical Conference, Malaysia, 2009. ennolls, K., Geary, D. N., & Rollinson, T. J. D. (1985). Characterizing diameter distributions by the use of the Weibull distribution. For- estry, 58, 57-66. Reynolds, M. R., Burk, T. E., & Huang, W. C. (1988). Goodness of fit tests and model selection procedures for diameter distribution models. Forest Sciences, 34, 373-399. ondeux, J., Laurent, C., & Thibaut, A. (1 table de production pour le douglas (Pseudotsuga mensiesii Mirb. Franco) en Belgique. Bulletin des Recherches Agronomiques de Gembloux, 27, 327-347. Scherr, S. J. (2004). Building opportunities for small-farm agroforestry to supply domestic wood markets in developing countries. Agrofor- estry Systems, 61- Lhttp://dx.doi.org/10.1023/B:AGFO.0000029010.97567.2b orres-Rojo, J. M., Magaña, O. S., & Acosta, M. (2000). Metodología para mejorar la predicción de T parámetros de distribuciones diamé- tricas. Agrociencia, 34, 627-637. Copyright © 2013 SciRes. 120  N. H. FONTON ET AL. Copyright © 2013 SciRes. 121 W Z& Liu, C. (2003). A comparison of estima- adian 33, 1340-1347. orldClim (2005). WorldClim Global Climate Data (GIS Data). http://www.worldclim.org/ hang, L., Packard, K. C., tion methods for fitting Weibull and Johnson’s SB distributions to mixed spruce-fir stands in northeastern North America. Can Journal of Forest Research, http://dx.doi.org/10.1139/x03-054 |