

Paper Menu >>
Journal Menu >>
 Energy and Power Engineering, 2013, 5, 474-480 http://dx.doi.org/10.4236/epe.2013.57051 Published Online September 2013 (http://www.scirp.org/journal/epe) Using UPFC and IPFC Devices Located by a Hybrid Meta-Heuristic Approach to Congestion Relief Hamid Iranmanesh*, Masoud Rashidi-Nejad Islamic Azad University, Jiroft Branch, Jiroft, Iran Email: *[email protected] Received March 19, 2013; revised April 19, 2013; accepted April 26, 2013 Copyright © 2013 Hamid Iranmanesh, Masoud Rashidi-Nejad. This is an open access article distributed under the Creative Com- mons Attribution License, which permits unrestricted use, distribution, and reproduction in any medium, provided the original work is properly cited. ABSTRACT This paper proposes new methodology for the placement of FACTS devices in transmission systems to reduce conges- tion. Congestion management comprises congestion relief and congestion cost. The traditional approach to remedying congestion lies in reinforcing the system with additional transmission capacity. Although still feasible, this approach is becoming more and more complex and it is often challenged by the public [1]. Congestion relief can be handled by us- ing FACTS devices, where transmission capability may be improved. Congestion relief using FACTS devices requires a two step approach: first, the optimal location of these devices in the network and then, the settings of their control pa- rameters. UPFC and IPFC have full dynamic control on the transmission parameters, voltage, line impedance and phase angle. Real Genetic Algorithm (RGA) optimization technique is used to solve this congestion relief problem while ana- lytical hierarchy process (AHP) with fuzzy sets is implemented to evaluate RGA fitness function. The results are ob- tained for modified IEEE 5 bus Test System. Keywords: Congestion Relief; RGA; AHP; Fuzzy Sets; UPFC; IPFC 1. Introduction Electricity industry restructuring and reregulation may dictate maximum power transfer using the existing facili- ties under transmission open access scheme. Procuring electricity contracts associated with market participants’ requirements can cause more challenges considering en- ergy management systems. Reregulation will impose new necessities to power systems such as transmission open access as well as non-discrimination access to the infor- mation. Transmission congestion management is an im- portant mechanism in order to solve power transfer bot- tleneck both in the operation and planning horizons [2]. There are two issues with regards to applying transmis- sion open access that should be considered: the so-called transmission losses and transmission congestion. Con- gestion is dependent on the network constraints that may show the ultimate transmission capacity, while it can restrict the concurrent electric power contracts [3]. It can be said that, under congestion conditions the price of transferring electricity will be increased. In fact, congestion management is an overall as well as in par- ticular systematic way of improving electricity transfer in which power systems planning and operating can be re- garded. Transmission congestion is dealing with some restric- tions of electricity transfer via transmission network. These restrictions are increased in the presence of open access considering electricity restructuring environment [4]. Under new conditions of power market, more con- straints such as economical, environmental problems and transmission rights as financial contracts will be added to technical limitations of transmission capacity [2]. Con- gestion relief is such a solution to release some blocked capacity of transmission network. In literature, there are some techniques suggested to increase the available transfer capability (ATC). Among the proposed solutions for ATC enhancement, the use of FACTS devices is re- ported considerably [5]. It can be said that the application of FACTS devices should be based upon the investiga- tion of capital investment as well as operating costs and the impacts of these devices of ATC improvement [6]. On the other hand, the optimum placement of FACTS devices is an important issue in terms of planning hori- zon [5], especially considering different types of these devices. While from operating point of view, the coordi- nation among these devices is much of interest both by *Corresponding author. C opyright © 2013 SciRes. EPE 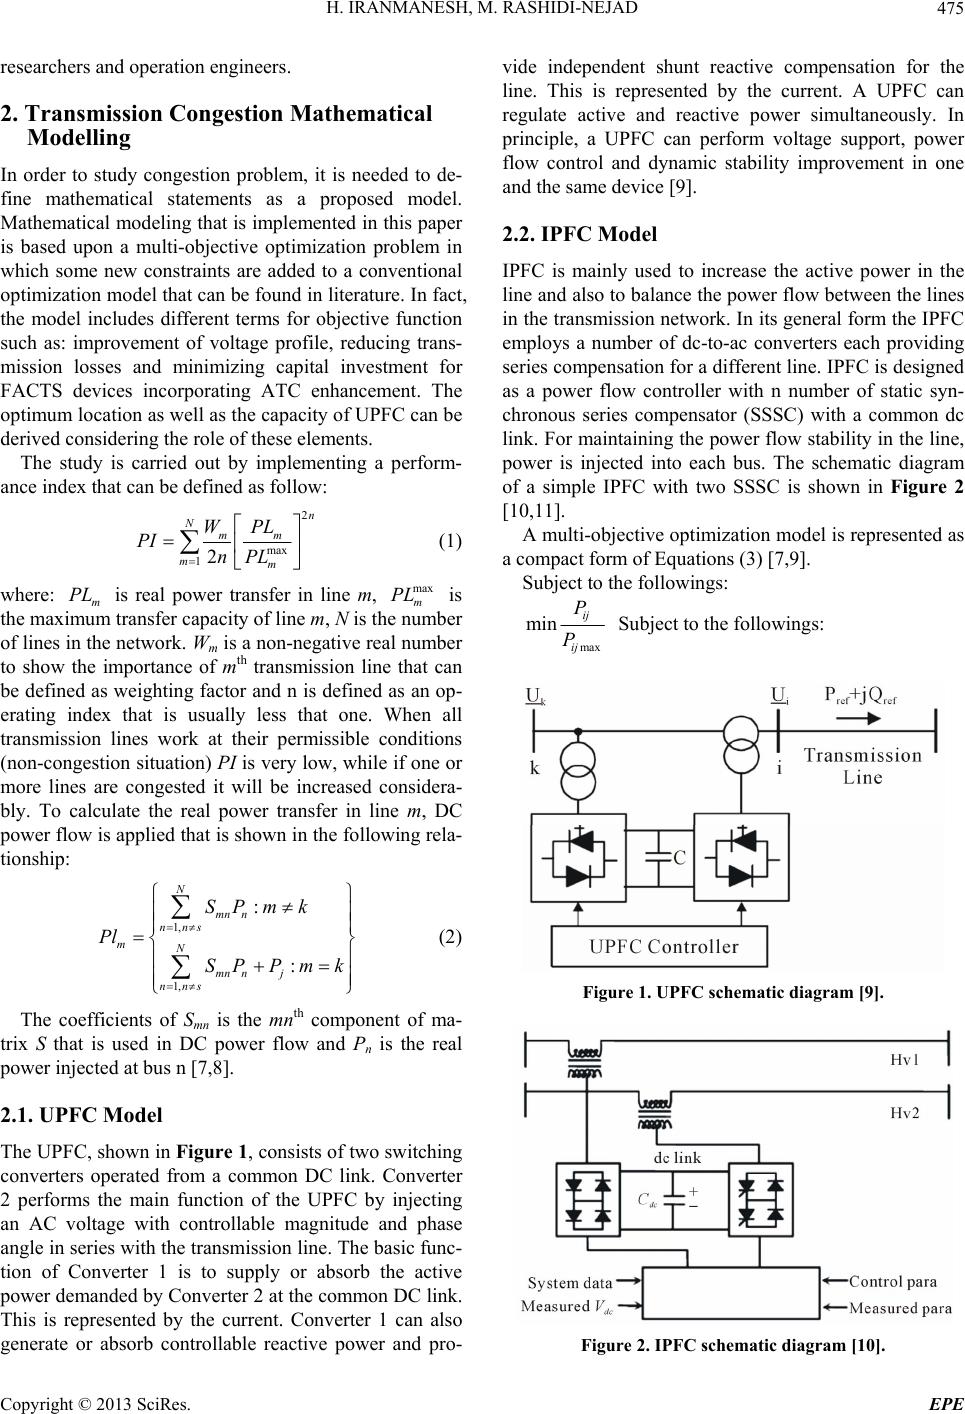 H. IRANMANESH, M. RASHIDI-NEJAD 475 researchers and operation engineers. 2. Transmission Congestion Mathematical Modelling In order to study congestion problem, it is needed to de- fine mathematical statements as a proposed model. Mathematical modeling that is implemented in this paper is based upon a multi-objective optimization problem in which some new constraints are added to a conventional optimization model that can be found in literature. In fact, the model includes different terms for objective function such as: improvement of voltage profile, reducing trans- mission losses and minimizing capital investment for FACTS devices incorporating ATC enhancement. The optimum location as well as the capacity of UPFC can be derived considering the role of these elements. The study is carried out by implementing a perform- ance index that can be defined as follow: 2 max 12 n N mm mm WPL PI nPL (1) where: m is real power transfer in line m, is the maximum transfer capacity of line m, N is the number of lines in the network. Wm is a non-negative real number to show the importance of mth transmission line that can be defined as weighting factor and n is defined as an op- erating index that is usually less that one. When all transmission lines work at their permissible conditions (non-congestion situation) PI is very low, while if one or more lines are congested it will be increased considera- bly. To calculate the real power transfer in line m, DC power flow is applied that is shown in the following rela- tionship: PL max m PL 1, 1, : : N mn n nns mN mn nj nns SPm k Pl SPPm k (2) The coefficients of Smn is the mnth component of ma- trix S that is used in DC power flow and Pn is the real power injected at bus n [7,8]. 2.1. UPFC Model The UPFC, shown in Figure 1, consists of two switching converters operated from a common DC link. Converter 2 performs the main function of the UPFC by injecting an AC voltage with controllable magnitude and phase angle in series with the transmission line. The basic func- tion of Converter 1 is to supply or absorb the active power demanded by Converter 2 at the common DC link. This is represented by the current. Converter 1 can also generate or absorb controllable reactive power and pro- vide independent shunt reactive compensation for the line. This is represented by the current. A UPFC can regulate active and reactive power simultaneously. In principle, a UPFC can perform voltage support, power flow control and dynamic stability improvement in one and the same device [9]. 2.2. IPFC Model IPFC is mainly used to increase the active power in the line and also to balance the power flow between the lines in the transmission network. In its general form the IPFC employs a number of dc-to-ac converters each providing series compensation for a different line. IPFC is designed as a power flow controller with n number of static syn- chronous series compensator (SSSC) with a common dc link. For maintaining the power flow stability in the line, power is injected into each bus. The schematic diagram of a simple IPFC with two SSSC is shown in Figure 2 [10,11]. A multi-objective optimization model is represented as a compact form of Equations (3) [7,9]. Subject to the followings: max min ij ij P P Subject to the followings: Figure 1. UPFC schematic diagram [9]. Figure 2. IPFC schematic diagram [10]. Copyright © 2013 SciRes. EPE 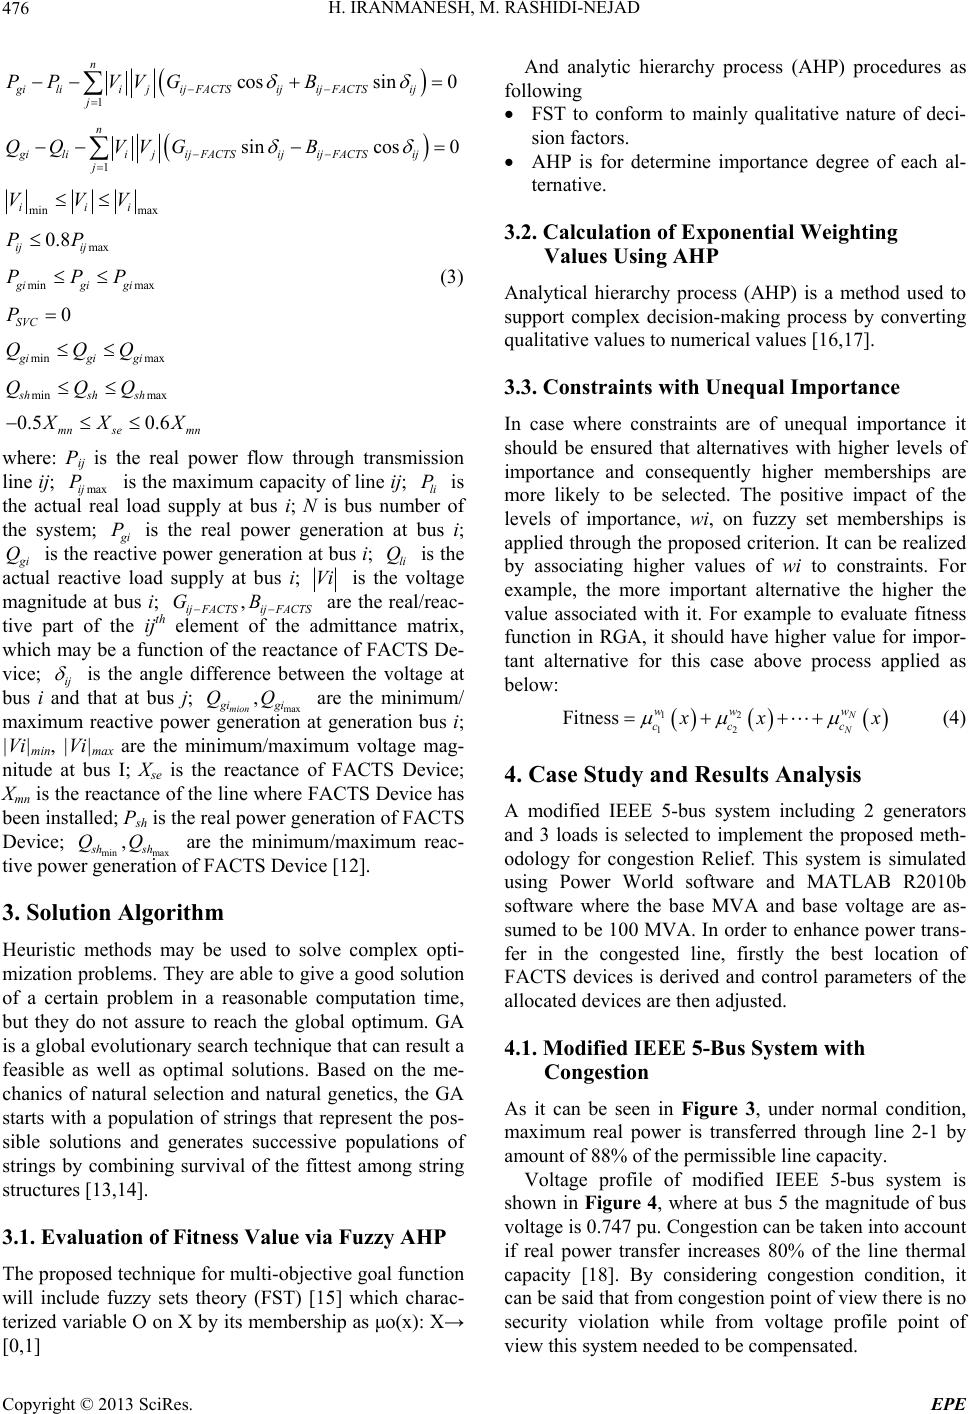 H. IRANMANESH, M. RASHIDI-NEJAD 476 1 cossin 0 n giliijijFACTSijij FACTSij j PP VVGB 1 sincos 0 n giliijijFACTSijij FACTSij j QQ VVGB min max iii VVV max 0.8 ij ij PP min maxgigi gi PPP (3) 0 SVC P min maxgigi gi QQQ min maxshsh sh QQQ 0.5 0.6 mn semn X XX where: Pij is the real power flow through transmission line ij; is the maximum capacity of line ij; is the actual real load supply at bus i; N is bus number of the system; maxij Pli P g i P is the real power generation at bus i; g i Q is the reactive power generation at bus i; is the actual reactive load supply at bus i; li Q Vi is the voltage magnitude at bus i; are the real/reac- tive part of the ijth element of the admittance matrix, which may be a function of the reactance of FACTS De- vice; , ij FACTSij FACTS GB ij is the angle difference between the voltage at bus i and that at bus j; max are the minimum/ maximum reactive power generation at generation bus i; |Vi|min, |Vi|max are the minimum/maximum voltage mag- nitude at bus I; Xse is the reactance of FACTS Device; Xmn is the reactance of the line where FACTS Device has been installed; Psh is the real power generation of FACTS Device; minmax are the minimum/maximum reac- tive power generation of FACTS Device [12]. , mion gi gi QQ ,QQ sh sh 3. Solution Algorithm Heuristic methods may be used to solve complex opti- mization problems. They are able to give a good solution of a certain problem in a reasonable computation time, but they do not assure to reach the global optimum. GA is a global evolutionary search technique that can result a feasible as well as optimal solutions. Based on the me- chanics of natural selection and natural genetics, the GA starts with a population of strings that represent the pos- sible solutions and generates successive populations of strings by combining survival of the fittest among string structures [13,14]. 3.1. Evaluation of Fitness Value via Fuzzy AHP The proposed technique for multi-objective goal function will include fuzzy sets theory (FST) [15] which charac- terized variable O on X by its membership as μo(x): X→ And [0,1] analytic hierarchy process (AHP) procedures as fo nform to mainly qualitative nature of deci- etermine importance degree of each al- 3.2. Calculation of Exponential Weighting Anas (AHP) is a method used to 3.3. Constraints with Unequal Importance ance it llowing FST to co sion factors. AHP is for d ternative. Values Using AHP lytical hierarchy proces support complex decision-making process by converting qualitative values to numerical values [16,17]. In case where constraints are of unequal import should be ensured that alternatives with higher levels of importance and consequently higher memberships are more likely to be selected. The positive impact of the levels of importance, wi, on fuzzy set memberships is applied through the proposed criterion. It can be realized by associating higher values of wi to constraints. For example, the more important alternative the higher the value associated with it. For example to evaluate fitness function in RGA, it should have higher value for impor- tant alternative for this case above process applied as below: 12 12 itness N N w ww cc c F x xx (4) 4. Case Study and Results Analysis generators 4.1. Modified IEEE 5-Bus System with As iin Figure 3, under normal condition, stem is sh A modified IEEE 5-bus system including 2 and 3 loads is selected to implement the proposed meth- odology for congestion Relief. This system is simulated using Power World software and MATLAB R2010b software where the base MVA and base voltage are as- sumed to be 100 MVA. In order to enhance power trans- fer in the congested line, firstly the best location of FACTS devices is derived and control parameters of the allocated devices are then adjusted. Congestion t can be seen maximum real power is transferred through line 2-1 by amount of 88% of the permissible line capacity. Voltage profile of modified IEEE 5-bus sy own in Figure 4, where at bus 5 the magnitude of bus voltage is 0.747 pu. Congestion can be taken into account if real power transfer increases 80% of the line thermal capacity [18]. By considering congestion condition, it can be said that from congestion point of view there is no security violation while from voltage profile point of view this system needed to be compensated. Copyright © 2013 SciRes. EPE  H. IRANMANESH, M. RASHIDI-NEJAD 477 Figure 3. Modified IEEE 5-Bus system with congestion. Figure 4. Buses voltage profile. 4.2. Voltage Profile Improvement and FC In th volt- FC is assumed as any compensation, the electrical sy ng mini- m 21 Congestion Relief Using UPFCor IP is case goal function includes three objectives: age profile, Congestion value and loss. Optimization process tries to relief congestion besides improving volt- age profile considering less loss. Multi-objective optimi- zation is handled via fuzzyfying objective function terms. In this respect, membership functions of objective terms are needed to be defined. Typical membership function for voltage of each bus is depicted in Figure 5, while Figure 6 shows congestion membership. The membership of loss for UPFC or IP shown in Figure 7. First of all without stem is studied in order to determine the power flow in each of the transmission line and the bus voltages. The power flow results and voltage profile without FACTS Devices are given in Appendix 1 and Figure 4. In fact, congestion should be relived satisfyi um loss of UPFC or IPFC while reaching best voltage profile. Moreover, considering AHP criterion, priority factors of objective terms should be derived. It is as- sumed that congestion is very strong important than voltage profile, while it is absolutely important than the costs of FACTS devices. It can be interpreted that: P12 = 7, P = 1 , P = 9, P = 713 31 1 9 st prle is highly more impor- ta Theatement “voltageofi nt than costs of UPFC or IPFC “indicates: 0 0.2 0.4 0.6 0.8 1 hip 0.80.850.9 0.9511.05 Voltage(pu) Degr e e of Membe r s Figure 5. Membership of bus voltages. 0 0.1 0.2 0.3 0.4 0.5 0.6 0.7 0.8 0.9 1 00.511.522.5 Congestion Degree of Membership 3 Figure 6. Membership of congestion value. 0 0.1 0.2 0.3 0.4 0.5 0.6 0.7 0.8 0.9 1 0123 Loss Value Degree of Membership 4 Figure 7. Membership of active power loss. 23 32 5, 15PP The following weighting (W) ver is obtained via so cto me matrix manipulations. 0.973370.218WE 670.068775 nT Fitness value of RGA can be evaluated using Fuzzy-AHP as: 3 12 12 fitness of RGA for ea 3 Fitness( )( )( ) w ww CxCxCx where Ci is the i is membership of ith alternative and W exponential weight of ith alternative. This procedure can determine the ch chromosome considering the importance of each constraint as well as objective term. Implementing RGA with the recombination rate of 76%, mutation rate of 3% and regeneration of 21% considering ellipsis is applied as it is depicted in Figures 8 and 9. These figures show the best solution for UPFC is obtained after 68 generation. It Copyright © 2013 SciRes. EPE 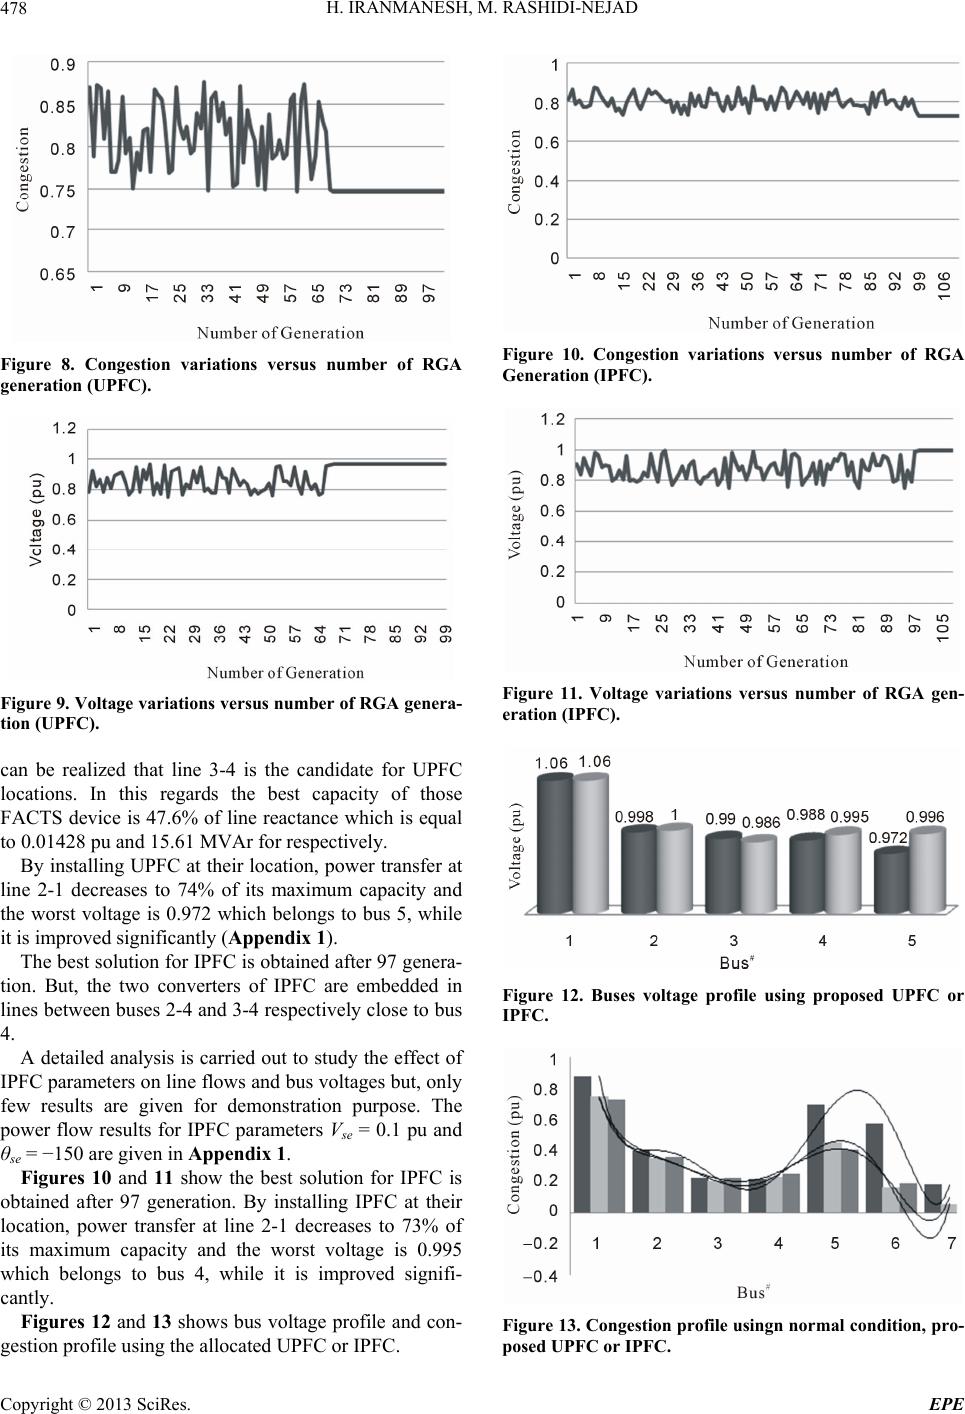 H. IRANMANESH, M. RASHIDI-NEJAD 478 Figure 8. Congestion variations versus number of RGA generation (UPFC). Figure 9. Voltage variations versus number of RGA gener an be realized that line 3-4 is the candidate for UPFC nsfer at lin r 97 genera- tio nalysis is carried out to study the effect of IP solution for IPFC is ob es 12 and 13 shows bus voltage profile and con- ge a- tion (UPFC). c locations. In this regards the best capacity of those FACTS device is 47.6% of line reactance which is equal to 0.01428 pu and 15.61 MVAr for respectively. By installing UPFC at their location, power tra e 2-1 decreases to 74% of its maximum capacity and the worst voltage is 0.972 which belongs to bus 5, while it is improved significantly (Appendix 1). The best solution for IPFC is obtained afte n. But, the two converters of IPFC are embedded in lines between buses 2-4 and 3-4 respectively close to bus 4. A detailed a FC parameters on line flows and bus voltages but, only few results are given for demonstration purpose. The power flow results for IPFC parameters Vse = 0.1 pu and θse = −150 are given in Appendix 1. Figures 10 and 11 show the best tained after 97 generation. By installing IPFC at their location, power transfer at line 2-1 decreases to 73% of its maximum capacity and the worst voltage is 0.995 which belongs to bus 4, while it is improved signifi- cantly. Figur stion profile using the allocated UPFC or IPFC. Figure 10. Congestion variations versus number of RGA Generation (IPFC). Figure 11. Voltage variations versus number of RGA gen- eration (IPFC). Figure 12. Buses voltage profile using proposed UPFC or IPFC. Figure 13. Congestion profile usingn normal condition, pro- posed UPFC or IPFC. Copyright © 2013 SciRes. EPE 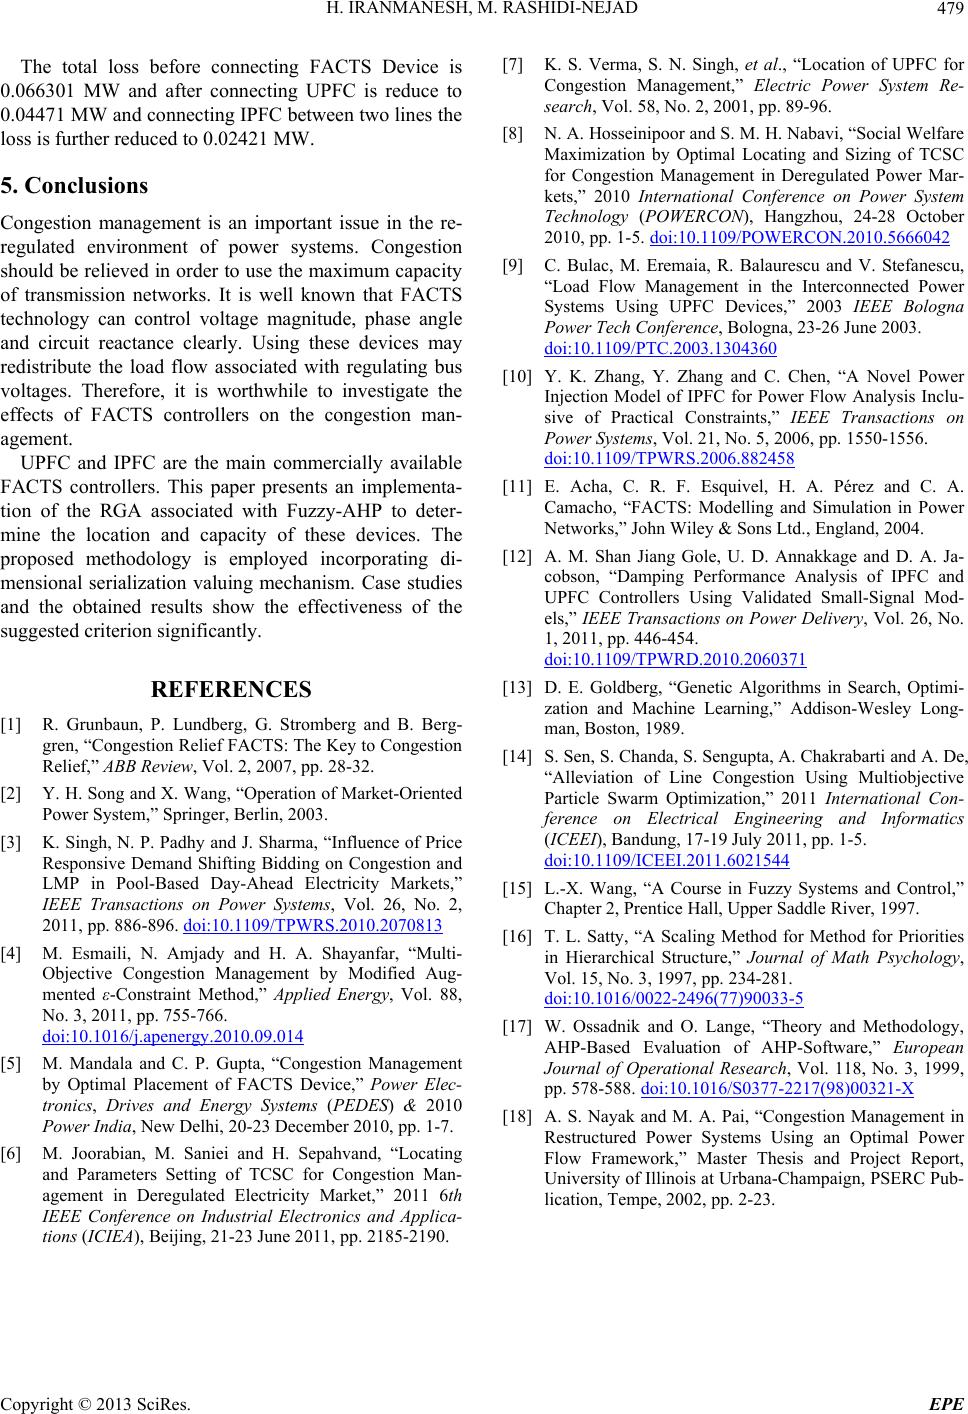 H. IRANMANESH, M. RASHIDI-NEJAD Copyright © 2013 SciRes. EPE 479 re connecting FACTS Dev 0. ment is an important issue in the re- FC are the main commercially available FA [1] R. Grunbaun,berg and B. Berg- t-Oriented nfluence of Price The total loss befoice is 066301 MW and after connecting UPFC is reduce to 0.04471 MW and connecting IPFC between two lines the loss is further reduced to 0.02421 MW. 5. Conclusions Congestion manage regulated environment of power systems. Congestion should be relieved in order to use the maximum capacity of transmission networks. It is well known that FACTS technology can control voltage magnitude, phase angle and circuit reactance clearly. Using these devices may redistribute the load flow associated with regulating bus voltages. Therefore, it is worthwhile to investigate the effects of FACTS controllers on the congestion man- agement. UPFC and IP CTS controllers. This paper presents an implementa- tion of the RGA associated with Fuzzy-AHP to deter- mine the location and capacity of these devices. The proposed methodology is employed incorporating di- mensional serialization valuing mechanism. Case studies and the obtained results show the effectiveness of the suggested criterion significantly. REFERENCES P. Lundberg, G. Strom gren, “Congestion Relief FACTS: The Key to Congestion Relief,” ABB Review, Vol. 2, 2007, pp. 28-32. [2] Y. H. Song and X. Wang, “Operation of Marke Power System,” Springer, Berlin, 2003. [3] K. Singh, N. P. Padhy and J. Sharma, “I Responsive Demand Shifting Bidding on Congestion and LMP in Pool-Based Day-Ahead Electricity Markets,” IEEE Transactions on Power Systems, Vol. 26, No. 2, 2011, pp. 886-896. doi:10.1109/TPWRS.2010.2070813 [4] M. Esmaili, N. Amjady and H. A. Shayanfar, “Multi- Objective Congestion Management by Modified Aug- mented ε-Constraint Method,” Applied Energy, Vol. 88, No. 3, 2011, pp. 755-766. doi:10.1016/j.apenergy.2010.09.014 estion Management [5] M. Mandala and C. P. Gupta, “Cong by Optimal Placement of FACTS Device,” Power Elec- tronics, Drives and Energy Systems (PEDES) & 2010 Power India, New Delhi, 20-23 December 2010, pp. 1-7. [6] M. Joorabian, M. Saniei and H. Sepahvand, “Locating and Parameters Setting of TCSC for Congestion Man- agement in Deregulated Electricity Market,” 2011 6th IEEE Conference on Industrial Electronics and Applica- tions (ICIEA), Beijing, 21-23 June 2011, pp. 2185-2190. [7] K. S. Verma, S. N. Singh, et al., “Location of UPFC for Congestion Management,” Electric Power System Re- search, Vol. 58, No. 2, 2001, pp. 89-96. [8] N. A. Hosseinipoor and S. M. H. Nabavi, “Social Welfare Maximization by Optimal Locating and Sizing of TCSC for Congestion Management in Deregulated Power Mar- kets,” 2010 International Conference on Power System Technology (POWERCON), Hangzhou, 24-28 October 2010, pp. 1-5. doi:10.1109/POWERCON.2010.5666042 [9] C. Bulac, M. Eremaia, R. Balaurescu and V. Stefanescu, “Load Flow Management in the Interconnected Power Systems Using UPFC Devices,” 2003 IEEE Bologna Power Tech Conference, Bologna, 23-26 June 2003. doi:10.1109/PTC.2003.1304360 [10] Y. K. Zhang, Y. Zhang and C. Chen, “A Novel Power Injection Model of IPFC for Power Flow Analysis Inclu- sive of Practical Constraints,” IEEE Transactions on Power Systems, Vol. 21, No. 5, 2006, pp. 1550-1556. doi:10.1109/TPWRS.2006.882458 [11] E. Acha, C. R. F. Esquivel, H. A. Pérez and C. A. Camacho, “FACTS: Modelling and Simulation in Power Networks,” John Wiley & Sons Ltd., England, 2004. [12] A. M. Shan Jiang Gole, U. D. Annakkage and D. A. Ja- cobson, “Damping Performance Analysis of IPFC and UPFC Controllers Using Validated Small-Signal Mod- els,” IEEE Transactions on Power Delivery, Vol. 26, No. 1, 2011, pp. 446-454. doi:10.1109/TPWRD.2010.2060371 [13] D. E. Goldberg, “Genetic Algorithms in Search, Optimi- zation and Machine Learning,” Addison-Wesley Long- man, Boston, 1989. [14] S. Sen, S. Chanda, S. Sengupta, A. Chakrabarti and A. De, “Alleviation of Line Congestion Using Multiobjective Particle Swarm Optimization,” 2011 International Con- ference on Electrical Engineering and Informatics (ICEEI), Bandung, 17-19 July 2011, pp. 1-5. doi:10.1109/ICEEI.2011.6021544 [15] L.-X. Wang, “A Course in Fuzzy Systems and Control,” Chapter 2, Prentice Hall, Upper Saddle River, 1997. [16] T. L. Satty, “A Scaling Method for Method for Priorities in Hierarchical Structure,” Journal of Math Psychology, Vol. 15, No. 3, 1997, pp. 234-281. doi:10.1016/0022-2496(77)90033-5 [17] W. Ossadnik and O. Lange, “Theory and Methodology, AHP-Based Evaluation of AHP-Software,” European Journal of Operational Research, Vol. 118, No. 3, 1999, pp. 578-588. doi:10.1016/S0377-2217(98)00321-X [18] A. S. Nayak and M. A. Pai, “Congestion Management in Restructured Power Systems Using an Optimal Power Flow Framework,” Master Thesis and Project Report, University of Illinois at Urbana-Champaign, PSERC Pub- lication, Tempe, 2002, pp. 2-23. 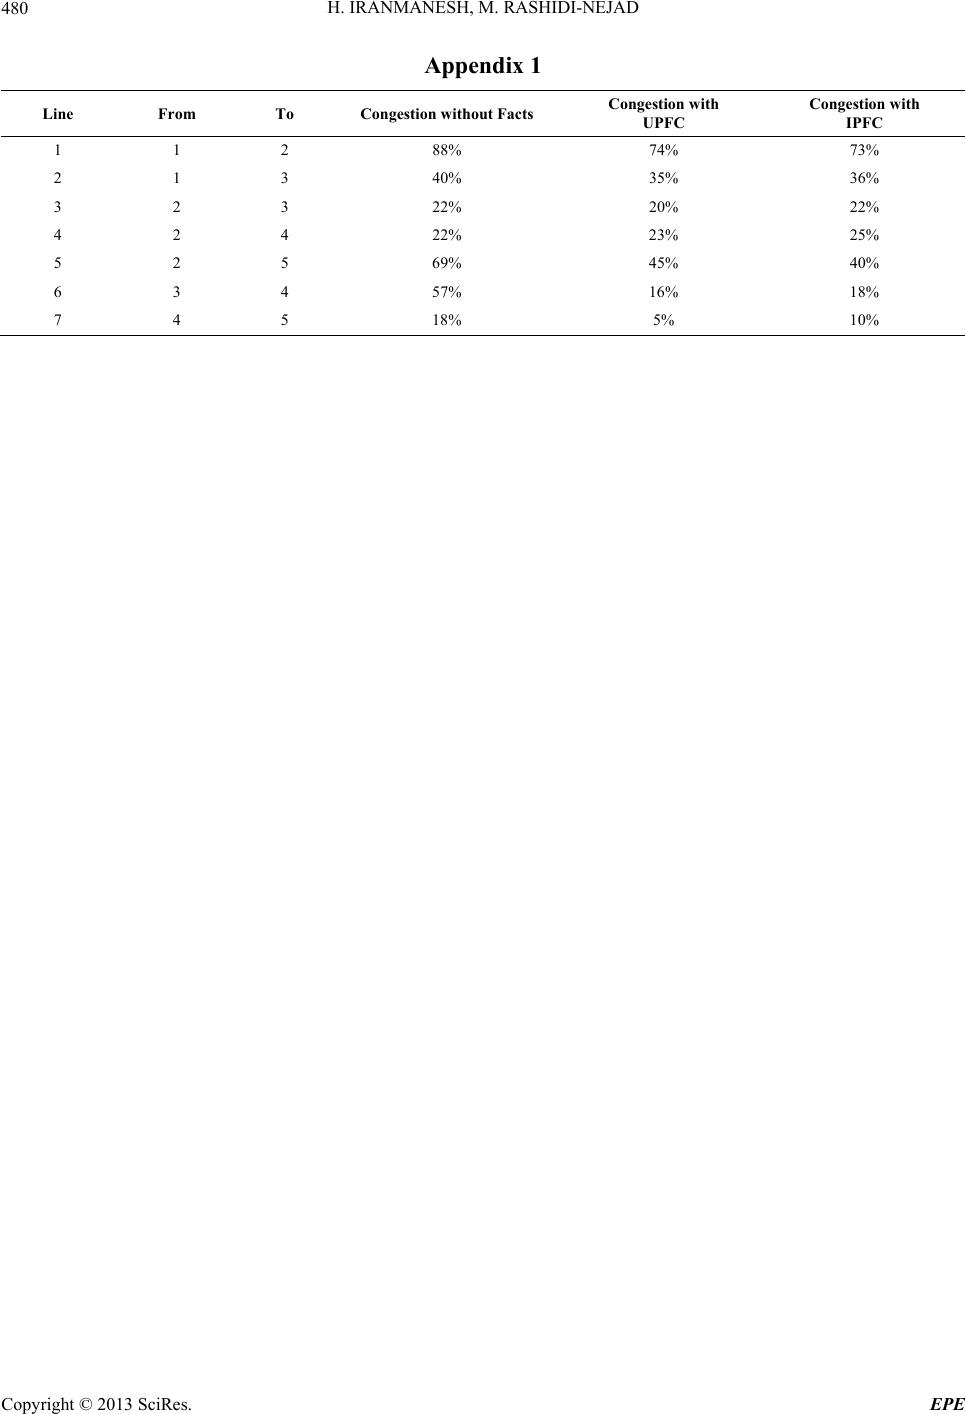 H. IRANMANESH, M. RASHIDI-NEJAD 480 Appendix 1 Line From To Congestion without Facts Congestion with Congestion with UPFC IPFC 1 1 2 88% 74% 73% 2 1 3 40% 35% 36% 3 2 3 22% 20% 22% 4 2 4 22% 23% 25% 5 2 5 69% 45% 40% 6 3 4 57% 16% 18% 7 4 5 18% 5% 10% Copyright © 2013 SciRes. EPE |