

Paper Menu >>
Journal Menu >>
 Theoretical Economics Letters, 2013, 3, 39-44 http://dx.doi.org/10.4236/tel.2013.35A1006 Published Online September 2013 (http://www.scirp.org/journal/tel) A Macroecono mic M odel of Biodiversity Protection* David Martin Davidson College, Davidson, NC, USA Email: [email protected] Received July 31, 2013; revised August 31, 2013; accepted September 10, 2013 Copyright © 2013 David Martin. This is an open access article distributed under the Creative Commons Attribution License, which permits unrestricted use, distribution, and reproduction in any medium, provided the original work is properly cited. ABSTRACT Many biodiversity researchers have responded to the financial constraints faced by policy makers to develop models based upon the “Noah’s Ark” metaphor, implying that society can save only a limited amount of biodiversity. Unfortu- nately, as Herman Daly (Land Economics , 1991) pointed out, su ch microeconomic rules can allow an ark to sink albeit in some optimal fashion. So, I step back to look at the macroeconomic question, how big should the ark be? I start with Norgaard’s (Ecological Economics, 2010) framework, which is based upon the con cept of a production po ssibility fron - tier combined with a sustainability criterion. I develop a model from that starting point by shifting to an isoquant fra- mework while maintaining the strong sustainability criterion. I demonstrate how this model allows for identifying and addressing the key biodiversity protection policy criteria at the macroeconomic level. One key conclusion from this modeling is that Daly’s analysis remains remarkably prescient. Keywords: Biodiversity Protection; Natural Capital; Conservation; Macroeconomics; Sustainable Development 1. Introduction This paper is motivated by the economic issues arising from the goal of protecting biodiversity given financial constraints. Because it is likely that the decline in the stock of biodiversity will continue [1], countries recently agreed to increase funding for protecting biodiversity substantially [2]. However, the funding is still far less than estimates historically [3] and recently [4] the con- clusion is necessary. Thus, policy makers are financially constrained when selecting their biodiversity protection actions. Weitzman [5] introduced the Noah’s Ark metaphor to this situation. Following the Abrahamic tradition (To- rah Book of Bereshit, Bible Book of Genesis, and Qur’an Surah 11) that God destroyed the world by flood- ing it with the exception of the people, animals, and plants Noah saved in the Ark, this metaphor implies that a constrained society chooses which aspects of biodiver- sity to save. The literature that followed such as the stu- dies reviewed by Brooks et al. [6] basically focuses on the microeconomic question, which species get to board the ark? These studies treat the size of the ark (the mac- roeconomic question) as exogenous; after all, God told Noah how big to build the ark in the same way that poli- ticians tell policy makers how much th ey get to spend. Daly’s [7] critique about using microeconomics to balance a boat optimally while allowing it to sink (be- cause the macroeconomics fails) resonates with the Noah’s Ark metaphor. So, in this paper I work to answer the macroeconomic question, how big should Noah’s Ark be? I start with Norgaard’s [8] production possibili- ties-based model as it explicitly includes a sustainability criterion. I shift the framework to an isoquant-based frame-work, but retain the strong sustainability criterion and show how changes in it are important to the analysis. I conclude by demonstrating how this model allows ana- lysts to identify and address key biodiversity protection criteria at the macroeconomic level. *I wrote the first few versions of this paper as a Fulbright-Nehru Re- search Scholar affiliated with the Institute of Economic Growth (Uni- versity of Delhi). This paper has been improved substantially by the comments of Dr. Julianne (Mills) Busa and Mr. Surit Das as well as comments from seminar participants at the Madras School of Econom- ics, the Sálim Ali Centre for Ornithology and Natural History, the United States India Educational Foundation South and Central Asia Conference, the Institute of Economic Growth, the Dhaka School o f Economics, the 2013 meeting of the US Society for Ecological Eco- nomics, and the 2013 International C o n g ress for Conservation Biology. 2. Starting Points A popular definition of bi o diversity is E. O. Wil so n’s [ 9] : “all hereditarily based variation at all levels of organiza- tion, from the genes within a single local population or species, to the species composing all or part of a local community, and finally to the communities themselves C opyright © 2013 SciRes. TEL 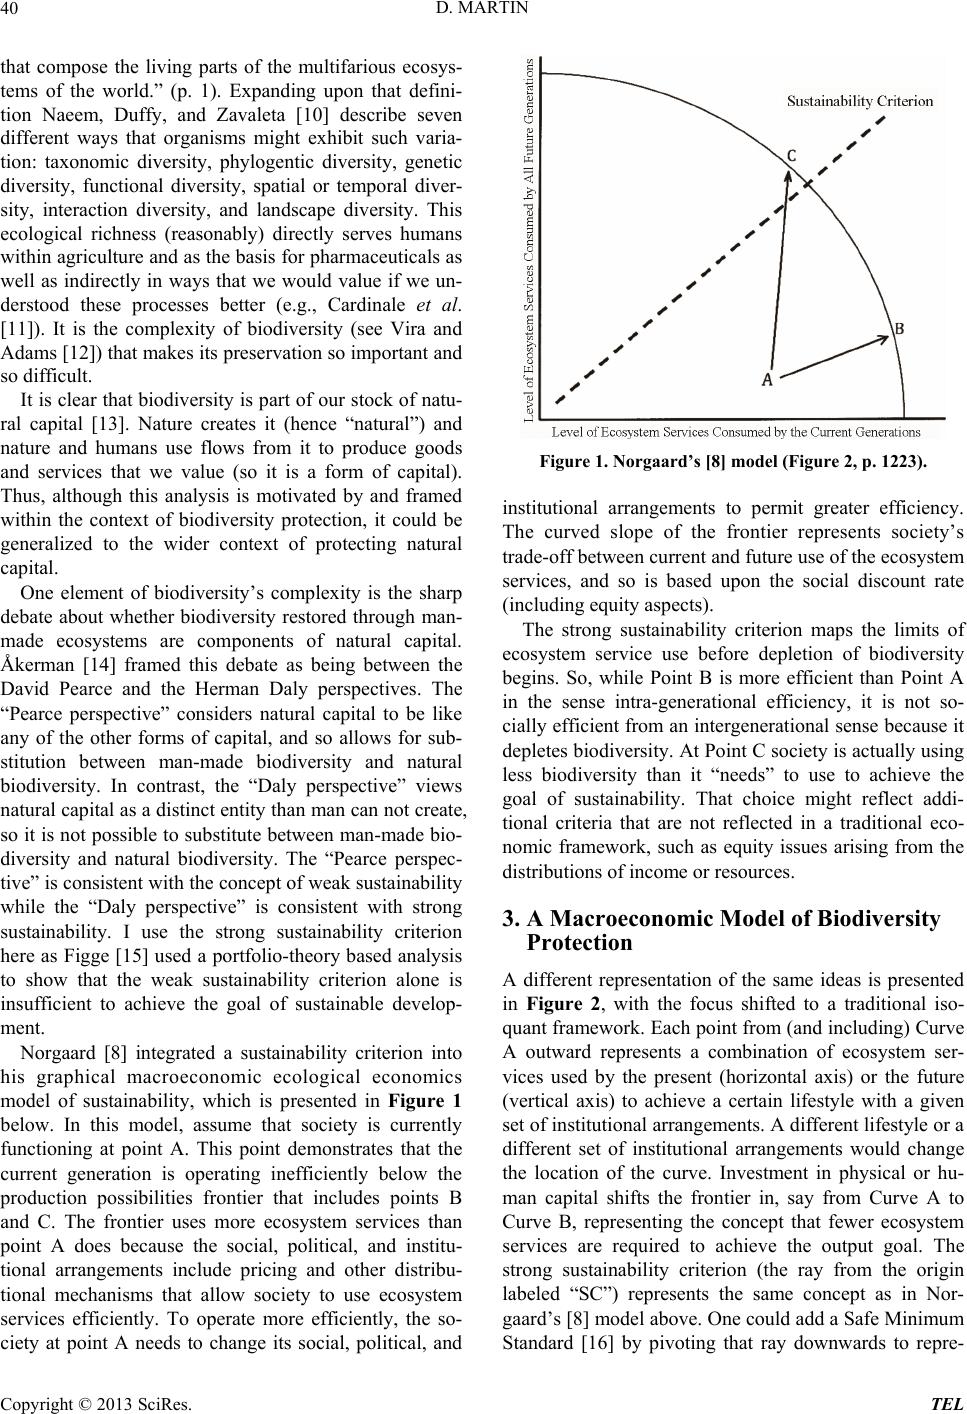 D. MARTIN 40 that compose the living parts of the multifarious ecosys- tems of the world.” (p. 1). Expanding upon that defini- tion Naeem, Duffy, and Zavaleta [10] describe seven different ways that organisms might exhibit such varia- tion: taxonomic diversity, phylogentic diversity, genetic diversity, functional diversity, spatial or temporal diver- sity, interaction diversity, and landscape diversity. This ecological richness (reasonably) directly serves humans within agriculture and as the basis for pharmaceuticals as well as indirectly in ways that we would value if we un- derstood these processes better (e.g., Cardinale et al. [11]). It is the complexity of biodiversity (see Vira and Adams [12]) that makes its preservation so important and so difficult. It is clear that biodiversity is part of our stock of natu- ral capital [13]. Nature creates it (hence “natural”) and nature and humans use flows from it to produce goods and services that we value (so it is a form of capital). Thus, although this analysis is motivated by and framed within the context of biodiversity protection, it could be generalized to the wider context of protecting natural capital. One element of biodiversity’s complexity is the sharp debate about whether biodiversity restored through man- made ecosystems are components of natural capital. Åkerman [14] framed this debate as being between the David Pearce and the Herman Daly perspectives. The “Pearce perspective” considers natural capital to be like any of the other forms of capital, and so allows for sub- stitution between man-made biodiversity and natural biodiversity. In contrast, the “Daly perspective” views natural capital as a distinct entity than man can not create, so it is not possib le to substitute between man-made bio- diversity and natural biodiversity. The “Pearce perspec- tive” is consistent with the con cept of weak sustainability while the “Daly perspective” is consistent with strong sustainability. I use the strong sustainability criterion here as Figge [15] used a portfolio-theory based analysis to show that the weak sustainability criterion alone is insufficient to achieve the goal of sustainable develop- ment. Norgaard [8] integrated a sustainability criterion into his graphical macroeconomic ecological economics model of sustainability, which is presented in Figure 1 below. In this model, assume that society is currently functioning at point A. This point demonstrates that the current generation is operating inefficiently below the production possibilities frontier that includes points B and C. The frontier uses more ecosystem services than point A does because the social, political, and institu- tional arrangements include pricing and other distribu- tional mechanisms that allow society to use ecosystem services efficiently. To operate more efficiently, the so- ciety at point A needs to change its social, political, and Figure 1. Norgaard’s [8] model (Figure 2, p. 1223). institutional arrangements to permit greater efficiency. The curved slope of the frontier represents society’s trade-off between current and future use of the ecosystem services, and so is based upon the social discount rate (including equity aspects). The strong sustainability criterion maps the limits of ecosystem service use before depletion of biodiversity begins. So, while Point B is more efficient than Point A in the sense intra-generational efficiency, it is not so- cially efficient from an intergenerational sense because it depletes biodiversity. At Point C society is actually u sing less biodiversity than it “needs” to use to achieve the goal of sustainability. That choice might reflect addi- tional criteria that are not reflected in a traditional eco- nomic framework, such as equity issues arising from the distributions of income or resources. 3. A Macroeconomic Model of Biodiversity Protection A different representation of the same ideas is presented in Figure 2, with the focus shifted to a traditional iso- quant framework. Each point from (and including) Curve A outward represents a combination of ecosystem ser- vices used by the present (horizontal axis) or the future (vertical axis) to achieve a certain lifestyle with a given set of institutional arrangements. A differen t lifestyle or a different set of institutional arrangements would change the location of the curve. Investment in physical or hu- man capital shifts the frontier in, say from Curve A to Curve B, representing the concept that fewer ecosystem services are required to achieve the output goal. The strong sustainability criterion (the ray from the origin labeled “SC”) represents the same concept as in Nor- gaard’s [8] model above. One could add a Safe Minimum Standard [16] by pivoting that ray downwards to repre- Copyright © 2013 SciRes. TEL 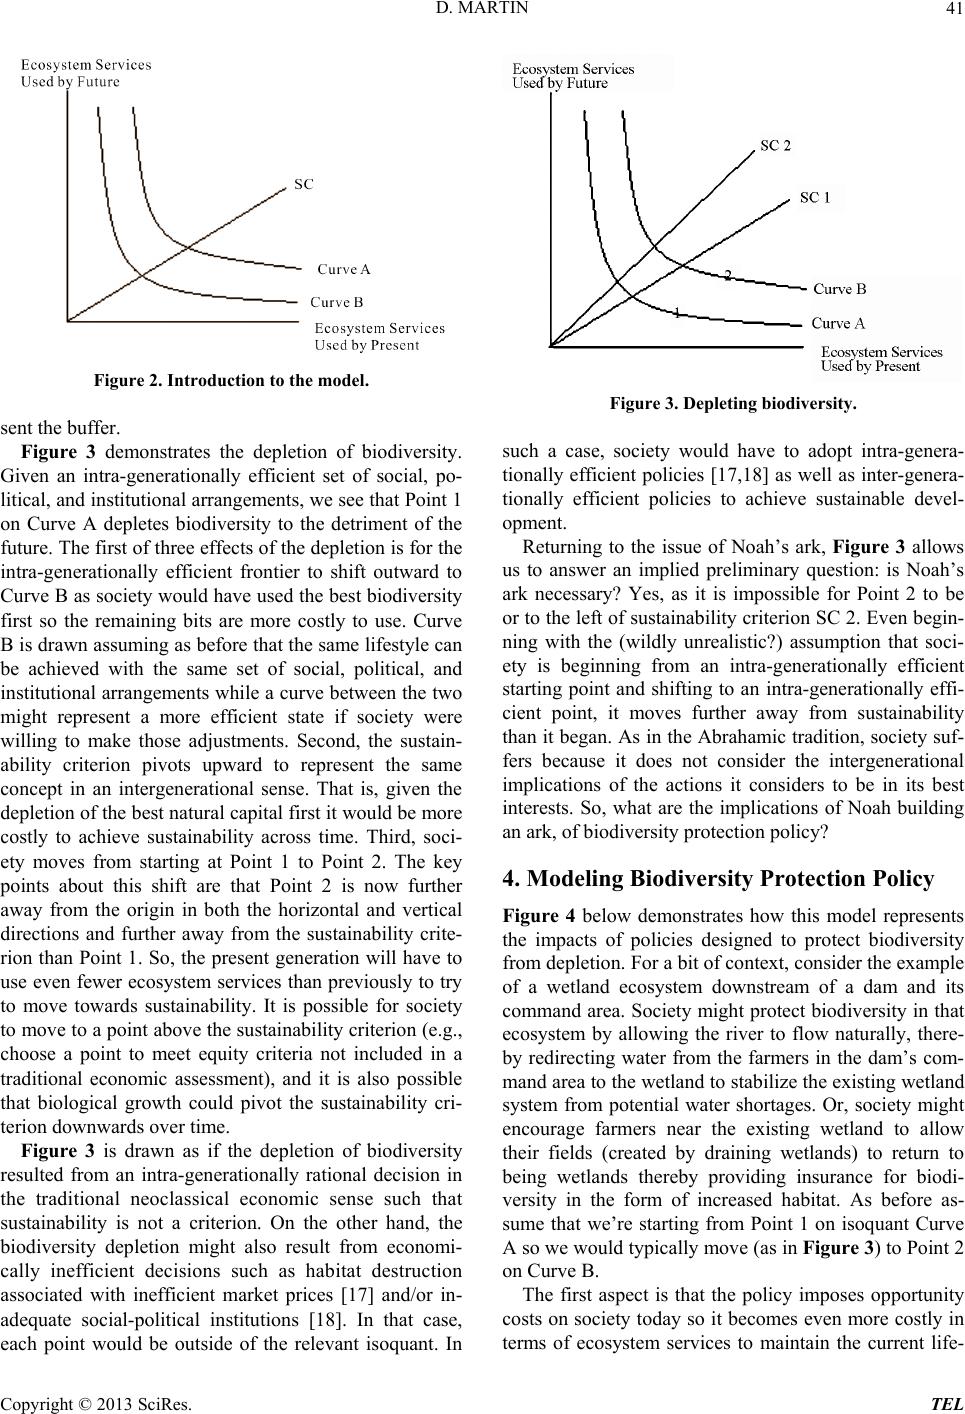 D. MARTIN 41 Figure 2. Introduction to the model. sent the buffer. Figure 3 demonstrates the depletion of biodiversity. Given an intra-generationally efficient set of social, po- litical, and institutional arrangements, we see that Point 1 on Curve A depletes biodiversity to the detriment of the future. The first of three effects of the depletion is for the intra-generationally efficient frontier to shift outward to Curve B as society would have used the best biodiversity first so the remaining bits are more costly to use. Curve B is drawn assuming as before that the same lifestyle can be achieved with the same set of social, political, and institutional arrang ements while a curve between the two might represent a more efficient state if society were willing to make those adjustments. Second, the sustain- ability criterion pivots upward to represent the same concept in an intergenerational sense. That is, given the depletion of the best natural capital first it would be more costly to achieve sustainability across time. Third, soci- ety moves from starting at Point 1 to Point 2. The key points about this shift are that Point 2 is now further away from the origin in both the horizontal and vertical directions and further away from the sustainability crite- rion than Point 1. So, the present generation will have to use even fewer ecosystem services than previously to try to move towards sustainability. It is possible for society to move to a point above the sustainability criterio n (e.g., choose a point to meet equity criteria not included in a traditional economic assessment), and it is also possible that biological growth could pivot the sustainability cri- terion downwar ds over time. Figure 3 is drawn as if the depletion of biodiversity resulted from an intra-generationally rational decision in the traditional neoclassical economic sense such that sustainability is not a criterion. On the other hand, the biodiversity depletion might also result from economi- cally inefficient decisions such as habitat destruction associated with inefficient market prices [17] and/or in- adequate social-political institutions [18]. In that case, each point would be outside of the relevant isoquant. In Figure 3. Depleting biodiversity. such a case, society would have to adopt intra-genera- tionally efficient policies [17,18] as well as inter-genera- tionally efficient policies to achieve sustainable devel- opment. Returning to the issue of Noah’s ark, Figure 3 allows us to answer an implied preliminary question: is Noah’s ark necessary? Yes, as it is impossible for Point 2 to be or to the left of sustainability criterion SC 2. Even begin- ning with the (wildly unrealistic?) assumption that soci- ety is beginning from an intra-generationally efficient starting point and shifting to an intra-generationally effi- cient point, it moves further away from sustainability than it began. As in the Abrahamic tradition, so ciety suf- fers because it does not consider the intergenerational implications of the actions it considers to be in its best interests. So, what are the implications of Noah building an ark, of biodiversity protection policy? 4. Modeling Biodiversity Protection Policy Figure 4 below demonstrates how this model represents the impacts of policies designed to protect biodiversity from depletion. For a bit of context, consider the example of a wetland ecosystem downstream of a dam and its command area. Society might protect biodiversity in that ecosystem by allowing the river to flow naturally, there- by redirecting water from the farmers in the dam’s com- mand area to the wetland to stab ilize the existin g wetlan d system from potential water shortages. Or, society might encourage farmers near the existing wetland to allow their fields (created by draining wetlands) to return to being wetlands thereby providing insurance for biodi- versity in the form of increased habitat. As before as- sume that we’re starting from Point 1 on isoquant Curve A so we would typically move (as in Figure 3) to Point 2 on Curve B. The first aspect is that the policy imposes opportunity costs on society today so it becomes even more costly in terms of ecosystem services to maintain the current life- Copyright © 2013 SciRes. TEL 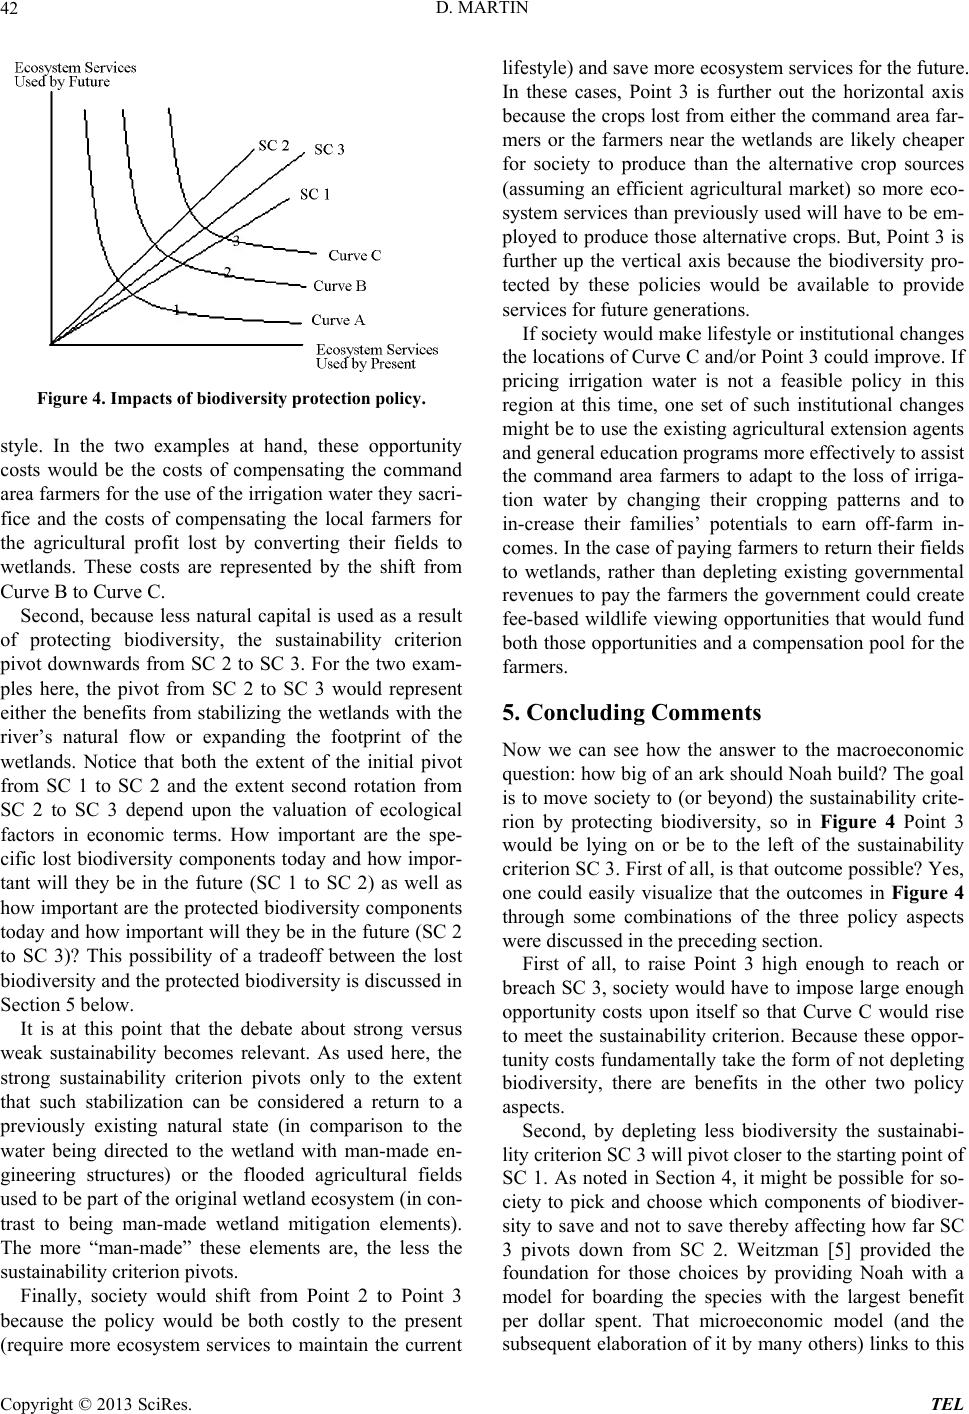 D. MARTIN 42 Figure 4. Impacts of biodiversity protection policy. style. In the two examples at hand, these opportunity costs would be the costs of compensating the command area farmers for the use of the irrigation water they sacri- fice and the costs of compensating the local farmers for the agricultural profit lost by converting their fields to wetlands. These costs are represented by the shift from Curve B to Curve C. Second, because less natural capital is used as a result of protecting biodiversity, the sustainability criterion pivot downwards from SC 2 to SC 3. For the two exam- ples here, the pivot from SC 2 to SC 3 would represent either the benefits from stabilizing the wetlands with the river’s natural flow or expanding the footprint of the wetlands. Notice that both the extent of the initial pivot from SC 1 to SC 2 and the extent second rotation from SC 2 to SC 3 depend upon the valuation of ecological factors in economic terms. How important are the spe- cific lost biodiversity components today and how impor- tant will they be in the future (SC 1 to SC 2) as well as how important are the protected biodiversity components today and how impor tant will they be in the future (SC 2 to SC 3)? This possibility of a tradeoff between the lost biodiversity and th e protected biodiv ersity is discussed in Section 5 belo w. It is at this point that the debate about strong versus weak sustainability becomes relevant. As used here, the strong sustainability criterion pivots only to the extent that such stabilization can be considered a return to a previously existing natural state (in comparison to the water being directed to the wetland with man-made en- gineering structures) or the flooded agricultural fields used to be part of the original wetland ecosystem (in con- trast to being man-made wetland mitigation elements). The more “man-made” these elements are, the less the sustainability criterion pivots. Finally, society would shift from Point 2 to Point 3 because the policy would be both costly to the present (require more ecosystem services to maintain the current lifestyle) and save more ecosystem services for the future. In these cases, Point 3 is further out the horizontal axis because the crops lost from either the command area far- mers or the farmers near the wetlands are likely cheaper for society to produce than the alternative crop sources (assuming an efficient agricultural market) so more eco- system services than previously used will h ave to be em- ployed to produce those altern ative crops. But, Point 3 is further up the vertical axis because the biodiversity pro- tected by these policies would be available to provide services for future generations. If society would make lifestyle or institu tional changes the locations of Curve C and/or Point 3 could improve. If pricing irrigation water is not a feasible policy in this region at this time, one set of such institutional changes might be to use the existing agricultu ral extension agents and general education programs more effectively to assist the command area farmers to adapt to the loss of irriga- tion water by changing their cropping patterns and to in-crease their families’ potentials to earn off-farm in- comes. In the case of paying farmers to return their fields to wetlands, rather than depleting existing governmental revenues to pay the farmers the government could create fee-based wildlife viewing opportunities that would fund both those opportunities and a compensation poo l for the farmers. 5. Concluding Comments Now we can see how the answer to the macroeconomic question: how big of an ark should Noah build? The goal is to move society to (or beyond) the sustainability crite- rion by protecting biodiversity, so in Figure 4 Point 3 would be lying on or be to the left of the sustainability criterion SC 3. First of all, is that outcome possible? Yes, one could easily visualize that the outcomes in Figure 4 through some combinations of the three policy aspects were discussed in the preceding section. First of all, to raise Point 3 high enough to reach or breach SC 3, society would hav e to impose large enough opportunity costs upon itself so that Curve C would rise to meet the sustainability criterion. Because these oppor- tunity costs fundamentally take the form of not depleting biodiversity, there are benefits in the other two policy aspects. Second, by depleting less biodiversity the sustainabi- lity criterion SC 3 will pivot closer to the starting point of SC 1. As noted in Section 4, it might be possible for so- ciety to pick and choose which components of biodiver- sity to save and not to save thereby affecting how far SC 3 pivots down from SC 2. Weitzman [5] provided the foundation for those choices by providing Noah with a model for boarding the species with the largest benefit per dollar spent. That microeconomic model (and the subsequent elaboration of it by many others) links to this Copyright © 2013 SciRes. TEL  D. MARTIN 43 model within the context of providing the means for so- ciety to select the policies that shift Curve C up the least for a given pivot down of SC 3 (or a maximum pivot down of SC 3 for a given shift up of Curve C). The third aspect of biodiversity pr otection policy is th e shift of Point 3 to be to the righ t of Point 2 (the opportu- nity cost to the p r esen t) and to b e high er than Po in t 3 (the benefits to the future). So, in this macroeconomic context Noah would want to choose the species so that the net outcome would be as nearly a vertical rise from Point 2 to Point 3 as possible. Weitzman’s [5] microeconomic framework would facilitate that analysis as it included genetic distinctiveness as one way to measure each spe- cies’ option value for the future. So, Daly’s [7] Plimsoll line-based critique about mi- croeconomists ignoring macroeconomics not only reso- nates metaphorically with the Noah’s Ark problem, it also resonates with the directions this model provides to Noah in building his ark. This macroeconomic model is incapable in and of itself in answering the question, how big should Noah’s ark be? As demonstrated in the pre- ceding two paragraphs, Noah needs complementary mi- croeconomic analyses to select the optimal policies. At the same time, as Noah chooses his policies (boards a species) efficiently he can ascertain if he needs more (if the ark should be larger). Rather than stopping biodiver- sity protection when an insufficient [4] budget constraint is reached, Noah should continue to protect species until Point 3 on Curve C reaches or breaches the sustainability criterion SC 3. The macroeconomic analysis and the mi- croeconomic analysis must go hand-in-glove. Of course, this model leaves open the possibility that society could adjust its lifestyle and institutions, which could shift the frontier inwards and, also, move society to a point closer to the sustainability criterion. As noted in the last paragraph of Section 4, such changes might allow society to move even closer to sustain ability than merely preserving biodiversity alone. Again, microeconomic ana- lysis can suggest efficient social changes and the macro- economic analysis would allow Noah to see the implica- tions for whether he needs to continue building a larger ark. The macroeconomics points to the value of the mi- croeconomics and the microeconomics requires the ma- croeconomics. Daly’s prescient analysis is crucial to Noah whether he starts from Weitzman’s [5] microeco- nomic model or from the macroeconomic model devel- oped here. REFERENCES [1] H. M. Pereira, P. W. Leadley, V. Proença, R. Alkemade, J. P. W. Scharlemann, J. F. Fernandez-Manjarrés, M. B. Araújo, P. Balvanera, R. Biggs, W. W. L. Cheung, L. Chini, H. D. Cooper, E. L. Gilman, S. Guénette, G. C. Hurtt, H. P. Huntington, G. M. Mace, T. Oberdorff, C. Revenga, P. Rodrigues, R. J. Scholes, U. R. Sumaila and M. Walpole, “Scenarios for Global Biodiversity in the 2 1s t Century,” Science, Vol. 330, No. 6010, 2010, pp. 1496- 1501. doi:10.1126/science.1196624 [2] Secretariat of the Convention on Biodiversity, “At United Nations Biodiversity Conference, Countries Agree to Do u- ble Resources for Biodiversity Protection by 2015,” Uni- ted Nations Environment Programmè, Hyderabad, 2012. [3] J. Lewandrowski, R. F. Darwin, M. Tsigas and A. Rane- ses, “Estimating Costs of Protecting Global Ecosystem Diversity,” Ecological Economics, Vol. 29, No. 1, 1999, pp. 111-125. doi:10.1016/S0921-8009(98)00058-5 [4] D. P. McCarthy, P. F. Donald, J. P. W. Scharlemann, G. M. Buchanan, A. Balmford, J. M. H. Green, L. A. Ben- nun, N. D. Burgess, L. D. C. Fishpool, S. T. Garnett, D. L. Leonard, R. F. Maloney, P. Morling, H. M. Schaefer, A. Symes, D. A. Wiedenfeld and S. H. M. Butchart, “Finan- cial Costs of Meeting Global Biodiversity Conservation Targets: Current Spending and Unmet Needs,” Science, Vol. 338, No. 6109, 2012, pp. 946-949. doi:10.1126/science.1229803 [5] M. L. Weitz man, “The Noah’s Ark Problem,” Economet- rica, Vol. 66, No. 6, 1998, pp. 1279-1298. doi:10.2307/2999617 [6] T. M. Brooks, R. A. Mittermeier, G. A. B. da Fonseca, J. Gerlach, M. Hoffmann, J. F. Lamoreux, C. G. Mitter- meier, J. D. Pilgrim and A. S. L. Rodrigues, “Global Bio- diversity Conservation Priorities,” Science, Vol. 313, No. 5783, 2006, pp. 58-61. doi:10.1126/science.1127609 [7] H. E. Daly, “Towards an Environmental Macroeconom- ics,” Land Economics, Vol. 67, No. 2, 1991, pp. 255-259. doi:10.2307/3146415 [8] R. B. Norgaard, “Ecosystem Services: From Eye-Opening Metaphor to Complexity Blinder,” Ecological Economics, Vol. 69, No. 6, 2010, pp. 1219-1227. doi:10.1016/j.ecolecon.2009.11.009 [9] E. O. Wilson, “Introduction,” In: M. L. Reaka-Kudla, D. E. Wilson and E. O. Wilson, Eds., Biodiversity II: Under- standing and Protecting our Biological Resources, John Henry Press, Washington, DC, 1996, pp. 1-3. [10] S. Naeem, J. E. Duffy and E. Zavaleta, “The Functions of Biological Diversity in an Age of Extinction,” Science, Vol. 336, No. 6087, 2012, pp. 1401-1406. doi:10.1126/science.1215855 [11] B. J. Cardinale, J. E. Duffy, A. Gonzalez, D. U. Hooper, C. Perrings, P. Venail, A. Narwani, G. M. Mace, D. Til- man, D. A. Wardle, A. P. Kinzig, G. C. Daily , M. Loreau, J. B. Grace, A. Larigauderie, D. S. Srivastava and S. Na- eem, “Biodiversity Loss and Its Impact on Humanity,” Nature, Vol. 486, No. 7401, 2012, pp. 59-67. doi:10.1038/nature11148 [12] B. Vira and W. M. Ada ms, “Ecosystem Service s and Con - servation Strategy: Beware the Silver Bullet,” Conserva- tion Letters, Vol. 2, No. 4, 2009, pp. 158-162. [13] R. Costanza and H. E. Daly, “Natural Capital and Sus- tainable Development,” Conservation Biology, Vol. 6, No. 1, 1992, pp. 37-46. doi:10.1046/j.1523-1739.1992.610037.x [14] M. Åkerman, “What Does ‘Natural Capital’ Do? The Role of Metaphor in Economic Understanding of the En- Copyright © 2013 SciRes. TEL  D. MARTIN Copyright © 2013 SciRes. TEL 44 vironment,” Environmental Values, Vol. 12, No. 4, 2003, pp. 431-448. doi:10.3197/096327103129341397 [15] F. Figge, “Capital Substitutability and Weak Sustainabil- ity Revisited: The Conditions for Capital Substitution in the Presence of Risk,” Environmental Values, Vol. 14, No. 2, 2005, pp. 185-201. doi:10.3197/0963271054084966 [16] C. V. Ciriacy-Wantrup, “Resource Conservation: Eco- nomics and Policies,” University of California Division of Agricultural Sciences Agricultural Experiment Station, Berkeley and Los Angeles, 1968. [17] J. M. Buchanan and W. C. Stubblebine, “Externality,” Economica, Vol. 29, No. 116, 1962, pp. 371-384. doi:10.2307/2551386 [18] E. Ostrom, “Beyond Markets and States: Polycentric Governance of Complex Economic Systems,” American Economic Review, Vol. 100, No. 3, 2010, pp. 641-672. doi:10.1257/aer.100.3.641 |