

Paper Menu >>
Journal Menu >>
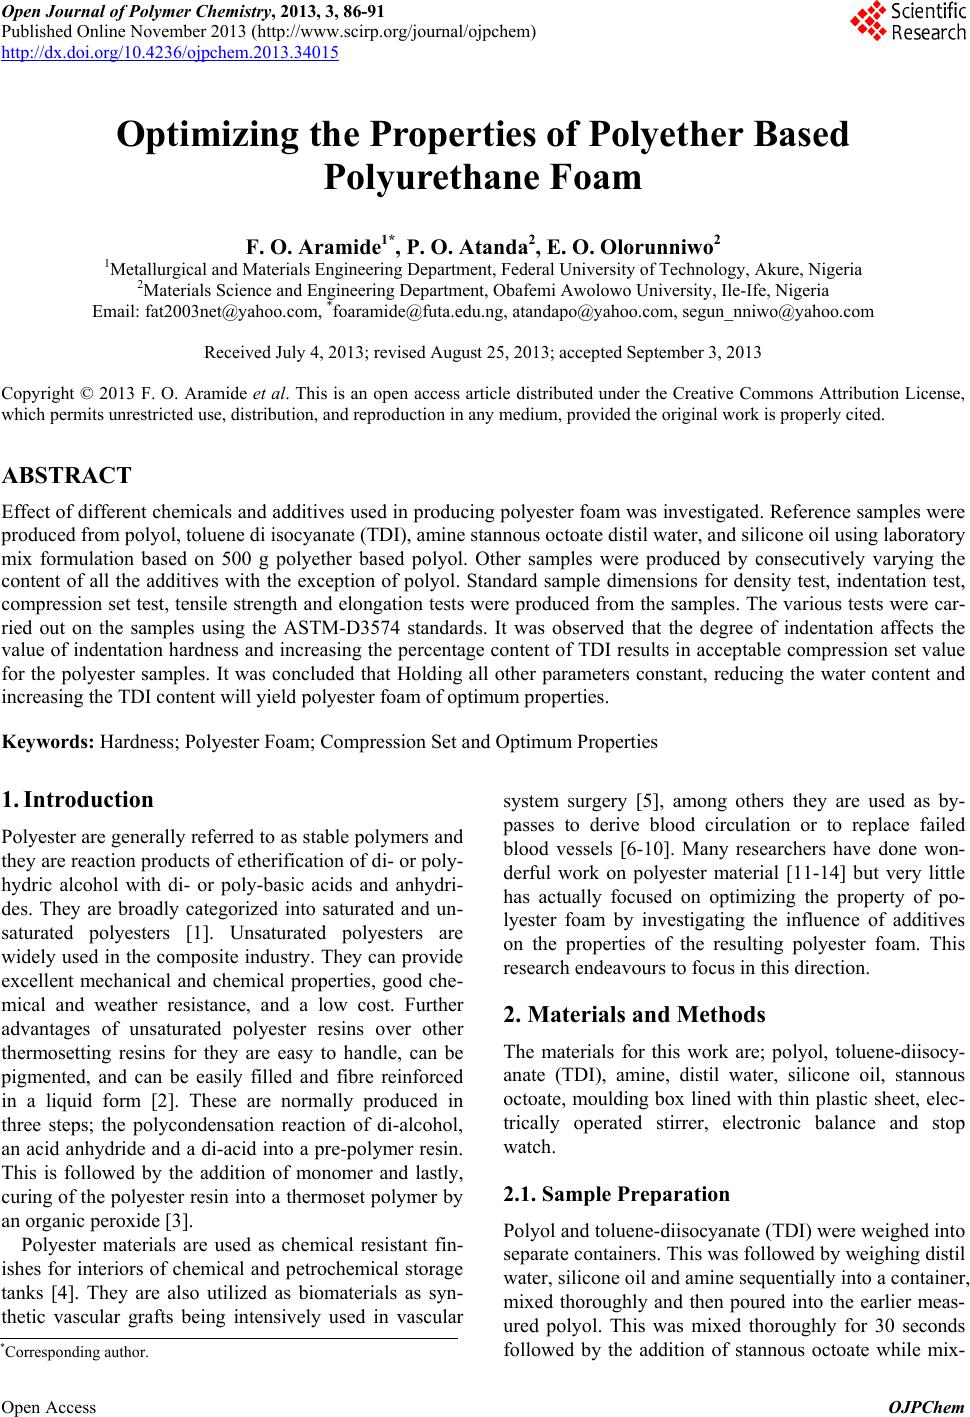 Open Journal of Polymer Chemistry, 2013, 3, 86-91 Published Online November 2013 (http://www.scirp.org/journal/ojpchem) http://dx.doi.org/10.4236/ojpchem.2013.34015 Open Access OJPChem Optimizing the Properties of Polyether Based Polyurethane Foam F. O. Aramide1*, P. O. Atanda2, E. O. Olorunniwo2 1Metallurgical and Materials Engineering Department, Federal University of Technology, Akure, Nigeria 2Materials Science and Engineering Department, Obafemi Awolowo University, Ile-Ife, Nigeria Email: [email protected], *[email protected], atanda[email protected], [email protected] Received July 4, 2013; revised August 25, 2013; accepted September 3, 2013 Copyright © 2013 F. O. Aramide et al. This is an open access article distributed under the Creative Commons Attribution License, which permits unrestricted use, distribution, and reproduction in any medium, provided the original work is properly cited. ABSTRACT Effect of different chemicals and additives used in producing polyester foam was investigated. Reference samples were produced from polyol, toluene di isocyanate (TDI), amine stannous octoate distil water, and silicone oil using laboratory mix formulation based on 500 g polyether based polyol. Other samples were produced by consecutively varying the content of all the additives with the exception of polyol. Standard sample dimensions for density test, indentation test, compression set test, tensile strength and elongation tests were produced from the samples. The various tests were car- ried out on the samples using the ASTM-D3574 standards. It was observed that the degree of indentation affects the value of indentation hardness and increasing the percentage content of TDI results in acceptable compression set value for the polyester samples. It was concluded that Holding all other parameters constant, reducing the water content and increasing the TDI content will yield polyester foam of optimum properties. Keywords: Hardness; Polyester Foam; Compression Set and Optimum Properties 1. Introduction Polyester are generally referred to as stable polymers and they are reaction products of etherification of di- or poly- hydric alcohol with di- or poly-basic acids and anhydri- des. They are broadly categorized into saturated and un- saturated polyesters [1]. Unsaturated polyesters are widely used in the composite industry. They can provide excellent mechanical and chemical properties, good che- mical and weather resistance, and a low cost. Further advantages of unsaturated polyester resins over other thermosetting resins for they are easy to handle, can be pigmented, and can be easily filled and fibre reinforced in a liquid form [2]. These are normally produced in three steps; the polycondensation reaction of di-alcohol, an acid anhydride and a di-acid into a pre-polymer resin. This is followed by the addition of monomer and lastly, curing of the polyester resin into a thermoset polymer by an organic peroxide [3]. Polyester materials are used as chemical resistant fin- ishes for interiors of chemical and petrochemical storage tanks [4]. They are also utilized as biomaterials as syn- thetic vascular grafts being intensively used in vascular system surgery [5], among others they are used as by- passes to derive blood circulation or to replace failed blood vessels [6-10]. Many researchers have done won- derful work on polyester material [11-14] but very little has actually focused on optimizing the property of po- lyester foam by investigating the influence of additives on the properties of the resulting polyester foam. This research endeavours to focus in this direction. 2. Materials and Methods The materials for this work are; polyol, toluene-diisocy- anate (TDI), amine, distil water, silicone oil, stannous octoate, moulding box lined with thin plastic sheet, elec- trically operated stirrer, electronic balance and stop watch. 2.1. Sample Preparation Polyol and toluene-diisocyanate (TDI) were weighed into separate containers. This was followed by weighing distil water, silicone oil and amine sequentially into a container, mixed thoroughly and then poured into the earlier meas- ured polyol. This was mixed thoroughly for 30 seconds followed by the addition of stannous octoate while mix- *Corresponding author. 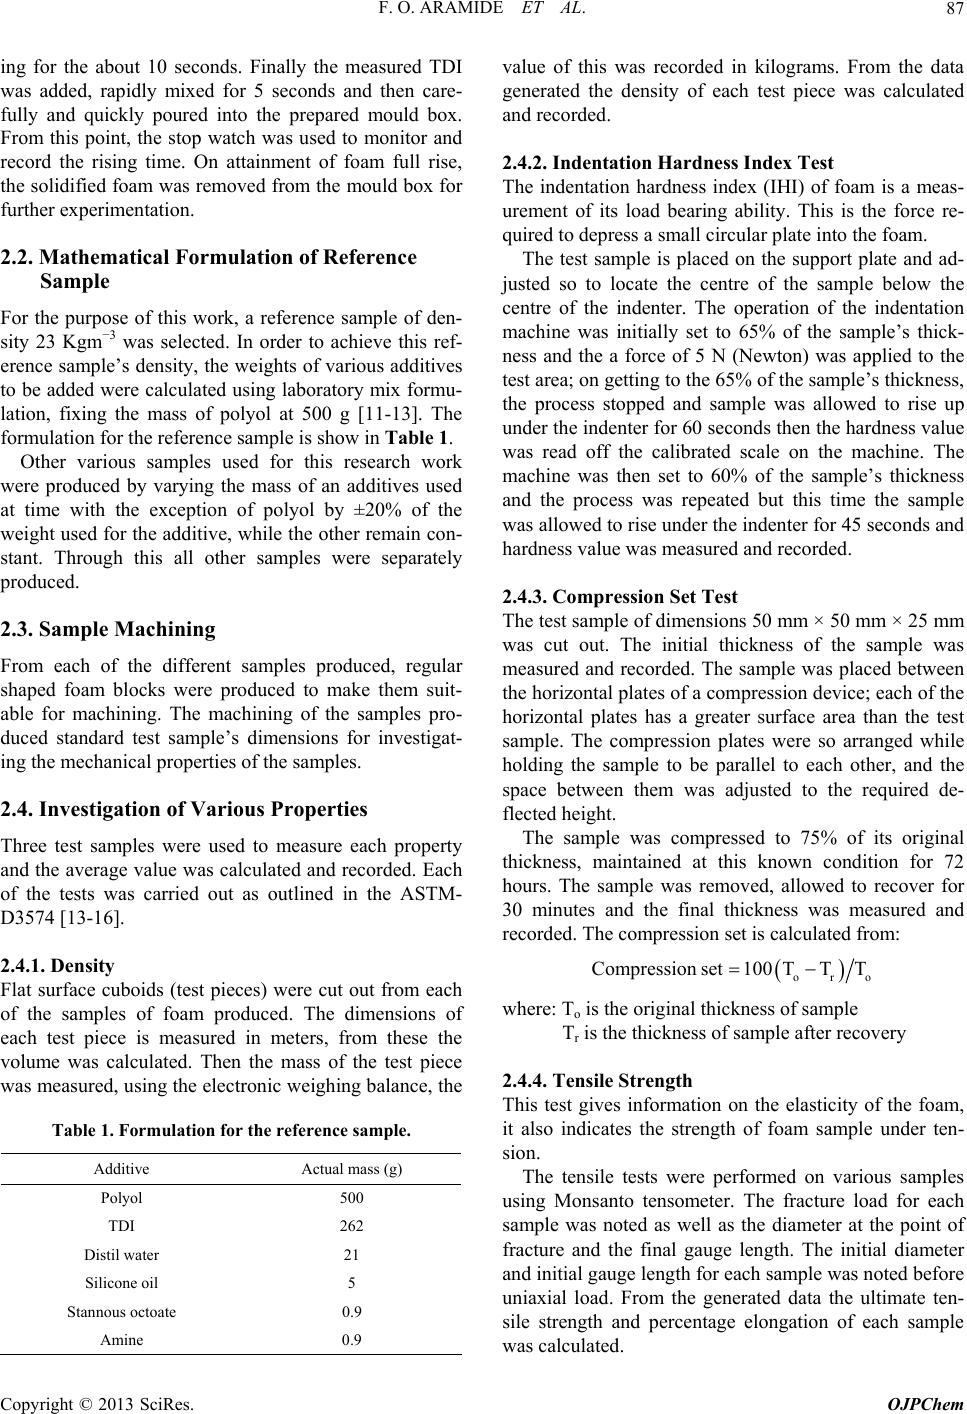 F. O. ARAMIDE ET AL. 87 ing for the about 10 seconds. Finally the measured TDI was added, rapidly mixed for 5 seconds and then care- fully and quickly poured into the prepared mould box. From this point, the stop watch was used to monitor and record the rising time. On attainment of foam full rise, the solidified foam was removed from the mould box for further experimentation. 2.2. Mathematical Formulation of Reference Sample For the purpose of this work, a reference sample of den- sity 23 Kgm−3 was selected. In order to achieve this ref- erence sample’s density, the weights of various additives to be added were calculated using laboratory mix formu- lation, fixing the mass of polyol at 500 g [11-13]. The formulation for the reference sample is show in Table 1. Other various samples used for this research work were produced by varying the mass of an additives used at time with the exception of polyol by ±20% of the weight used for the additive, while the other remain con- stant. Through this all other samples were separately produced. 2.3. Sample Machining From each of the different samples produced, regular shaped foam blocks were produced to make them suit- able for machining. The machining of the samples pro- duced standard test sample’s dimensions for investigat- ing the mechanical properties of the samples. 2.4. Investigation of Various Properties Three test samples were used to measure each property and the average value was calculated and recorded. Each of the tests was carried out as outlined in the ASTM- D3574 [13-16]. 2.4.1. Density Flat surface cuboids (test pieces) were cut out from each of the samples of foam produced. The dimensions of each test piece is measured in meters, from these the volume was calculated. Then the mass of the test piece was measured, using the electronic weighing balance, the Table 1. Formulation for the reference sample. Additive Actual mass (g) Polyol 500 TDI 262 Distil water 21 Silicone oil 5 Stannous octoate 0.9 Amine 0.9 value of this was recorded in kilograms. From the data generated the density of each test piece was calculated and recorded. 2.4.2. Indentation Hardness Index Test The indentation hardness index (IHI) of foam is a meas- urement of its load bearing ability. This is the force re- quired to depress a small circular plate into the foam. The test sample is placed on the support plate and ad- justed so to locate the centre of the sample below the centre of the indenter. The operation of the indentation machine was initially set to 65% of the sample’s thick- ness and the a force of 5 N (Newton) was applied to the test area; on getting to the 65% of the sample’s thickness, the process stopped and sample was allowed to rise up under the indenter for 60 seconds then the hardness value was read off the calibrated scale on the machine. The machine was then set to 60% of the sample’s thickness and the process was repeated but this time the sample was allowed to rise under the indenter for 45 seconds and hardness value was measured and recorded. 2.4.3. Compression Set Test The test sample of dimensions 50 mm × 50 mm × 25 mm was cut out. The initial thickness of the sample was measured and recorded. The sample was placed between the horizontal plates of a compression device; each of the horizontal plates has a greater surface area than the test sample. The compression plates were so arranged while holding the sample to be parallel to each other, and the space between them was adjusted to the required de- flected height. The sample was compressed to 75% of its original thickness, maintained at this known condition for 72 hours. The sample was removed, allowed to recover for 30 minutes and the final thickness was measured and recorded. The compression set is calculated from: oro Compression set100TTT where: To is the original thickness of sample Tr is the thickness of sample after recovery 2.4.4. Tensile Strength This test gives information on the elasticity of the foam, it also indicates the strength of foam sample under ten- sion. The tensile tests were performed on various samples using Monsanto tensometer. The fracture load for each sample was noted as well as the diameter at the point of fracture and the final gauge length. The initial diameter and initial gauge length for each sample was noted before uniaxial load. From the generated data the ultimate ten- sile strength and percentage elongation of each sample was calculated. Copyright © 2013 SciRes. OJPChem 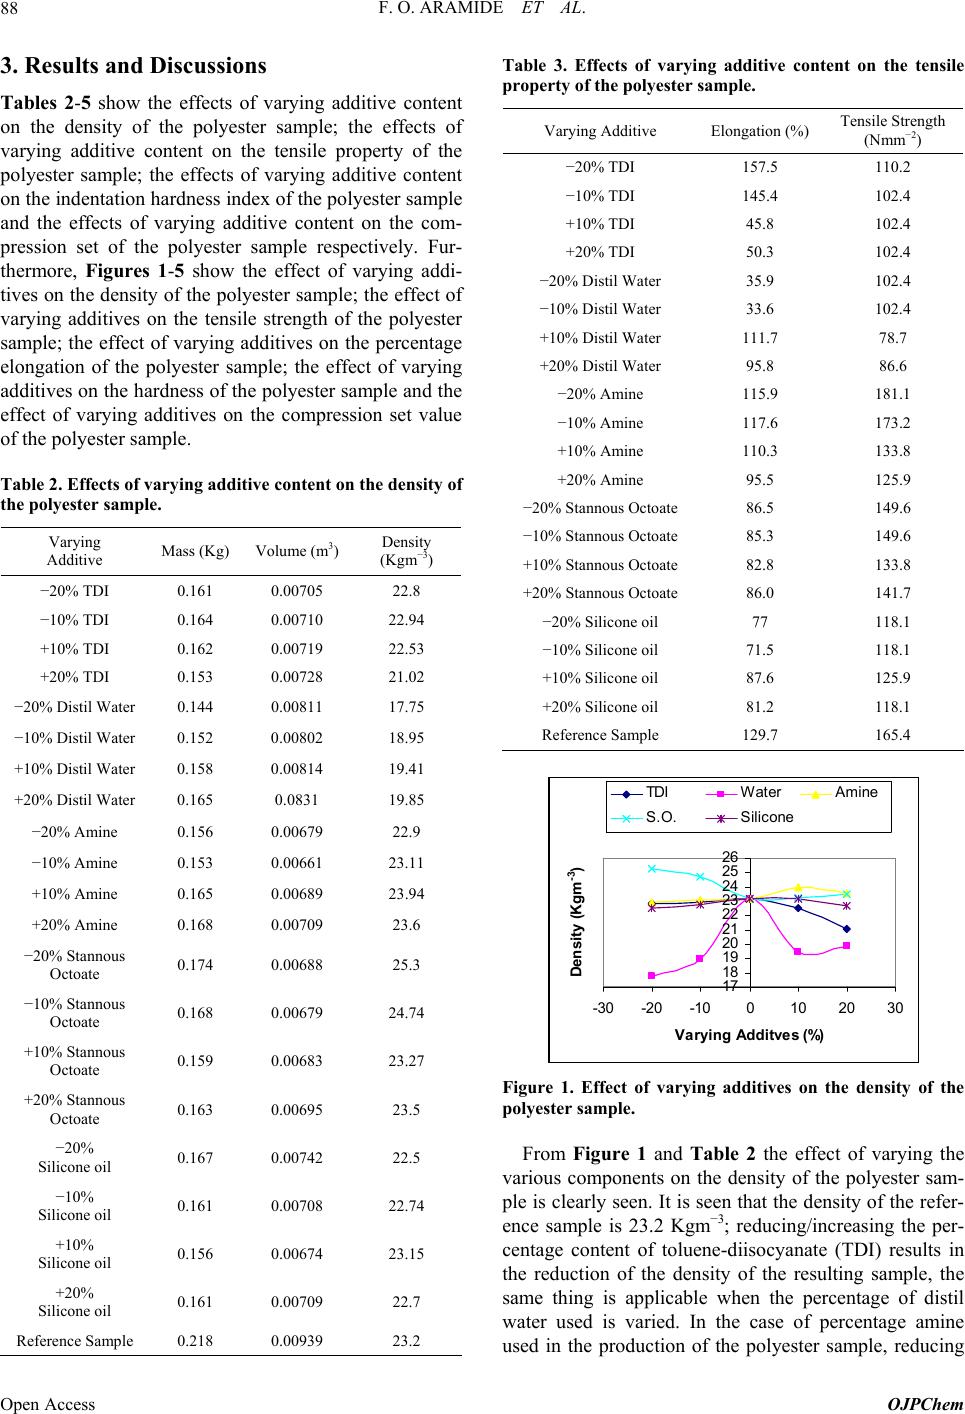 F. O. ARAMIDE ET AL. 88 3. Results and Discussions Tables 2-5 show the effects of varying additive content on the density of the polyester sample; the effects of varying additive content on the tensile property of the polyester sample; the effects of varying additive content on the indentation hardness index of the polyester sample and the effects of varying additive content on the com- pression set of the polyester sample respectively. Fur- thermore, Figures 1-5 show the effect of varying addi- tives on the density of the polyester sample; the effect of varying additives on the tensile strength of the polyester sample; the effect of varying additives on the percentage elongation of the polyester sample; the effect of varying additives on the hardness of the polyester sample and the effect of varying additives on the compression set value of the polyester sample. Table 2. Effects of varying additive content on the density of the polyester sample. Varying Additive Mass (Kg) Volume (m3) Density (Kgm−3) −20% TDI 0.161 0.00705 22.8 −10% TDI 0.164 0.00710 22.94 +10% TDI 0.162 0.00719 22.53 +20% TDI 0.153 0.00728 21.02 −20% Distil Water 0.144 0.00811 17.75 −10% Distil Water 0.152 0.00802 18.95 +10% Distil Water 0.158 0.00814 19.41 +20% Distil Water 0.165 0.0831 19.85 −20% Amine 0.156 0.00679 22.9 −10% Amine 0.153 0.00661 23.11 +10% Amine 0.165 0.00689 23.94 +20% Amine 0.168 0.00709 23.6 −20% Stannous Octoate 0.174 0.00688 25.3 −10% Stannous Octoate 0.168 0.00679 24.74 +10% Stannous Octoate 0.159 0.00683 23.27 +20% Stannous Octoate 0.163 0.00695 23.5 −20% Silicone oil 0.167 0.00742 22.5 −10% Silicone oil 0.161 0.00708 22.74 +10% Silicone oil 0.156 0.00674 23.15 +20% Silicone oil 0.161 0.00709 22.7 Reference Sample 0.218 0.00939 23.2 Table 3. Effects of varying additive content on the tensile property of the polyester sample. Varying Additive Elongation (%) Tensile Strength (Nmm−2) −20% TDI 157.5 110.2 −10% TDI 145.4 102.4 +10% TDI 45.8 102.4 +20% TDI 50.3 102.4 −20% Distil Water 35.9 102.4 −10% Distil Water 33.6 102.4 +10% Distil Water 111.7 78.7 +20% Distil Water 95.8 86.6 −20% Amine 115.9 181.1 −10% Amine 117.6 173.2 +10% Amine 110.3 133.8 +20% Amine 95.5 125.9 −20% Stannous Octoate 86.5 149.6 −10% Stannous Octoate 85.3 149.6 +10% Stannous Octoate 82.8 133.8 +20% Stannous Octoate 86.0 141.7 −20% Silicone oil 77 118.1 −10% Silicone oil 71.5 118.1 +10% Silicone oil 87.6 125.9 +20% Silicone oil 81.2 118.1 Reference Sample 129.7 165.4 17 18 19 20 21 22 23 24 25 26 -30 -20 -100102030 V arying Ad d itves (%) Den sity (Kgm -3 ) TDI Water Amine S.O. Silicone Figure 1. Effect of varying additives on the density of the polyester sample. From Figure 1 and Table 2 the effect of varying the various components on the density of the polyester sam- ple is clearly seen. It is seen that the density of the refer- ence sample is 23.2 Kgm−3; reducing/increasing the per- centage content of toluene-diisocyanate (TDI) results in the reduction of the density of the resulting sample, the same thing is applicable when the percentage of distil water used is varied. In the case of percentage amine used in the production of the polyester sample, reducing Open Access OJPChem 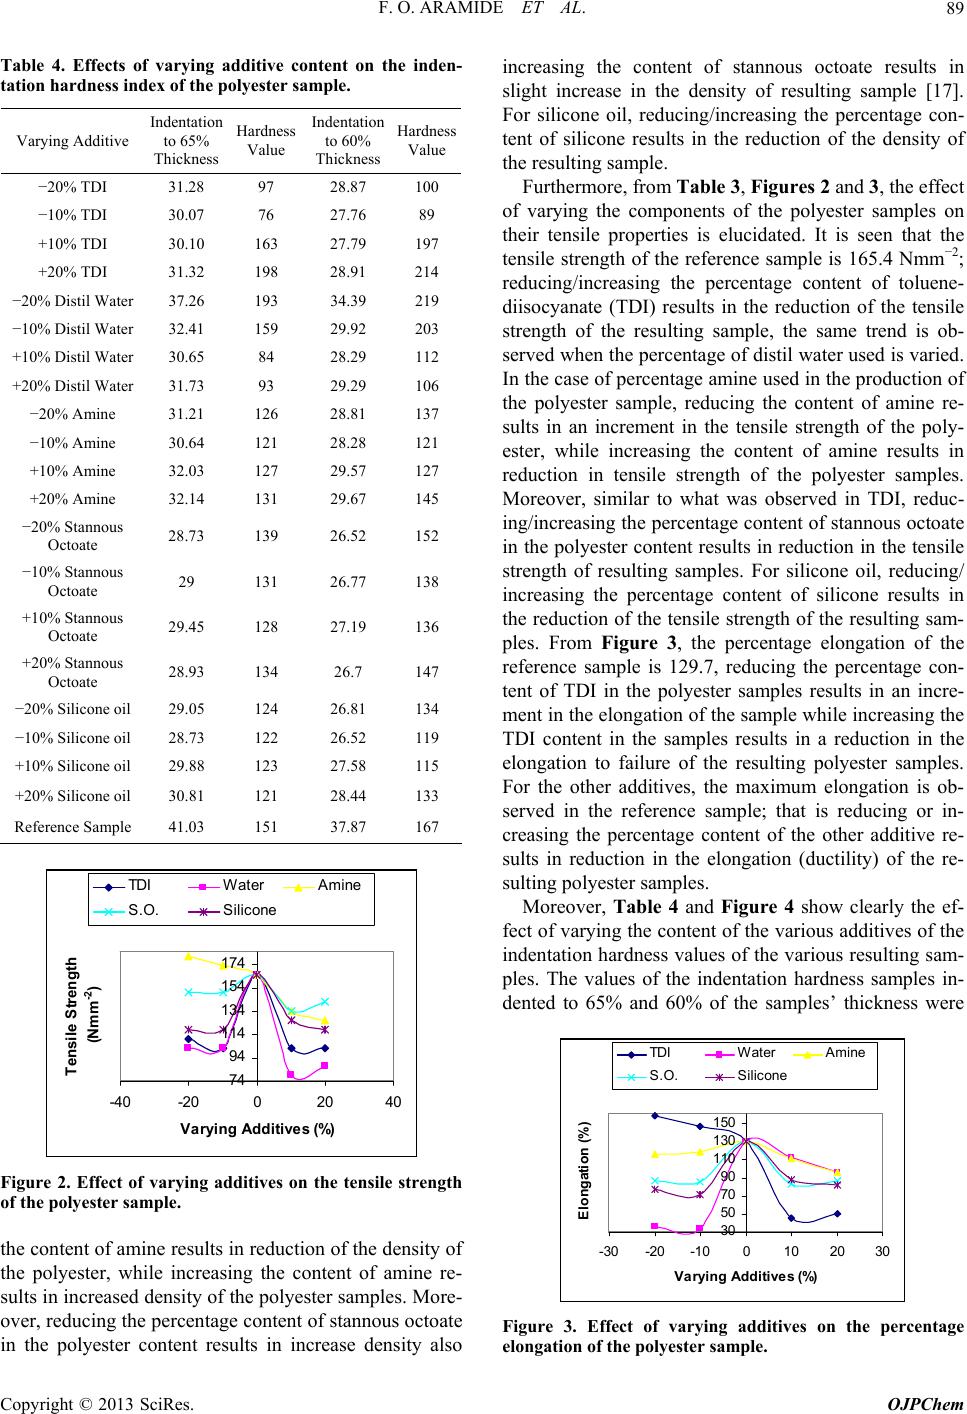 F. O. ARAMIDE ET AL. 89 Table 4. Effects of varying additive content on the inden- tation hardness index of the polyester sample. Varying Additive Indentation to 65% Thickness Hardness Value Indentation to 60% Thickness Hardness Value −20% TDI 31.28 97 28.87 100 −10% TDI 30.07 76 27.76 89 +10% TDI 30.10 163 27.79 197 +20% TDI 31.32 198 28.91 214 −20% Distil Water 37.26 193 34.39 219 −10% Distil Water 32.41 159 29.92 203 +10% Distil Water 30.65 84 28.29 112 +20% Distil Water 31.73 93 29.29 106 −20% Amine 31.21 126 28.81 137 −10% Amine 30.64 121 28.28 121 +10% Amine 32.03 127 29.57 127 +20% Amine 32.14 131 29.67 145 −20% Stannous Octoate 28.73 139 26.52 152 −10% Stannous Octoate 29 131 26.77 138 +10% Stannous Octoate 29.45 128 27.19 136 +20% Stannous Octoate 28.93 134 26.7 147 −20% Silicone oil 29.05 124 26.81 134 −10% Silicone oil 28.73 122 26.52 119 +10% Silicone oil 29.88 123 27.58 115 +20% Silicone oil 30.81 121 28.44 133 Reference Sample 41.03 151 37.87 167 74 94 114 134 154 174 -40 -2002040 Varying Additive s (%) Tensile Strength (Nmm -2 ) TDI Water Amine S.O. Silicone Figure 2. Effect of varying additives on the tensile strength of the polyester sample. the content of amine results in reduction of the density of the polyester, while increasing the content of amine re- sults in increased density of the polyester samples. More- over, reducing the percentage content of stannous octoate in the polyester content results in increase density also increasing the content of stannous octoate results in slight increase in the density of resulting sample [17]. For silicone oil, reducing/increasing the percentage con- tent of silicone results in the reduction of the density of the resulting sample. Furthermore, from Table 3, Figures 2 and 3, the effect of varying the components of the polyester samples on their tensile properties is elucidated. It is seen that the tensile strength of the reference sample is 165.4 Nmm−2; reducing/increasing the percentage content of toluene- diisocyanate (TDI) results in the reduction of the tensile strength of the resulting sample, the same trend is ob- served when the percentage of distil water used is varied. In the case of percentage amine used in the production of the polyester sample, reducing the content of amine re- sults in an increment in the tensile strength of the poly- ester, while increasing the content of amine results in reduction in tensile strength of the polyester samples. Moreover, similar to what was observed in TDI, reduc- ing/increasing the percentage content of stannous octoate in the polyester content results in reduction in the tensile strength of resulting samples. For silicone oil, reducing/ increasing the percentage content of silicone results in the reduction of the tensile strength of the resulting sam- ples. From Figure 3, the percentage elongation of the reference sample is 129.7, reducing the percentage con- tent of TDI in the polyester samples results in an incre- ment in the elongation of the sample while increasing the TDI content in the samples results in a reduction in the elongation to failure of the resulting polyester samples. For the other additives, the maximum elongation is ob- served in the reference sample; that is reducing or in- creasing the percentage content of the other additive re- sults in reduction in the elongation (ductility) of the re- sulting polyester samples. Moreover, Table 4 and Figure 4 show clearly the ef- fect of varying the content of the various additives of the indentation hardness values of the various resulting sam- ples. The values of the indentation hardness samples in- dented to 65% and 60% of the samples’ thickness were 30 50 70 90 110 130 150 -30-20 -100102030 Va rying Additives (%) El ongation (%) TDI WaterAmine S.O. Silicone Figure 3. Effect of varying additives on the percentage elongation of the polyester sample. Copyright © 2013 SciRes. OJPChem 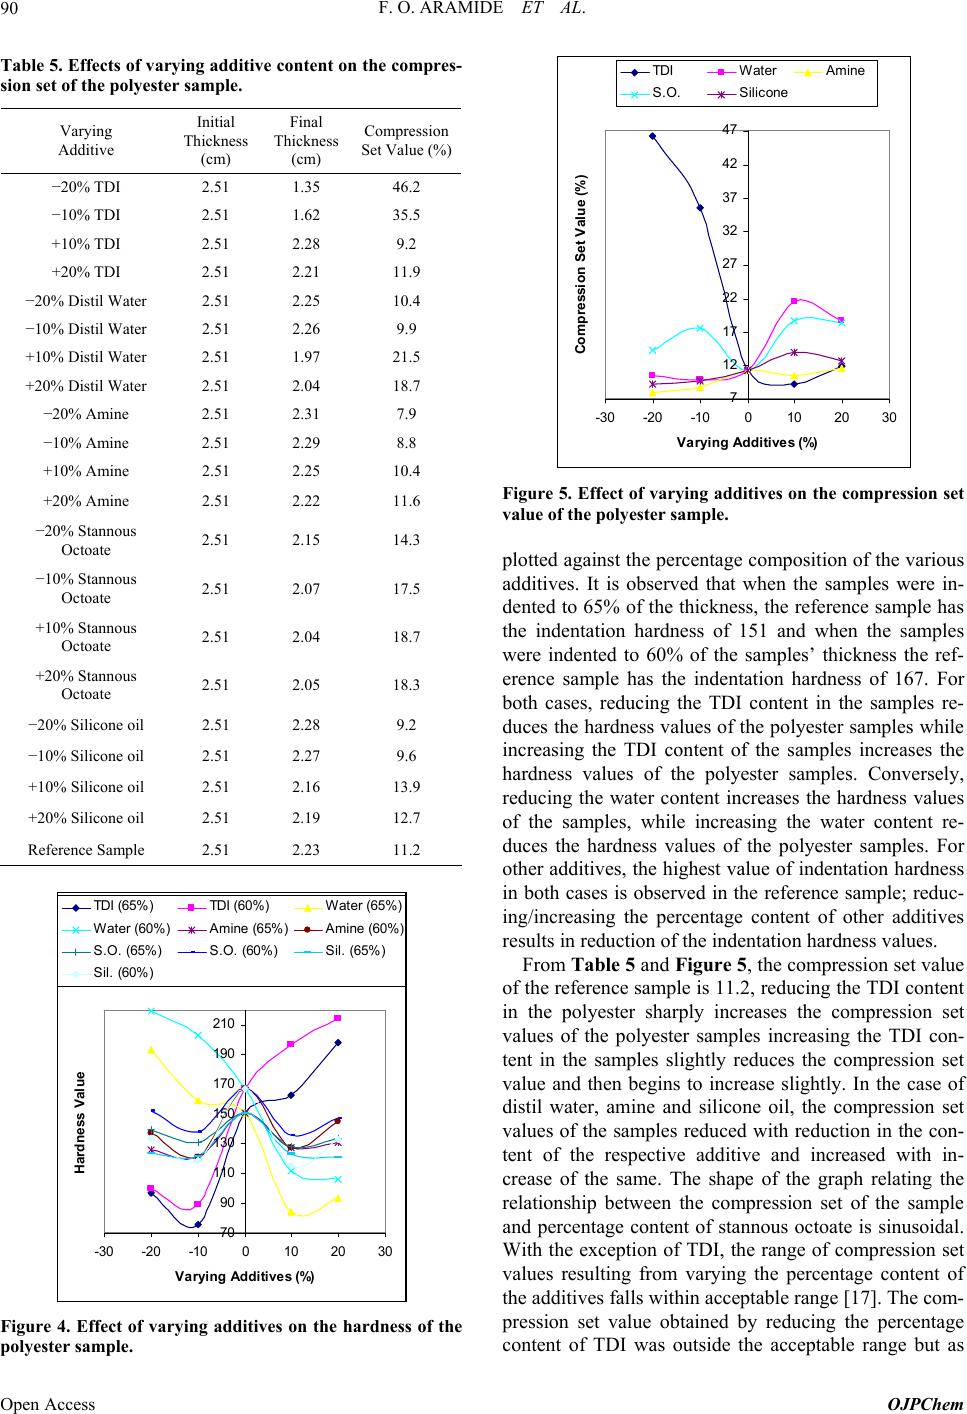 F. O. ARAMIDE ET AL. 90 Table 5. Effects of varying additive content on the compres- sion set of the polyester sample. Varying Additive Initial Thickness (cm) Final Thickness (cm) Compression Set Value (%) −20% TDI 2.51 1.35 46.2 −10% TDI 2.51 1.62 35.5 +10% TDI 2.51 2.28 9.2 +20% TDI 2.51 2.21 11.9 −20% Distil Water 2.51 2.25 10.4 −10% Distil Water 2.51 2.26 9.9 +10% Distil Water 2.51 1.97 21.5 +20% Distil Water 2.51 2.04 18.7 −20% Amine 2.51 2.31 7.9 −10% Amine 2.51 2.29 8.8 +10% Amine 2.51 2.25 10.4 +20% Amine 2.51 2.22 11.6 −20% Stannous Octoate 2.51 2.15 14.3 −10% Stannous Octoate 2.51 2.07 17.5 +10% Stannous Octoate 2.51 2.04 18.7 +20% Stannous Octoate 2.51 2.05 18.3 −20% Silicone oil 2.51 2.28 9.2 −10% Silicone oil 2.51 2.27 9.6 +10% Silicone oil 2.51 2.16 13.9 +20% Silicone oil 2.51 2.19 12.7 Reference Sample 2.51 2.23 11.2 70 90 110 130 150 170 190 210 -30 -20 -100102030 Varying Additive s (%) Hardness Value TDI (65%)TDI (60%)W a t e r (65%) Wate r (60%)A m ine (65%)A m i ne (60% ) S . O . (65% )S.O. (60%)Sil. (65%) Sil. (60%) Figure 4. Effect of varying additives on the hardness of the polyester sample. 7 12 17 22 27 32 37 42 47 -30 -20 -100102030 Varying Additive s (%) Com pr essi on Set V al ue (% ) TDI Water Amine S.O.Silicone Figure 5. Effect of varying additives on the compression set value of the polyester sample. plotted against the percentage composition of the various additives. It is observed that when the samples were in- dented to 65% of the thickness, the reference sample has the indentation hardness of 151 and when the samples were indented to 60% of the samples’ thickness the ref- erence sample has the indentation hardness of 167. For both cases, reducing the TDI content in the samples re- duces the hardness values of the polyester samples while increasing the TDI content of the samples increases the hardness values of the polyester samples. Conversely, reducing the water content increases the hardness values of the samples, while increasing the water content re- duces the hardness values of the polyester samples. For other additives, the highest value of indentation hardness in both cases is observed in the reference sample; reduc- ing/increasing the percentage content of other additives results in reduction of the indentation hardness values. From Table 5 and Figure 5, the compression set value of the reference sample is 11.2, reducing the TDI content in the polyester sharply increases the compression set values of the polyester samples increasing the TDI con- tent in the samples slightly reduces the compression set value and then begins to increase slightly. In the case of distil water, amine and silicone oil, the compression set values of the samples reduced with reduction in the con- tent of the respective additive and increased with in- crease of the same. The shape of the graph relating the relationship between the compression set of the sample and percentage content of stannous octoate is sinusoidal. With the exception of TDI, the range of compression set values resulting from varying the percentage content of the additives falls within acceptable range [17]. The com- pression set value obtained by reducing the percentage content of TDI was outside the acceptable range but as Open Access OJPChem 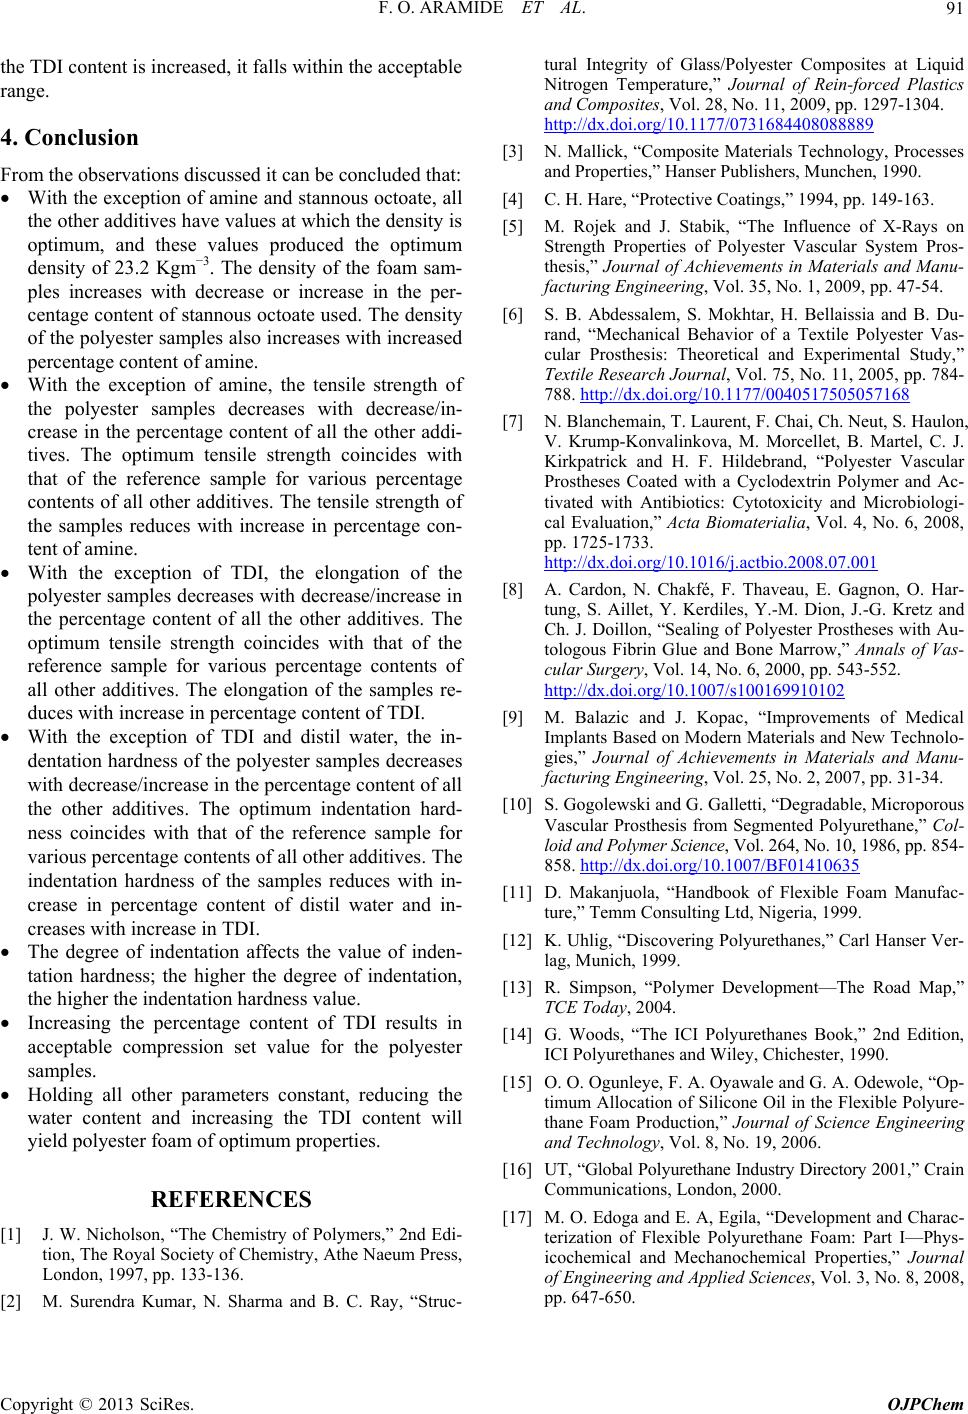 F. O. ARAMIDE ET AL. Copyright © 2013 SciRes. OJPChem 91 the TDI content is increased, it falls within the acceptable range. 4. Conclusion From the observations discussed it can be concluded that: With the exception of amine and stannous octoate, all the other additives have values at which the density is optimum, and these values produced the optimum density of 23.2 Kgm−3. The density of the foam sam- ples increases with decrease or increase in the per- centage content of stannous octoate used. The density of the polyester samples also increases with increased percentage content of amine. With the exception of amine, the tensile strength of the polyester samples decreases with decrease/in- crease in the percentage content of all the other addi- tives. The optimum tensile strength coincides with that of the reference sample for various percentage contents of all other additives. The tensile strength of the samples reduces with increase in percentage con- tent of amine. With the exception of TDI, the elongation of the polyester samples decreases with decrease/increase in the percentage content of all the other additives. The optimum tensile strength coincides with that of the reference sample for various percentage contents of all other additives. The elongation of the samples re- duces with increase in percentage content of TDI. With the exception of TDI and distil water, the in- dentation hardness of the polyester samples decreases with decrease/increase in the percentage content of all the other additives. The optimum indentation hard- ness coincides with that of the reference sample for various percentage contents of all other additives. The indentation hardness of the samples reduces with in- crease in percentage content of distil water and in- creases with increase in TDI. The degree of indentation affects the value of inden- tation hardness; the higher the degree of indentation, the higher the indentation hardness value. Increasing the percentage content of TDI results in acceptable compression set value for the polyester samples. Holding all other parameters constant, reducing the water content and increasing the TDI content will yield polyester foam of optimum properties. REFERENCES [1] J. W. Nicholson, “The Chemistry of Polymers,” 2nd Edi- tion, The Royal Society of Chemistry, Athe Naeum Press, London, 1997, pp. 133-136. [2] M. Surendra Kumar, N. Sharma and B. C. Ray, “Struc- tural Integrity of Glass/Polyester Composites at Liquid Nitrogen Temperature,” Journal of Rein-forced Plastics and Composites, Vol. 28, No. 11, 2009, pp. 1297-1304. http://dx.doi.org/10.1177/0731684408088889 [3] N. Mallick, “Composite Materials Technology, Processes and Properties,” Hanser Publishers, Munchen, 1990. [4] C. H. Hare, “Protective Coatings,” 1994, pp. 149-163. [5] M. Rojek and J. Stabik, “The Influence of X-Rays on Strength Properties of Polyester Vascular System Pros- thesis,” Journal of Achievements in Materials and Manu- facturing Engineering, Vol. 35, No. 1, 2009, pp. 47-54. [6] S. B. Abdessalem, S. Mokhtar, H. Bellaissia and B. Du- rand, “Mechanical Behavior of a Textile Polyester Vas- cular Prosthesis: Theoretical and Experimental Study,” Textile Research Journal, Vol. 75, No. 11, 2005, pp. 784- 788. http://dx.doi.org/10.1177/0040517505057168 [7] N. Blanchemain, T. Laurent, F. Chai, Ch. Neut, S. Haulon, V. Krump-Konvalinkova, M. Morcellet, B. Martel, C. J. Kirkpatrick and H. F. Hildebrand, “Polyester Vascular Prostheses Coated with a Cyclodextrin Polymer and Ac- tivated with Antibiotics: Cytotoxicity and Microbiologi- cal Evaluation,” Acta Biomaterialia, Vol. 4, No. 6, 2008, pp. 1725-1733. http://dx.doi.org/10.1016/j.actbio.2008.07.001 [8] A. Cardon, N. Chakfé, F. Thaveau, E. Gagnon, O. Har- tung, S. Aillet, Y. Kerdiles, Y.-M. Dion, J.-G. Kretz and Ch. J. Doillon, “Sealing of Polyester Prostheses with Au- tologous Fibrin Glue and Bone Marrow,” Annals of Vas- cular Surgery, Vol. 14, No. 6, 2000, pp. 543-552. http://dx.doi.org/10.1007/s100169910102 [9] M. Balazic and J. Kopac, “Improvements of Medical Implants Based on Modern Materials and New Technolo- gies,” Journal of Achievements in Materials and Manu- facturing Engineering, Vol. 25, No. 2, 2007, pp. 31-34. [10] S. Gogolewski and G. Galletti, “Degradable, Microporous Vascular Prosthesis from Segmented Polyurethane,” Col- loid and Polymer Science, Vol. 264, No. 10, 1986, pp. 854- 858. http://dx.doi.org/10.1007/BF01410635 [11] D. Makanjuola, “Handbook of Flexible Foam Manufac- ture,” Temm Consulting Ltd, Nigeria, 1999. [12] K. Uhlig, “Discovering Polyurethanes,” Carl Hanser Ver- lag, Munich, 1999. [13] R. Simpson, “Polymer Development—The Road Map,” TCE Today, 2004. [14] G. Woods, “The ICI Polyurethanes Book,” 2nd Edition, ICI Polyurethanes and Wiley, Chichester, 1990. [15] O. O. Ogunleye, F. A. Oyawale and G. A. Odewole, “Op- timum Allocation of Silicone Oil in the Flexible Polyure- thane Foam Production,” Journal of Science Engineering and Technology, Vol. 8, No. 19, 2006. [16] UT, “Global Polyurethane Industry Directory 2001,” Crain Communications, London, 2000. [17] M. O. Edoga and E. A, Egila, “Development and Charac- terization of Flexible Polyurethane Foam: Part I—Phys- icochemical and Mechanochemical Properties,” Journal of Engineering and Applied Sciences, Vol. 3, No. 8, 2008, pp. 647-650. |