

Paper Menu >>
Journal Menu >>
 International Journal of Nonferrous Metallurgy, 2013, 2, 121-127 http://dx.doi.org/10.4236/ijnm.2013.24018 Published Online October 2013 (http://www.scirp.org/journal/ijnm) Comparative Study of Gold Concentration by Elutriation from Different Precious Metal Bearing Ores Martín A. Encinas-Romero*, Guillermo Tiburcio-Munive, Jesús L. Valenzuela-García Departamento de Ingeniería Química y Metalurgia, Universidad de Sonora, Hermosillo, México Email: *[email protected] Received February 11, 2013; revised May 28, 2013; accepted June 10, 2013 Copyright © 2013 Martín A. Encinas-Romero et al. This is an open access article distributed under the Creative Commons Attribu- tion License, which permits unrestricted use, distribution, and reproduction in any medium, provided the original work is properly cited. ABSTRACT Conventional methods for precious metals gravimetric concentration involve equipment such as shaking tables, centri- fuging concentrators, jigs, trommels, or a combination of those. A less commonly used technique is elutriation, which represents an efficient, safe and low-cost method of separation. The goal of the present investigation was to make a comparative study of gold concentration by elutriation from different precious metal bearing ores: an oxide ore, a min- eral consisting of a sulfide matrix, a mineral in which the precious metals are free and disseminated and a slimy and clayey black sand material. The best recoveries of precious metals by elutriation were attained for the free disseminated ore and for the black sands, obtaining gold recoveries of 70% and 96% respectively, with appreciable ratios of concen- tration as well. Keywords: Elutriation; Precious Metals; Oxides, Sulfides; Free Gold; Black Sands 1. Introduction Elutriation is a particulate separation process in which an upward fluid stream generally air or water is used. The classification is made through a series of tubular or coni- cal vessels of increasing size, so that the flow rate de- creases successively from one of vessel to the next. Generally, an elutriator consists of one or more “sor- ting columns” in which the fluid flows upwards at a con- stant velocity. Feed particles introduced into the sorting column will be separated into two fractions, according to their terminal velocities calculated from Stoke’s Law. Particles with a terminal velocity smaller than the fluid mean flow rate will overflow, whereas those with a lar- ger velocity than the mean flow rate will sink toward the underflow. Elutriation is carried out until either no visual signs of a further separation are observed, or there is no change in the weight proportions of the products [1]. Elutriation with air is faster than elutriation with a li- quid. It also tends to be more efficient due to a lower air resistance to the particles fall, and to a less tendency for agglomeration of particles [1,2]. Elutriation with liquids is a process of separation or sub-separation of particulate of different sizes within a fluid stream, such as water. If the specific gravity of the feed material is uniform, the resulting grades of the product streams can be significantly uniform even for very narrow size ranges. On the other hand, a consider- able size variation of the product streams occurs when there are large differences in specific gravity or particle size of the feed even for narrow size ranges [3,4]. The main advantage of elutriation is the absence of moving parts. It represents an economic alternative as a method for precious metal concentration. The main dis- advantage of elutriation is related to the velocity profile, originating across the fluid stream due to the resistance imposed by the vessel walls. Thus, the particles are ex- posed to a fluid velocity field that varies with the radial position in the vessel. In fact, these particles are carried toward the region of high-speed flow due to the pressure differences on their surfaces. Consequently, the high- speed fluid captures these particles, reducing thereafter the efficiency of the elutriator [5]. There are no recent reports on the use of the elutriation with liquids as applied to upgrade precious metal miner- als. Therefore, as a part of a general project on the use of the non-conventional methods for precious metal gravity concentration, the following study was undertaken. The goal of this study is to compare the precious metals con- centration by elutriation as applied to different ores. Gold *Corresponding author. C opyright © 2013 SciRes. IJNM 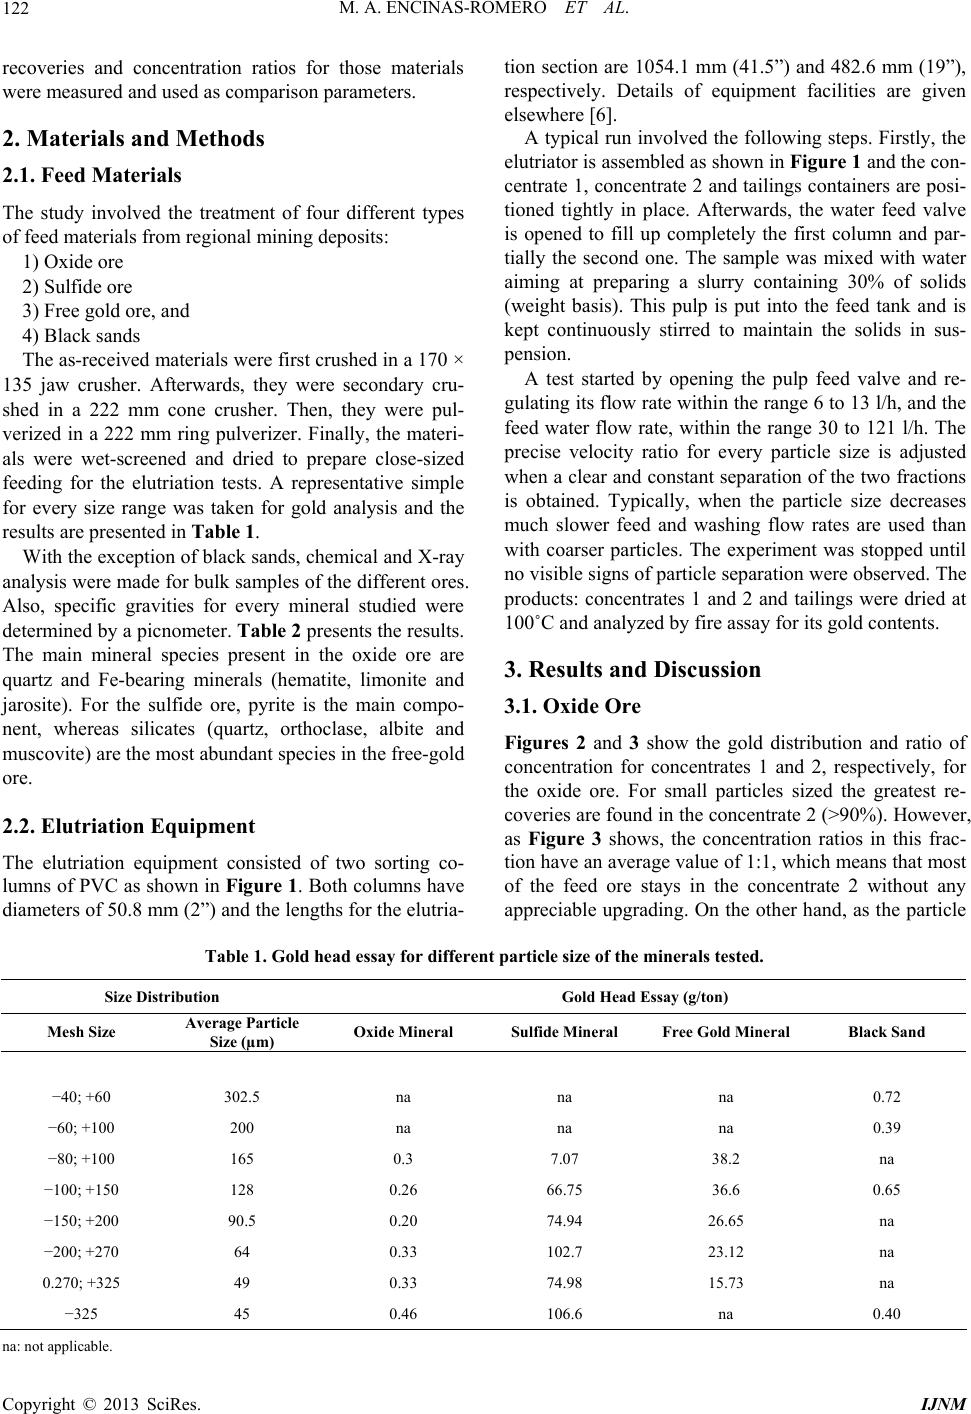 M. A. ENCINAS-ROMERO ET AL. 122 recoveries and concentration ratios for those materials were measured and used as comparison parameters. 2. Materials and Methods 2.1. Feed Materials The study involved the treatment of four different types of feed materials from regional mining deposits: 1) Oxide ore 2) Sulfide ore 3) Free gold ore, and 4) Black sands The as-received materials were first crushed in a 170 × 135 jaw crusher. Afterwards, they were secondary cru- shed in a 222 mm cone crusher. Then, they were pul- verized in a 222 mm ring pulverizer. Finally, the materi- als were wet-screened and dried to prepare close-sized feeding for the elutriation tests. A representative simple for every size range was taken for gold analysis and the results are presented in Table 1. With the exception of black sands, chemical and X-ray analysis were made for bulk samples of the different ores. Also, specific gravities for every mineral studied were determined by a picnometer. Table 2 presents the results. The main mineral species present in the oxide ore are quartz and Fe-bearing minerals (hematite, limonite and jarosite). For the sulfide ore, pyrite is the main compo- nent, whereas silicates (quartz, orthoclase, albite and muscovite) are the most abundant species in the free-gold ore. 2.2. Elutriation Equipment The elutriation equipment consisted of two sorting co- lumns of PVC as shown in Figure 1. Both columns have diameters of 50.8 mm (2”) and the lengths for the elutria- tion section are 1054.1 mm (41.5”) and 482.6 mm (19”), respectively. Details of equipment facilities are given elsewhere [6]. A typical run involved the following steps. Firstly, the elutriator is assembled as shown in Figure 1 and the con- centrate 1, concentrate 2 and tailings containers are posi- tioned tightly in place. Afterwards, the water feed valve is opened to fill up completely the first column and par- tially the second one. The sample was mixed with water aiming at preparing a slurry containing 30% of solids (weight basis). This pulp is put into the feed tank and is kept continuously stirred to maintain the solids in sus- pension. A test started by opening the pulp feed valve and re- gulating its flow rate within the range 6 to 13 l/h, and the feed water flow rate, within the range 30 to 121 l/h. The precise velocity ratio for every particle size is adjusted when a clear and constant separation of the two fractions is obtained. Typically, when the particle size decreases much slower feed and washing flow rates are used than with coarser particles. The experiment was stopped until no visible signs of particle separation were observed. The products: concentrates 1 and 2 and tailings were dried at 100˚C and analyzed by fire assay for its gold contents. 3. Results and Discussion 3.1. Oxide Ore Figures 2 and 3 show the gold distribution and ratio of concentration for concentrates 1 and 2, respectively, for the oxide ore. For small particles sized the greatest re- coveries are found in the concentrate 2 (>90%). However, as Figure 3 shows, the concentration ratios in this frac- tion have an average value of 1:1, which means that most of the feed ore stays in the concentrate 2 without any appreciable upgrading. On the other hand, as the particle Table 1. Gold head essay for different particle size of the minerals tested. Size Distribution Gold Head Essay (g/ton) Mesh Size Average Particle Size (µm) Oxide Mineral Sulfide Mineral Free Gold Mineral Black Sand −40; +60 302.5 na na na 0.72 −60; +100 200 na na na 0.39 −80; +100 165 0.3 7.07 38.2 na −100; +150 128 0.26 66.75 36.6 0.65 −150; +200 90.5 0.20 74.94 26.65 na −200; +270 64 0.33 102.7 23.12 na 0.270; +325 49 0.33 74.98 15.73 na −325 45 0.46 106.6 na 0.40 na: not applicable. Copyright © 2013 SciRes. IJNM 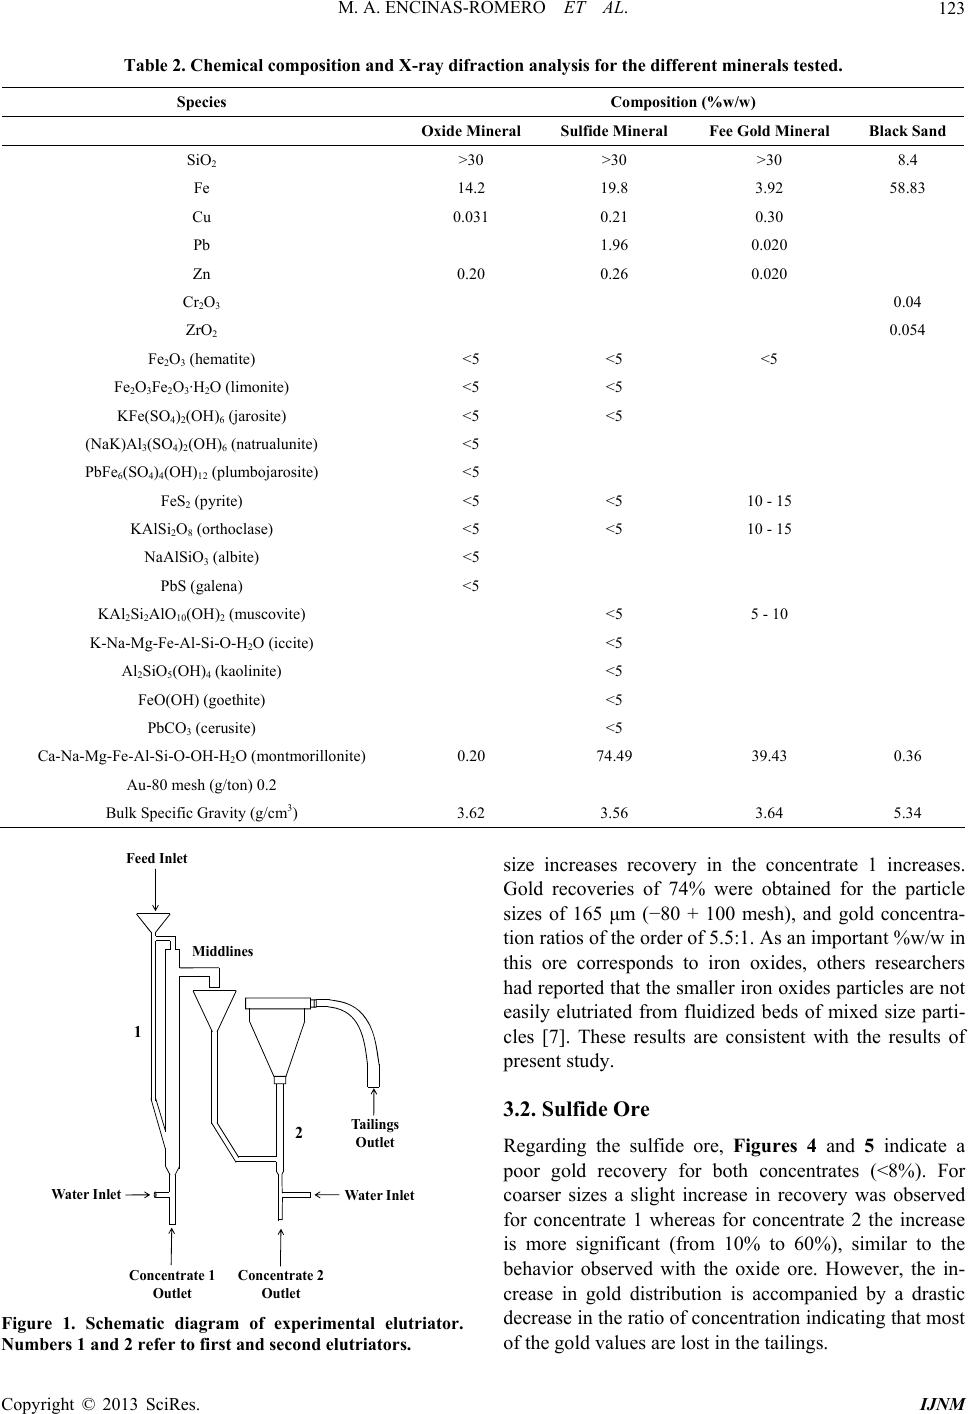 M. A. ENCINAS-ROMERO ET AL. 123 Table 2. Chemical composition and X-ray difraction analysis for the different minerals tested. Species Composition (%w/w) Oxide Mineral Sulfide Mineral Fee Gold Mineral Black Sand SiO2 >30 >30 >30 8.4 Fe 14.2 19.8 3.92 58.83 Cu 0.031 0.21 0.30 Pb 1.96 0.020 Zn 0.20 0.26 0.020 Cr2O3 0.04 ZrO2 0.054 Fe2O3 (hematite) <5 <5 <5 Fe2O3Fe2O3·H2O (limonite) <5 <5 KFe(SO4)2(OH)6 (jarosite) <5 <5 (NaK)Al3(SO4)2(OH)6 (natrualunite) <5 PbFe6(SO4)4(OH)12 (plumbojarosite) <5 FeS2 (pyrite) <5 <5 10 - 15 KAlSi2O8 (orthoclase) <5 <5 10 - 15 NaAlSiO3 (albite) <5 PbS (galena) <5 KAl2Si2AlO10(OH)2 (muscovite) <5 5 - 10 K-Na-Mg-Fe-Al-Si-O-H2O (iccite) <5 Al2SiO5(OH)4 (kaolinite) <5 FeO(OH) (goethite) <5 PbCO3 (cerusite) <5 Ca-Na-Mg-Fe-Al-Si-O-OH-H2O (montmorillonite) 0.20 74.49 39.43 0.36 Au-80 mesh (g/ton) 0.2 Bulk Specific Gravity (g/cm3) 3.62 3.56 3.64 5.34 Feed Inlet Middlines Water InletWater Inlet Concentrate 1 Outlet Concentrate 2 Outlet Tail ings Outlet 1 2 Figure 1. Schematic diagram of experimental elutriator. Numbers 1 and 2 refer to first and second elutriators. size increases recovery in the concentrate 1 increases. Gold recoveries of 74% were obtained for the particle sizes of 165 μm (−80 + 100 mesh), and gold concentra- tion ratios of the order of 5.5:1. As an important %w/w in this ore corresponds to iron oxides, others researchers had reported that the smaller iron oxides particles are not easily elutriated from fluidized beds of mixed size parti- cles [7]. These results are consistent with the results of present study. 3.2. Sulfide Ore Regarding the sulfide ore, Figures 4 and 5 indicate a poor gold recovery for both concentrates (<8%). For coarser sizes a slight increase in recovery was observed for concentrate 1 whereas for concentrate 2 the increase is more significant (from 10% to 60%), similar to the behavior observed with the oxide ore. However, the in- crease in gold distribution is accompanied by a drastic decrease in the ratio of concentration indicating that most f the gold values are lost in the tailings. o Copyright © 2013 SciRes. IJNM 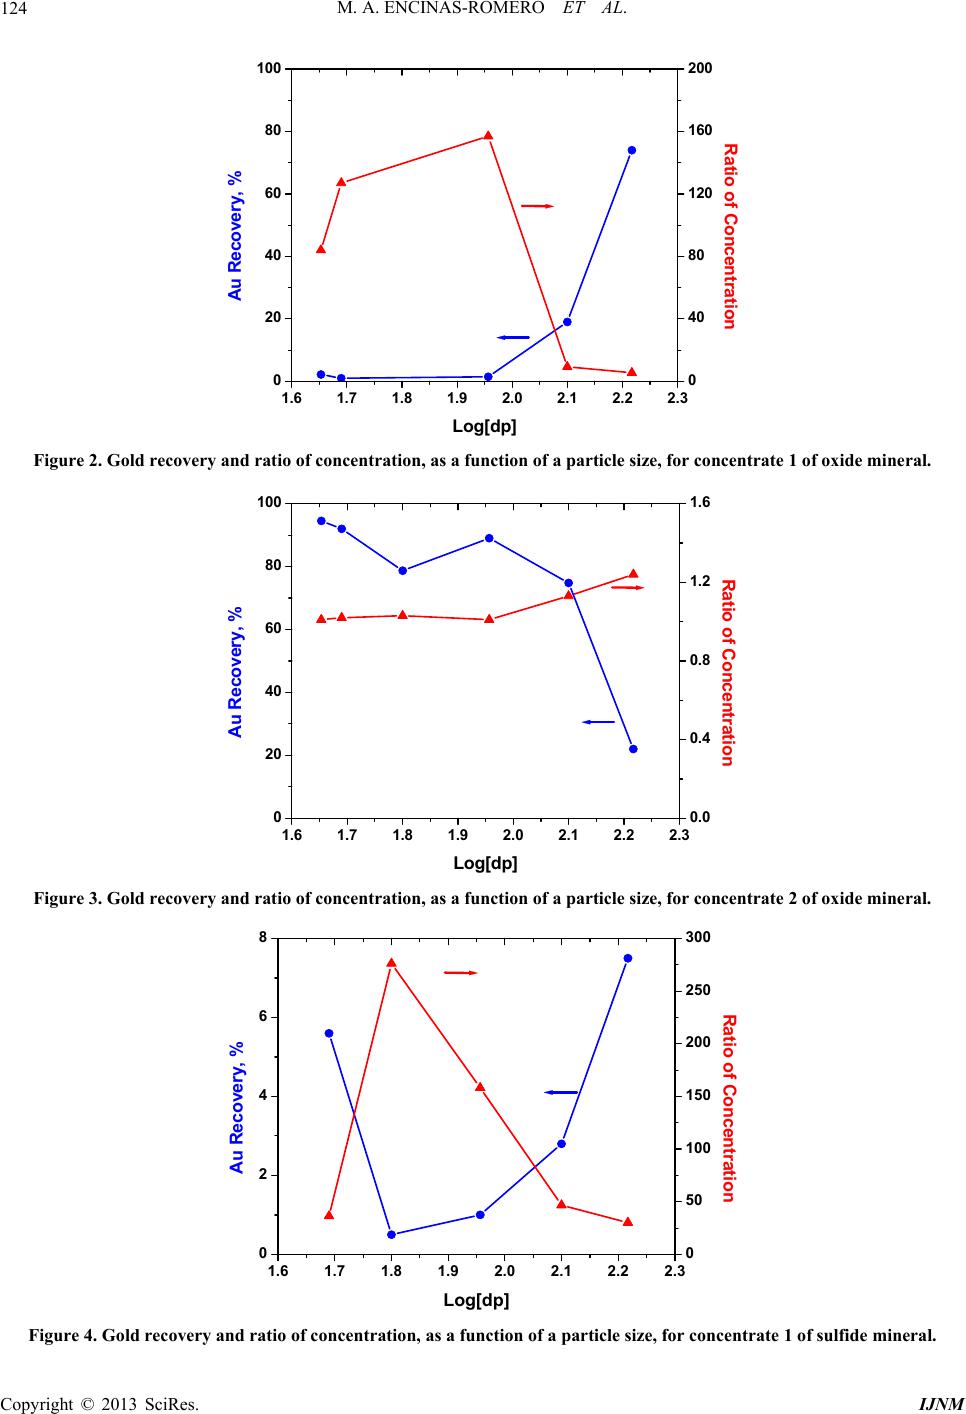 M. A. ENCINAS-ROMERO ET AL. 124 1.6 1.7 1.8 1.9 2.0 2.1 2.2 2.3 0 20 40 60 80 100 Log[dp] Au Recovery, % 0 40 80 120 160 200 Ratio of Concentration Figure 2. Gold recovery and ratio of concentration, as a function of a particle size, for concentrate 1 of oxide mineral. 1.6 1.7 1.8 1.9 2.0 2.1 2.2 2.3 0 20 40 60 80 100 Log[dp] Au Recovery, % 0.0 0.4 0.8 1.2 1.6 Ratio of Concentration Figure 3. Gold recovery and ratio of concentration, as a function of a particle size, for concentrate 2 of oxide mineral. 1.61.71.81.92.02.12.22.3 0 2 4 6 8 Log[dp] Au Recovery, % 0 50 100 150 200 250 300 Ratio of Concentration Figure 4. Gold recovery and ratio of concentration, as a function of a particle size, for concentrate 1 of sulfide mineral. Copyright © 2013 SciRes. IJNM 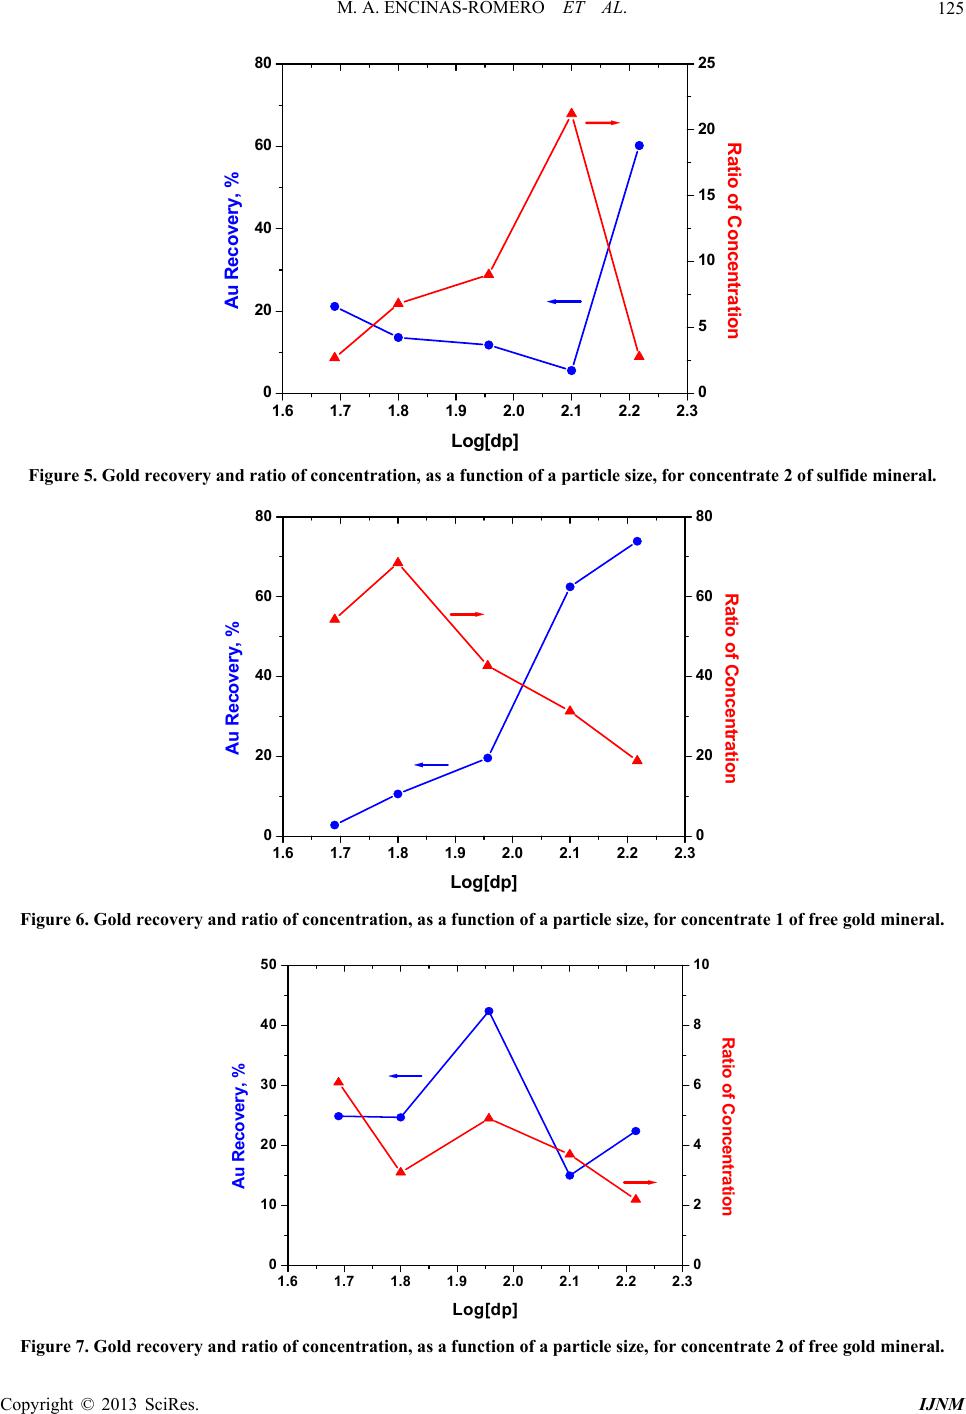 M. A. ENCINAS-ROMERO ET AL. 125 1.61.71.81.92.02.1 2.22.3 0 20 40 60 80 Log[dp] Au Recovery, % 0 5 10 15 20 25 Ratio of Concentration Figure 5. Gold recovery and ratio of concentration, as a function of a particle size, for concentrate 2 of sulfide mineral. 1.6 1.7 1.8 1.9 2.0 2.1 2.2 2.3 0 20 40 60 80 Log[dp] Au Recovery, % 0 20 40 60 80 Ratio of Concentration Figure 6. Gold recovery and ratio of concentration, as a function of a particle size, for concentrate 1 of free gold mineral. 1.61.7 1.81.92.02.1 2.22.3 0 10 20 30 40 50 Log[dp] Au Recovery, % 0 2 4 6 8 10 Ratio of Concentration Figure 7. Gold recovery and ratio of concentration, as a function of a particle size, for concentrate 2 of free gold mineral. Copyright © 2013 SciRes. IJNM 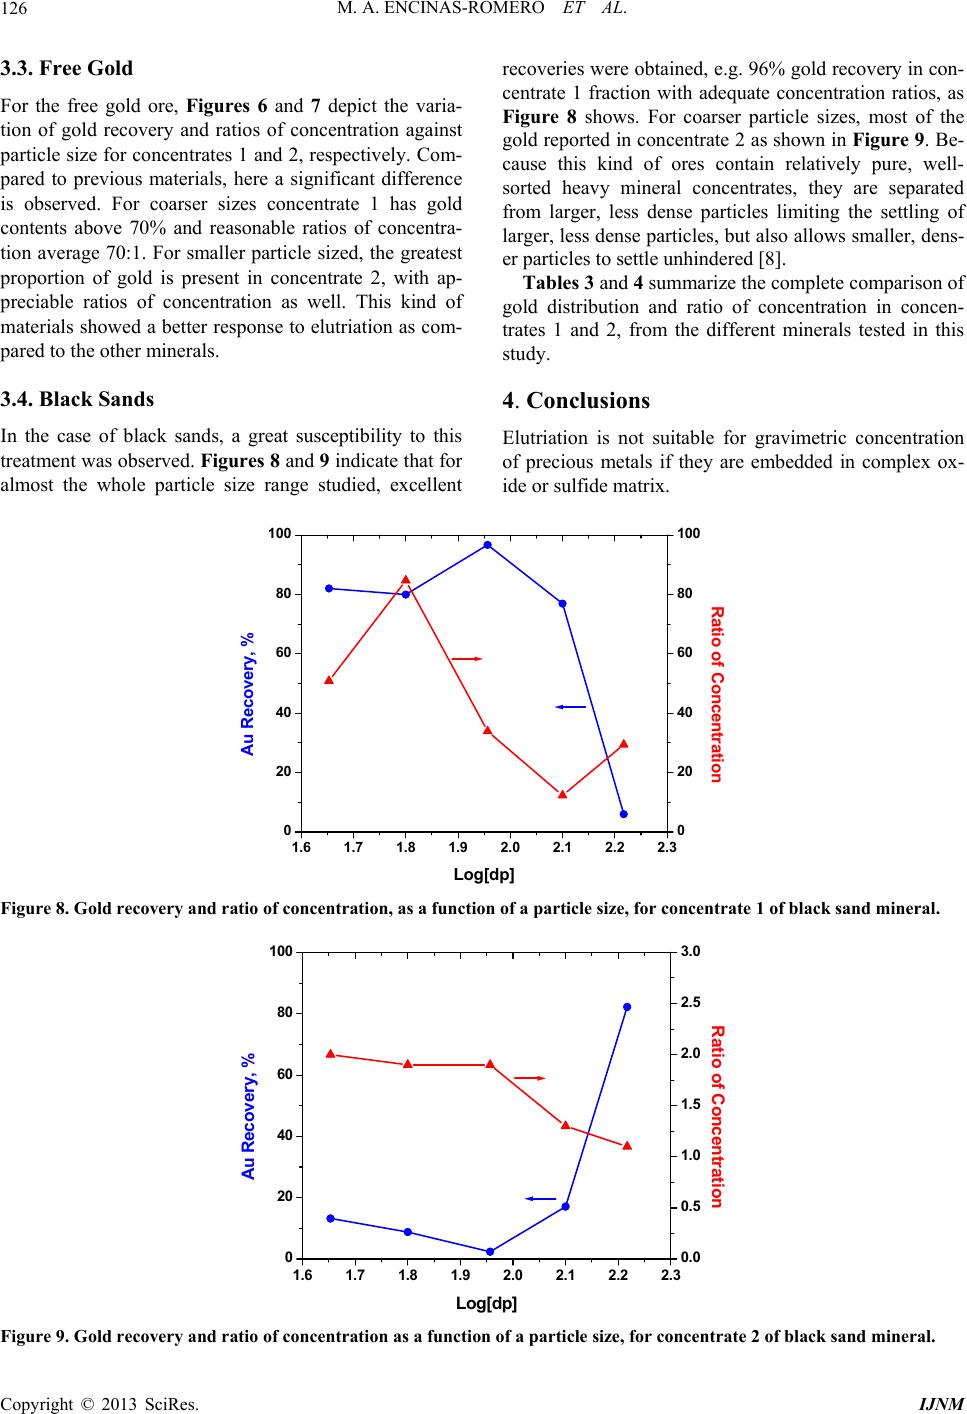 M. A. ENCINAS-ROMERO ET AL. Copyright © 2013 SciRes. IJNM 126 3.3. Free Gold recoveries were obtained, e.g. 96% gold recovery in con- centrate 1 fraction with adequate concentration ratios, as Figure 8 shows. For coarser particle sizes, most of the gold reported in concentrate 2 as shown in Figure 9. Be- cause this kind of ores contain relatively pure, well- sorted heavy mineral concentrates, they are separated from larger, less dense particles limiting the settling of larger, less dense particles, but also allows smaller, dens- er particles to settle unhindered [8]. For the free gold ore, Figures 6 and 7 depict the varia- tion of gold recovery and ratios of concentration against particle size for concentrates 1 and 2, respectively. Com- pared to previous materials, here a significant difference is observed. For coarser sizes concentrate 1 has gold contents above 70% and reasonable ratios of concentra- tion average 70:1. For smaller particle sized, the greatest proportion of gold is present in concentrate 2, with ap- preciable ratios of concentration as well. This kind of materials showed a better response to elutriation as com- pared to the other minerals. Tables 3 and 4 summarize the complete comparison of gold distribution and ratio of concentration in concen- trates 1 and 2, from the different minerals tested in this study. 4. Conclusions 3.4. Black Sands In the case of black sands, a great susceptibility to this treatment was observed. Figures 8 and 9 indicate that for almost the whole particle size range studied, excellent Elutriation is not suitable for gravimetric concentration of precious metals if they are embedded in complex ox- ide or sulfide matrix. 1.6 1.7 1.8 1.9 2.0 2.1 2.22.3 0 20 40 60 80 100 Log[dp] Au Recovery, % 0 20 40 60 80 100 Ratio of Concentration Figure 8. Gold recovery and ratio of concentration, as a function of a particle size, for concentrate 1 of black sand mineral. 1.6 1.71.8 1.9 2.0 2.1 2.2 2.3 0 20 40 60 80 100 Log[dp] Au Recovery, % 0.0 0.5 1.0 1.5 2.0 2.5 3.0 Ratio of Conc en tration Figure 9. Gold recovery and ratio of concentration as a function of a particle size, for concentrate 2 of black sand mineral. 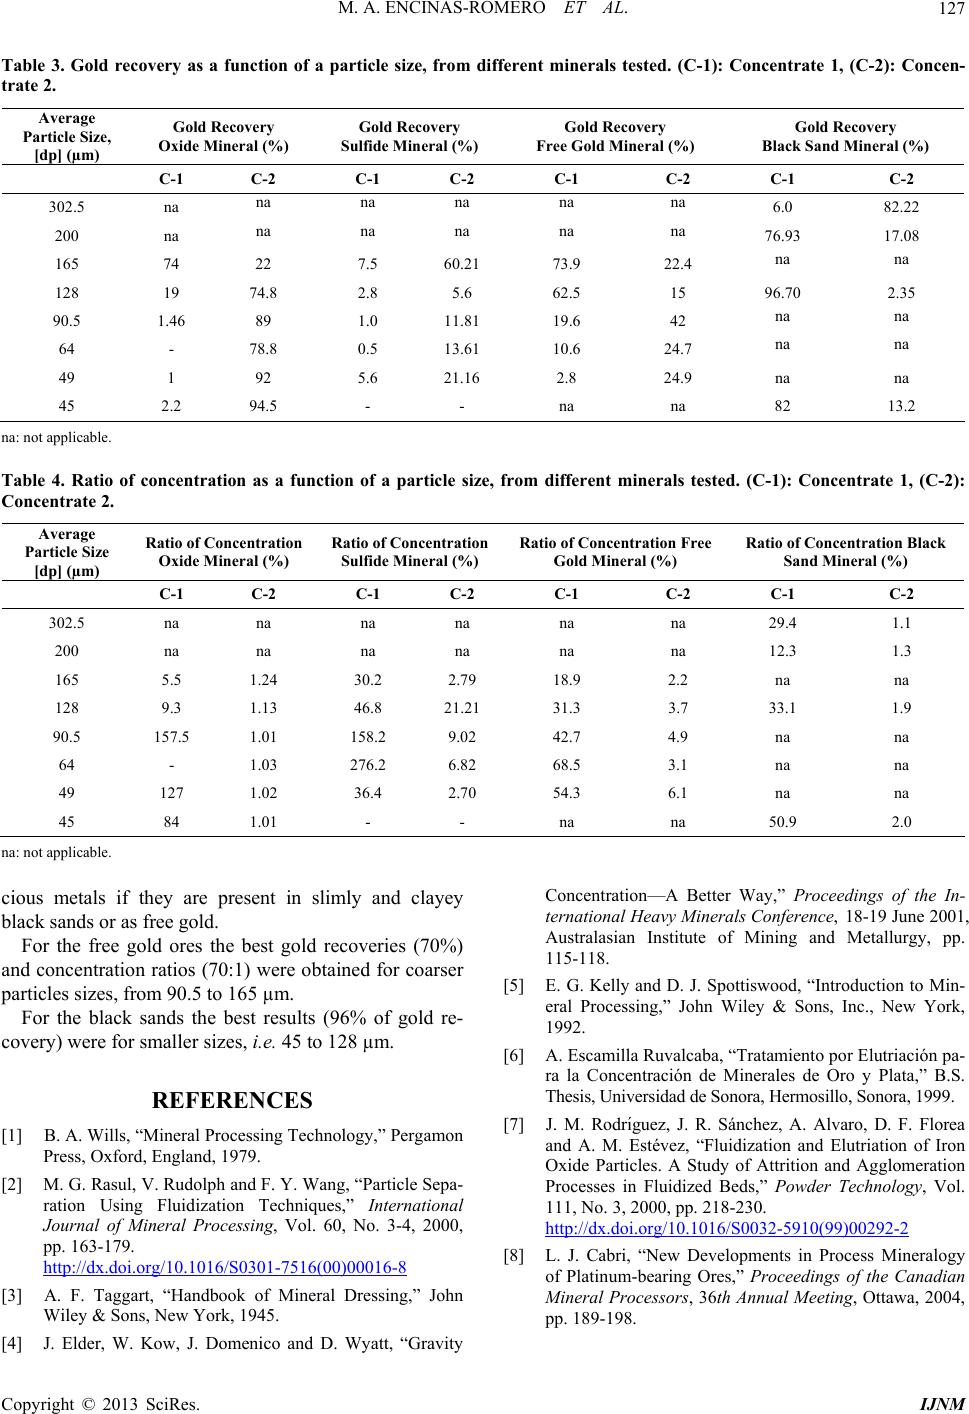 M. A. ENCINAS-ROMERO ET AL. 127 Table 3. Gold recovery as a function of a particle size, from different minerals tested. (C-1): Concentrate 1, (C-2): Concen- trate 2. Average Particle Size, [dp] (µm) Gold Recovery Oxide Mineral (%) Gold Recovery Sulfide Mineral (%) Gold Recovery Free Gold Mineral (%) Gold Recovery Black Sand Mineral (%) C-1 C-2 C-1 C-2 C-1 C-2 C-1 C-2 302.5 na na na na na na 6.0 82.22 200 na na na na na na 76.93 17.08 165 74 22 7.5 60.21 73.9 22.4 na na 128 19 74.8 2.8 5.6 62.5 15 96.70 2.35 90.5 1.46 89 1.0 11.81 19.6 42 na na 64 - 78.8 0.5 13.61 10.6 24.7 na na 49 1 92 5.6 21.16 2.8 24.9 na na 45 2.2 94.5 - - na na 82 13.2 na: not applicable. Table 4. Ratio of concentration as a function of a particle size, from different minerals tested. (C-1): Concentrate 1, (C-2): Concentrate 2. Average Particle Size [dp] (µm) Ratio of Concentration Oxide Mineral (%) Ratio of Concentration Sulfide Mineral (%) Ratio of Concentration Free Gold Mineral (%) Ratio of Concentration Black Sand Mineral (%) C-1 C-2 C-1 C-2 C-1 C-2 C-1 C-2 302.5 na na na na na na 29.4 1.1 200 na na na na na na 12.3 1.3 165 5.5 1.24 30.2 2.79 18.9 2.2 na na 128 9.3 1.13 46.8 21.21 31.3 3.7 33.1 1.9 90.5 157.5 1.01 158.2 9.02 42.7 4.9 na na 64 - 1.03 276.2 6.82 68.5 3.1 na na 49 127 1.02 36.4 2.70 54.3 6.1 na na 45 84 1.01 - - na na 50.9 2.0 na: not applicable. cious metals if they are present in slimly and clayey black sands or as free gold. For the free gold ores the best gold recoveries (70%) and concentration ratios (70:1) were obtained for coarser particles sizes, from 90.5 to 165 µm. For the black sands the best results (96% of gold re- covery) were for smaller sizes, i.e. 45 to 128 µm. REFERENCES [1] B. A. Wills, “Mineral Processing Technology,” Pergamon Press, Oxford, England, 1979. [2] M. G. Rasul, V. Rudolph and F. Y. Wang, “Particle Sepa- ration Using Fluidization Techniques,” International Journal of Mineral Processing, Vol. 60, No. 3-4, 2000, pp. 163-179. http://dx.doi.org/10.1016/S0301-7516(00)00016-8 [3] A. F. Taggart, “Handbook of Mineral Dressing,” John Wiley & Sons, New York, 1945. [4] J. Elder, W. Kow, J. Domenico and D. Wyatt, “Gravity Concentration—A Better Way,” Proceedings of the In- ternational Heavy Minerals Conference, 18-19 June 2001, Australasian Institute of Mining and Metallurgy, pp. 115-118. [5] E. G. Kelly and D. J. Spottiswood, “Introduction to Min- eral Processing,” John Wiley & Sons, Inc., New York, 1992. [6] A. Escamilla Ruvalcaba, “Tratamiento por Elutriación pa- ra la Concentración de Minerales de Oro y Plata,” B.S. Thesis, Universidad de Sonora, Hermosillo, Sonora, 1999. [7] J. M. Rodrı́guez, J. R. Sánchez, A. Alvaro, D. F. Florea and A. M. Estévez, “Fluidization and Elutriation of Iron Oxide Particles. A Study of Attrition and Agglomeration Processes in Fluidized Beds,” Powder Technology, Vol. 111, No. 3, 2000, pp. 218-230. http://dx.doi.org/10.1016/S0032-5910(99)00292-2 [8] L. J. Cabri, “New Developments in Process Mineralogy of Platinum-bearing Ores,” Proceedings of the Canadian Mineral Processors, 36th Annual Meeting, Ottawa, 2004, pp. 189-198. Copyright © 2013 SciRes. IJNM |