

Paper Menu >>
Journal Menu >>
 Journal of Sustainable Bioenergy Systems, 2013, 3, 202-208 http://dx.doi.org/10.4236/jsbs.2013.33028 Published Online September 2013 (http://www.scirp.org/journal/jsbs) Quantifying Hydrologic and Water Quality Responses to Bioenergy Crops in Town Creek Watershed in Mississippi Prem B. Parajuli, Sarah E. Duffy Department of Agricultural and Biological Engineering, Mississippi State University, Starkville, USA Email: [email protected] Received June 10, 2013; revised July 11, 2013; accepted July 28, 2013 Copyright © 2013 Prem B. Parajuli, Sarah E. Duffy. This is an open access article distributed under the Creative Commons Attribu- tion License, which permits unrestricted use, distribution, and reproduction in any medium, provided the original work is properly cited. ABSTRACT Bioenergy crops are considered as a feedstock source, which can be grown in marginal soils. However, these crops may have different levels of crop yield potential and environmental benefits. The objectives of this study were to model and compare the effects of four bioenergy crops (corn—Zea mays, soybean—Glycine max (L.) Merr., miscanthus—Miscan- thus-giganteus, and switchgrass—Panicum virgatum) in the Town Creek watershed (TCW) in northeast Mississippi using the Soil and Water Assessment Tool (SWAT) model. The calibrated SWAT model for TCW was used to quantify impacts to streamflow, crop yield, and sediment yield. The SWAT model reasonably (<−12%) predicted long-term (January, 1990 to September, 2009) monthly streamflow (25.88 m3·s−1) from the TCW when compared with the USGS observed stream flow (29.34 m3·s−1). In addition, model reasonably predicted (±6%) average annual corn yield (4.66 Mg·ha−1) and soybean yield (1.42 Mg·ha−1) as compared to National Agricultural Statistics Service (NASS) reported average annual corn (4.96 Mg·ha−1) and soybean yield (1.34 Mg·ha−1) from the watershed. Further, the model simulated results from this study determined that long-term average annual feedstock yield from TCW is the greatest when grow- ing miscanthus grass (817,732 Mg) followed by switchgrass (477,317 Mg), corn (236,132 Mg), and soybeans (65,235 Mg). The SWAT model predicted the greatest annual average sediment yield (6.62 Mg·ha−1) from continuous corn crop scenario while the perennial grasses (switchgrass and miscanthus) had the lowest sediment yield (2.91 Mg·ha−1 and 3.20 Mg·ha−1 respectively). Overall, producing a perennial grass in the TCW would provide the largest biomass feedstock source with the least environmental impact. The results of this study will help to compare benefits of landuse change practices in bioenergy and water quality. Keywords: Perennial Grass; Water Quality; Watershed; SWAT 1. Introduction There has been a worldwide increase in energy consump- tion during the twentieth century, and it is expected to increase by at least 50 percent in the next 20 years [1]. Consequently, there has been an exponential increase in atmospheric carbon dioxide (CO2) concentrations [2]. Global dependence on oil, coal, and natural gas has al- ready led to several crises directly caused by shortages or sudden price spikes. These events have been tocsins of the shaky and limited future of fossil fuels. At present, there is no dire shortage of fossil fuels. However, the long-term availability and desirability of using fossil fuels are a matter of concern. Bioenergy crops are one of the renewable energy sources of the future [3], and are increasingly considered as the key to any strategy for reduction of fossil fuel dependence, energy independence, and mitigation for global climate change [4]. Bioenergy crops are simply defined as any plant material used to produce bioenergy, which is in turn defined broadly as any conversion of biomass materials into an energy source, such as power, heat, or liquid biofuels. Bioenergy crops produce a large volume of biomass, have high energy potential, and can be grown in marginal soils [5]. To be practical, bioenergy crops must not only be viable feed- stock, they must also be attractive to farmers to choose to grow in place of conventional crops [5]. Initial forays in biofuel production focused on food crops, most commonly corn and soybeans. However, using food crops as fuel sources created concern over competition. Thus, second generation bioenergy produc- tion has shifted focus to use cellulosic material as feed- stock instead [4,6]. Perennial grasses such as switchgrass and miscanthus have garnered increased attention and are the two leading cellulosic biofuels [4,5,7-11]. Cellulosic C opyright © 2013 SciRes. JSBS  P. B. PARAJULI, S. E. DUFFY 203 biomass yields more fuel per unit land area with less ag- ricultural input such as fertilizer and pesticides than that is achieved in grain-based ethanol production [4,7,10,12], which offers forage material [13], and is proven to be beneficial for water quality [14]. In addition to their promise as energy sources, bio- energy crops, especially grasses, they have the capacity to serve as important carbon sinks which could lead to no- table offset of greenhouse gases [15]. The need for agri- cultural involvement in greenhouse gas mitigation via terrestrial carbon sequestration has been widely recog- nized since the 1990s [3]. A plant removes CO2 from the atmosphere through photosynthesis whereby the CO2 is then broken down into carbon and oxygen. The oxygen is re-released to the atmosphere as waste while the carbon is used for food and incorporated into the plant. As plants die or are harvested, the carbon-based biomass (such as leaves and stems) is converted into biofuel, and the left- over plant residue (such as roots and stalks) decay in the soil whereby the carbon becomes soil organic carbon (SOC). In fact, soil organic carbon constitutes more than twice as much stored carbon as that of the earth’s vegeta- tion [16]. Among all of the benefits associated with bioenergy crop production, uncertainties linger [17]. It is important to consider all of the implications associated with land use at varying spatial and temporal scales. Realistic pro- duction potential of the candidate bioenergy crops in different regions should be assessed on the state as a whole and on a watershed scale. Additionally it is critical to determine the impact of traditional crops versus cellu- losic bioenergy crops on soil and water quality, as well as their impact on overall watershed health. Research should also focus on the long-term effects on carbon se- questration and greenhouse gas emissions. Once the benefits and consequences have been satisfactorily and thoroughly researched, an economic analysis should be performed to determine the feasibility of large or small- scale bioenergy crop production. Predicting how changes in the agricultural landscape will influence water quality is a complex issue that re- quires an appropriate modeling tool capable of represent- ing important aspects of the system [17]. The model se- lected for this study depended on three factors: 1) its ability to represent watershed influences on water quality at varying spatial scales; 2) its ability to simulate water- shed influences of natural, agricultural, and urban land as well as bioenergy crops; and 3) its ability to accurately predict the yields of bioenergy crops. Therefore, the model used in this study was the Soil and Water Assess- ment Tool (SWAT) [18]. SWAT is a computational hy- drologic model that has been used extensively to effec- tively assess the potential watershed-scale impacts of land management changes across various temporal scales [19] and has shown promise for biofuel-related applica- tions [14,17,20,21]. There is only a limited body of lit- erature available for the second generation bioenergy crops. Switchgrass and miscanthus have only recently been studied using SWAT [14,21]. The objectives of this study were to model and com- pare the effects of four bioenergy crops in the Town Creek watershed (TCW) in northeast Mississippi using the SWAT model. The calibrated SWAT model for TCW was used to identify impacts to streamflow, crop yields, and sediment yield if all land uses designated as cropland (corn, cotton, hay, soybeans and winter wheat) were converted to corn, soybeans, switchgrass or miscanthus. These four scenarios were compared to values predicted using the baseline model which models current water- shed conditions and assumes annual rotation of corn and soybeans, as well as a diversity of other crops throughout the watershed. 2. Materials and Methods 2.1. Study Area The Town Creek watershed (TCW) located in northeast Mississippi was the study area of this study. The TCW is estimated to have about 177,500 ha area (Figure 1), which is a part of the Upper Tombigbee River Basin. The majority of the TCW is located within the Lee, Union, and Pontotoc counties. However, the watershed also has some areas in Chickasaw, Monroe and Itawamba coun- ties. Based on climate data from 1990 to 2009 [22], av- erage annual rainfall is 154 cm with average annual temperature of 16.3˚C. The TCW is known as agricul- tural watershed with about 1,000 farms of different sizes [23]. The Town Creek runs from the watershed and drains near Nettleton, MS (USGS-02436500) [24]. 2.2. Model Description The SWAT model is freely available from the public domain in different versions. This study utilized Arc- SWAT version of the model, which is interfaced with ArcGIS 9.3. The SWAT model is a watershed scale hy- drological model that simulates watershed processes on three time steps (daily, monthly, yearly). SWAT model predicts surface runoff, sediment yields, potential evapo- transpiration, and crop yields [18]. More detail model algorithms are described in the model documentation [18,25]. This study used the Curve Number (CN) method to estimate surface flow [26]. The SWAT model divides a watershed into sub-watersheds, which are connected by a stream network. Each sub-watershed is sub-divided in to several hydrologic response units (HRUs), which are unique spatial units of soils, land use, and topography. The SWAT simulations and calculations are first per- formed at the HRU and sub-watershed levels, and then Copyright © 2013 SciRes. JSBS 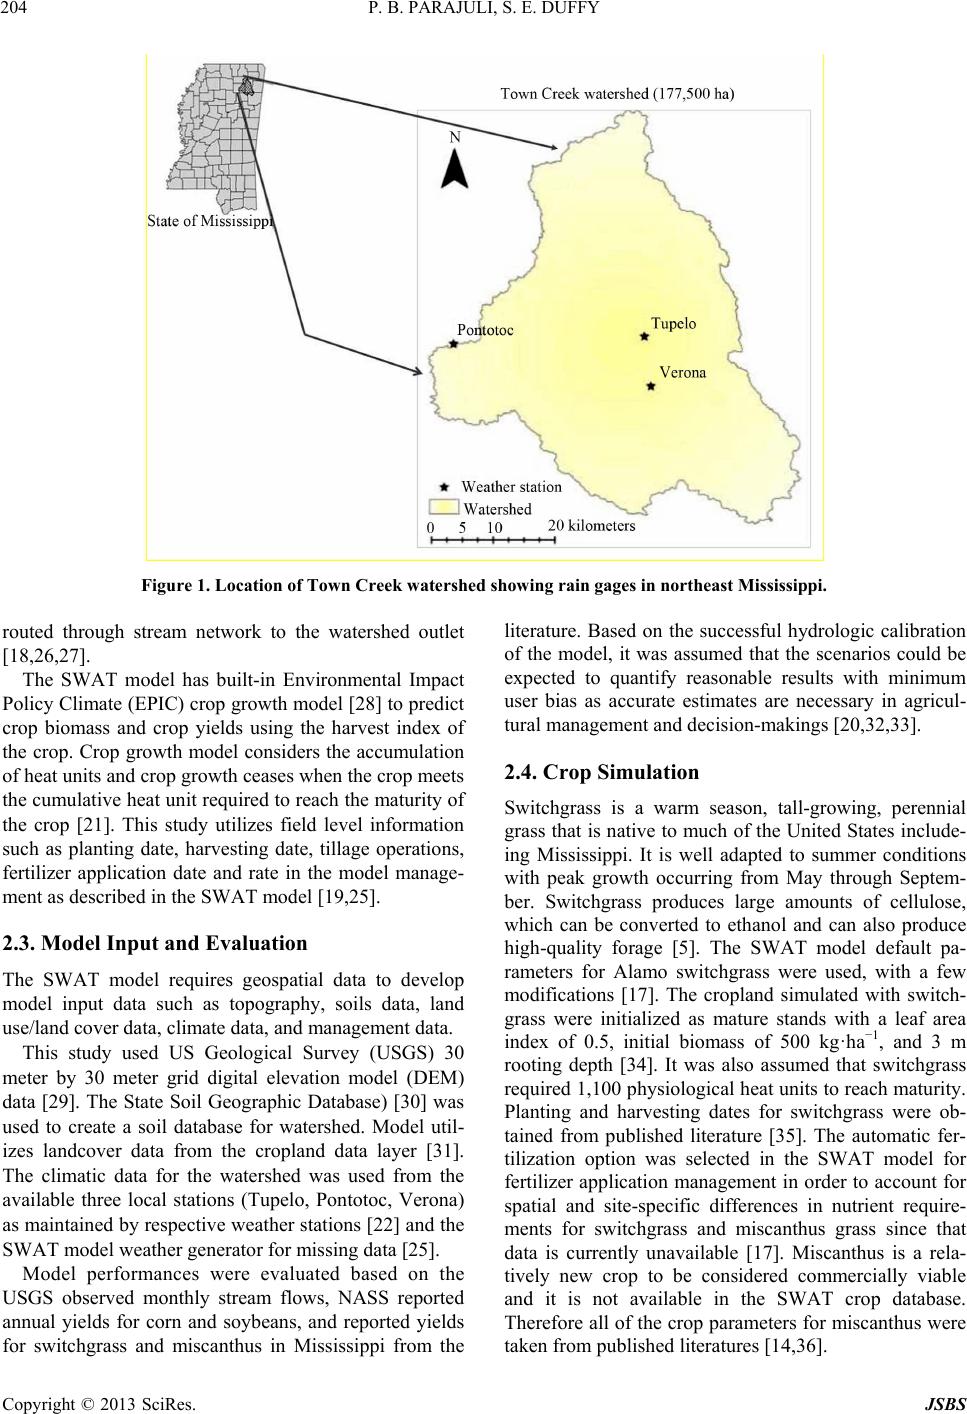 P. B. PARAJULI, S. E. DUFFY Copyright © 2013 SciRes. JSBS 204 Figure 1. Location of Town Creek watershed showing rain gages in northeast Mississippi. literature. Based on the successful hydrologic calibration of the model, it was assumed that the scenarios could be expected to quantify reasonable results with minimum user bias as accurate estimates are necessary in agricul- tural management and decision-makings [20,32,33]. routed through stream network to the watershed outlet [18,26,27]. The SWAT model has built-in Environmental Impact Policy Climate (EPIC) crop growth model [28] to predict crop biomass and crop yields using the harvest index of the crop. Crop growth model considers the accumulation of heat units and crop growth ceases when the crop meets the cumulative heat unit required to reach the maturity of the crop [21]. This study utilizes field level information such as planting date, harvesting date, tillage operations, fertilizer application date and rate in the model manage- ment as described in the SWAT model [19,25]. 2.4. Crop Simulation Switchgrass is a warm season, tall-growing, perennial grass that is native to much of the United States include- ing Mississippi. It is well adapted to summer conditions with peak growth occurring from May through Septem- ber. Switchgrass produces large amounts of cellulose, which can be converted to ethanol and can also produce high-quality forage [5]. The SWAT model default pa- rameters for Alamo switchgrass were used, with a few modifications [17]. The cropland simulated with switch- grass were initialized as mature stands with a leaf area index of 0.5, initial biomass of 500 kg·ha−1, and 3 m rooting depth [34]. It was also assumed that switchgrass required 1,100 physiological heat units to reach maturity. Planting and harvesting dates for switchgrass were ob- tained from published literature [35]. The automatic fer- tilization option was selected in the SWAT model for fertilizer application management in order to account for spatial and site-specific differences in nutrient require- ments for switchgrass and miscanthus grass since that data is currently unavailable [17]. Miscanthus is a rela- tively new crop to be considered commercially viable and it is not available in the SWAT crop database. Therefore all of the crop parameters for miscanthus were taken from published literatures [14,36]. 2.3. Model Input and Evaluation The SWAT model requires geospatial data to develop model input data such as topography, soils data, land use/land cover data, climate data, and management data. This study used US Geological Survey (USGS) 30 meter by 30 meter grid digital elevation model (DEM) data [29]. The State Soil Geographic Database) [30] was used to create a soil database for watershed. Model util- izes landcover data from the cropland data layer [31]. The climatic data for the watershed was used from the available three local stations (Tupelo, Pontotoc, Verona) as maintained by respective weather stations [22] and the SWAT model weather generator for missing data [25]. Model performances were evaluated based on the USGS observed monthly stream flows, NASS reported annual yields for corn and soybeans, and reported yields for switchgrass and miscanthus in Mississippi from the 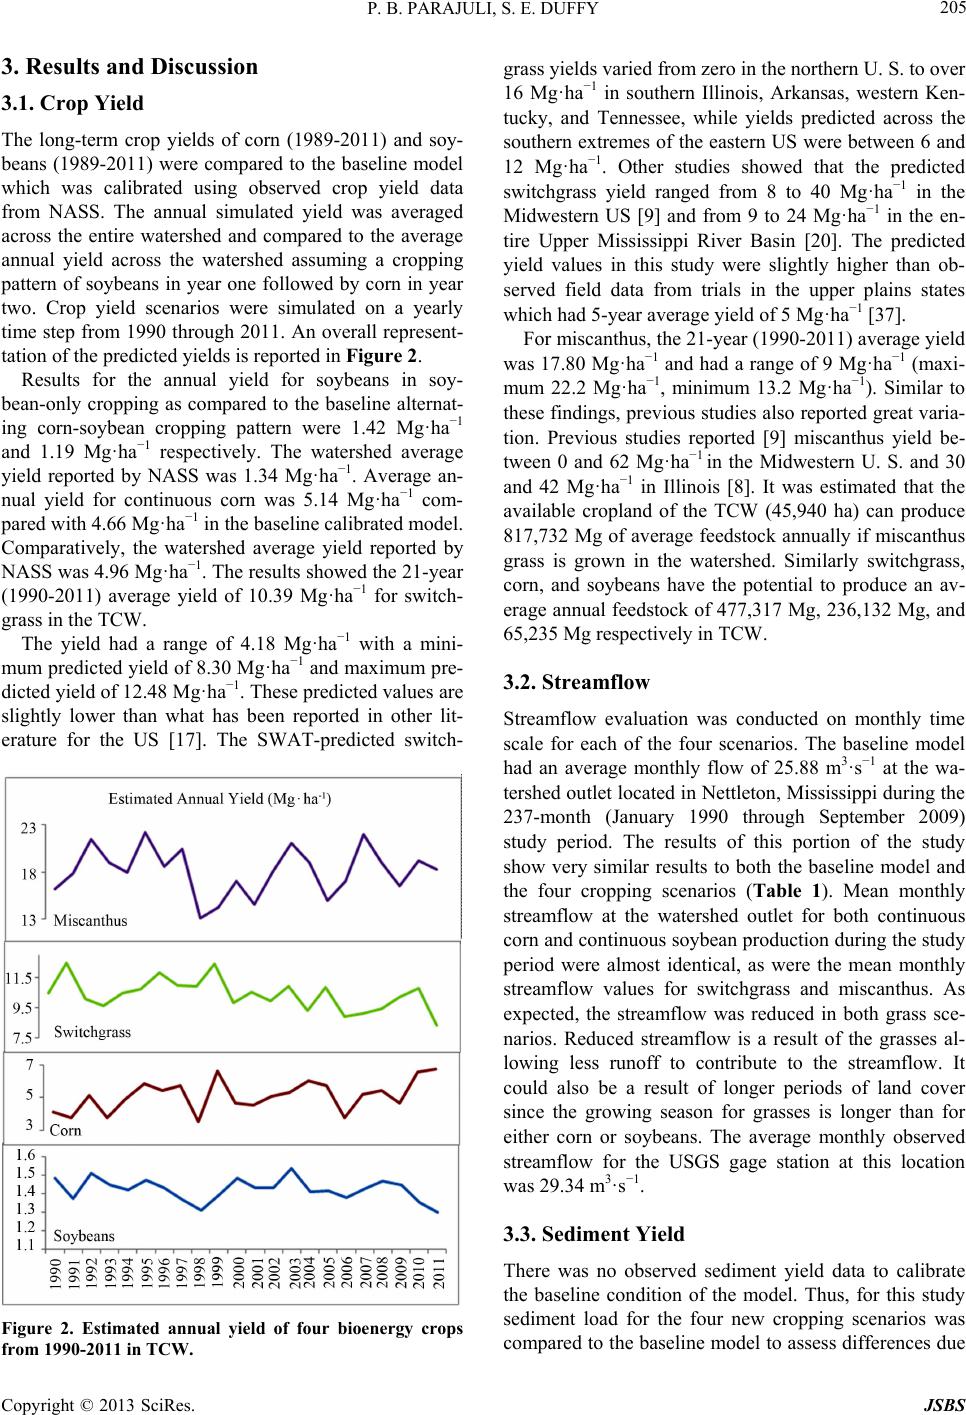 P. B. PARAJULI, S. E. DUFFY 205 3. Results and Discussion 3.1. Crop Yield The long-term crop yields of corn (1989-2011) and soy- beans (1989-2011) were compared to the baseline model which was calibrated using observed crop yield data from NASS. The annual simulated yield was averaged across the entire watershed and compared to the average annual yield across the watershed assuming a cropping pattern of soybeans in year one followed by corn in year two. Crop yield scenarios were simulated on a yearly time step from 1990 through 2011. An overall represent- tation of the predicted yields is reported in Figure 2. Results for the annual yield for soybeans in soy- bean-only cropping as compared to the baseline alternat- ing corn-soybean cropping pattern were 1.42 Mg·ha−1 and 1.19 Mg·ha−1 respectively. The watershed average yield reported by NASS was 1.34 Mg·ha−1. Average an- nual yield for continuous corn was 5.14 Mg·ha−1 com- pared with 4.66 Mg·ha−1 in the baseline calibrated model. Comparatively, the watershed average yield reported by NASS was 4.96 Mg·ha−1. The results showed the 21-year (1990-2011) average yield of 10.39 Mg·ha−1 for switch- grass in the TCW. The yield had a range of 4.18 Mg·ha−1 with a mini- mum predicted yield of 8.30 Mg·ha−1 and maximum pre- dicted yield of 12.48 Mg·ha−1. These predicted values are slightly lower than what has been reported in other lit- erature for the US [17]. The SWAT-predicted switch- Figure 2. Estimated annual yield of four bioenergy crops from 1990-2011 in TCW. grass yields varied from zero in the northern U. S. to over 16 Mg·ha−1 in southern Illinois, Arkansas, western Ken- tucky, and Tennessee, while yields predicted across the southern extremes of the eastern US were between 6 and 12 Mg·ha−1. Other studies showed that the predicted switchgrass yield ranged from 8 to 40 Mg·ha−1 in the Midwestern US [9] and from 9 to 24 Mg·ha−1 in the en- tire Upper Mississippi River Basin [20]. The predicted yield values in this study were slightly higher than ob- served field data from trials in the upper plains states which had 5-year average yield of 5 Mg·ha−1 [37]. For miscanthus, the 21-year (1990-2011) average yield was 17.80 Mg·ha−1 and had a range of 9 Mg·ha−1 (maxi- mum 22.2 Mg·ha−1, minimum 13.2 Mg·ha−1). Similar to these findings, previous studies also reported great varia- tion. Previous studies reported [9] miscanthus yield be- tween 0 and 62 Mg·ha−1 in the Midwestern U. S. and 30 and 42 Mg·ha−1 in Illinois [8]. It was estimated that the available cropland of the TCW (45,940 ha) can produce 817,732 Mg of average feedstock annually if miscanthus grass is grown in the watershed. Similarly switchgrass, corn, and soybeans have the potential to produce an av- erage annual feedstock of 477,317 Mg, 236,132 Mg, and 65,235 Mg respectively in TCW. 3.2. Streamflow Streamflow evaluation was conducted on monthly time scale for each of the four scenarios. The baseline model had an average monthly flow of 25.88 m3·s−1 at the wa- tershed outlet located in Nettleton, Mississippi during the 237-month (January 1990 through September 2009) study period. The results of this portion of the study show very similar results to both the baseline model and the four cropping scenarios (Table 1). Mean monthly streamflow at the watershed outlet for both continuous corn and continuous soybean production during the study period were almost identical, as were the mean monthly streamflow values for switchgrass and miscanthus. As expected, the streamflow was reduced in both grass sce- narios. Reduced streamflow is a result of the grasses al- lowing less runoff to contribute to the streamflow. It could also be a result of longer periods of land cover since the growing season for grasses is longer than for either corn or soybeans. The average monthly observed streamflow for the USGS gage station at this location was 29.34 m3·s−1. 3.3. Sediment Yield There was no observed sediment yield data to calibrate the baseline condition of the model. Thus, for this study sediment load for the four new cropping scenarios was compared to the baseline model to assess differences due Copyright © 2013 SciRes. JSBS  P. B. PARAJULI, S. E. DUFFY 206 to land use change. For all five scenarios, SWAT pre- dicted similar sediment yield curves. The results show that the continuous corn cropping scenario had the greatest annual average sediment yield (6.62 Mg·ha−1) while the perennial grasses (switchgrass and miscanthus) had the lowest sediment yield (2.91 Mg·ha−1 and 3.20 Mg·ha−1 respectively) (Figure 3). These results are in agreement with other research which has shown that grasses improve both water quality [14] and soil quality [3]. 4. Conclusions Model estimated mean monthly streamflow evaluation showed very close results to both the baseline model and the four cropping scenarios with corn and soybeans pro- ducing similar values and the grasses producing similar values. When compared to observed gage data at the same location, it was found that the model under predicted streamflows. The overall results of this study determined that long-term average annual feedstock yield from the TCW is greatest when growing miscanthus grass as fol- lowed by switchgrass, corn and soybeans. Miscanthus grass can produce 817,732 Mg of feedstock annually, Table 1. Comparison of monthly stream flows from Ja- nuary 1990 to September, 2009. Mean streamflow (m3·s−1) Maximum (m3·s−1) Minimum (m3·s−1) USGS gage station 29.34 237.24 0.51 Baseline 25.88 157.16 0.0938 Continuous corn 24.89 153.45 0.0043 Continuous soybeans 25.01 153.88 0.0348 Switchgrass 22.75 161.36 0.00 Miscanthus 19.20 161.37 0.00 0 2 4 6 8 10 12 14 16 Sediment yield (Mg ha -1 ) Soybeans Corn Switchgrass Miscanthus Baseline Figure 3. Predicted annual sediment yield (Mg·ha−1) for four bio-energy crops scenarios in the watershed. followed by switchgrass (477,317 Mg), corn (236,132 Mg), and soybeans (65,235 Mg). An analysis of sediment yield showed the continuous corn cropping scenario in the watershed, which had the greatest annual average sediment yield (6.62 Mg·ha−1), and the switchgrass scenario had the least (2.91 Mg·ha−1) sediment yield. It was also observed that SWAT pre- dicted similar sediment yield curves for all five scenarios. Overall it would seem that producing a perennial grass in the TCW would provide the largest biomass feedstock source with the least water quality and environmental impact. 5. Acknowledgements This material is based upon work performed through the Sustainable Energy Research Center at Mississippi State University and is supported by the Department of Energy under Award Number E-FG3606GO86025; Micro CHP and Bio-fuel Center. We acknowledge the contributions of landowners of the research fields in the watershed for this research. REFERENCES [1] International Energy Outlook, “Energy Information Ad- ministration,” Office of Integrated Analysis and Fore- casting, US Department of Energy, Washington DC, 2012. http://205.254.135.7/forecasts/ieo/pdf/0484(2011).pdf [2] M. Pidwirny, “Atmospheric Composition: Carbon Diox- ide,” Fundamentals of Physical Geography, 2nd Edition, 2012. http://www.physicalgeography.net/fundamentals/7aCO2. html [3] R. Lemus and R. Lal, “Bioenergy Crops and Carbon Se- questration,” Critical Reviews in Plant Sciences, Vol. 24, No. 1, 2005, pp. 1-21. doi:10.1080/07352680590910393 [4] G. C. Hickman, A. Vanloocke, F. G. Dohlman and C. J. Bernacchi, “A Comparison of Canopy Evapotranspiration for Maize and Two Perennial Grasses Identified as Poten- tial Bioenergy Crop,” Global Change Biology Bioenergy, Vol. 2, No. 4, 2010, pp. 157-168. [5] R. Lemus, B. Baldwin and D. Lang, “Agronomic Suit- ability of Bioenergy Crops in Mississippi,” Extension Ser- - vice of Mississippi State University, Publication # 2713. [6] M. R. Schmer, K. P. Vogel and R. K. M. Perrin “Net energy of Cellulosic Ethanol from Switchgrass,” Pro- ceedings of the National Academy of Sciences of the United States of America, Vol. 105, No. 2, 2008, pp. 464- 469. doi:10.1073/pnas.0704767105 [7] E. A. Heaton, F. G. Dohleman and S. P. Long, “Meeting US Biofuel Goals with Less Land: The Potential of Mis- canthus,” Global Change Biology, Vol. 14, No. 9, 2008, pp. 1-15. doi:10.1111/j.1365-2486.2008.01662.x [8] M. Khanna, B. Dhungana and J. Clifton-Brown, “Costs of Producing Miscanthus and Switchgrass for Bioenergy in Illinois,” Biomass Bioenergy, Vol. 32, No. 6, 2008, pp. Copyright © 2013 SciRes. JSBS 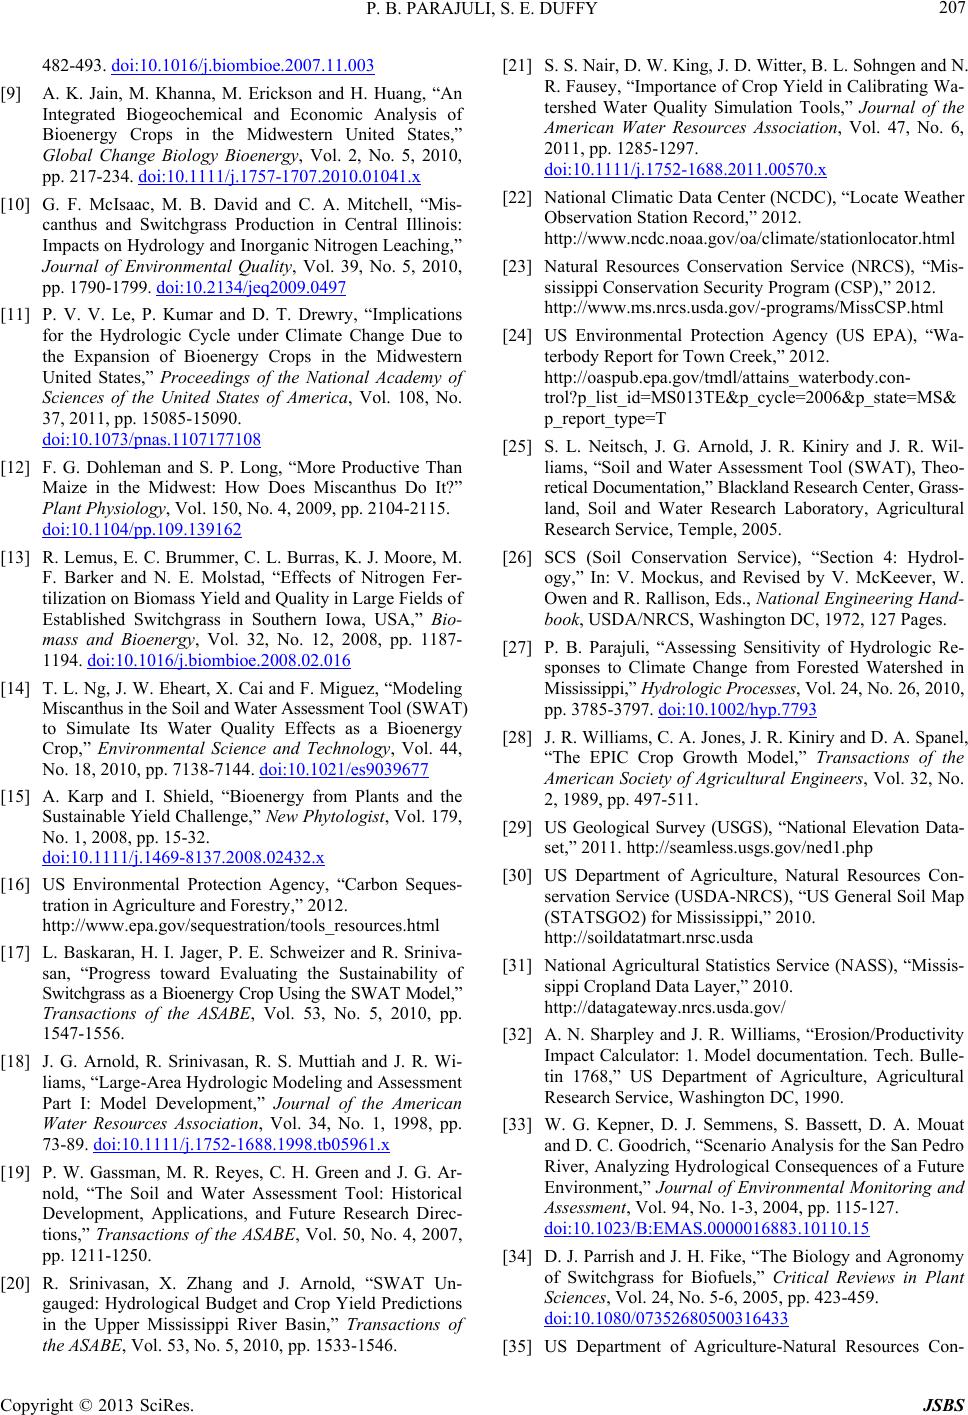 P. B. PARAJULI, S. E. DUFFY 207 482-493. doi:10.1016/j.biombioe.2007.11.003 [9] A. K. Jain, M. Khanna, M. Erickson and H. Huang, “An Integrated Biogeochemical and Economic Analysis of Bioenergy Crops in the Midwestern United States,” Global Change Biology Bioenergy, Vol. 2, No. 5, 2010, pp. 217-234. doi:10.1111/j.1757-1707.2010.01041.x [10] G. F. McIsaac, M. B. David and C. A. Mitchell, “Mis- canthus and Switchgrass Production in Central Illinois: Impacts on Hydrology and Inorganic Nitrogen Leaching,” Journal of Environmental Quality, Vol. 39, No. 5, 2010, pp. 1790-1799. doi:10.2134/jeq2009.0497 [11] P. V. V. Le, P. Kumar and D. T. Drewry, “Implications for the Hydrologic Cycle under Climate Change Due to the Expansion of Bioenergy Crops in the Midwestern United States,” Proceedings of the National Academy of Sciences of the United States of America, Vol. 108, No. 37, 2011, pp. 15085-15090. doi:10.1073/pnas.1107177108 [12] F. G. Dohleman and S. P. Long, “More Productive Than Maize in the Midwest: How Does Miscanthus Do It?” Plant Physiology, Vol. 150, No. 4, 2009, pp. 2104-2115. doi:10.1104/pp.109.139162 [13] R. Lemus, E. C. Brummer, C. L. Burras, K. J. Moore, M. F. Barker and N. E. Molstad, “Effects of Nitrogen Fer- tilization on Biomass Yield and Quality in Large Fields of Established Switchgrass in Southern Iowa, USA,” Bio- mass and Bioenergy, Vol. 32, No. 12, 2008, pp. 1187- 1194. doi:10.1016/j.biombioe.2008.02.016 [14] T. L. Ng, J. W. Eheart, X. Cai and F. Miguez, “Modeling Miscanthus in the Soil and Water Assessment Tool (SWAT) to Simulate Its Water Quality Effects as a Bioenergy Crop,” Environmental Science and Technology, Vol. 44, No. 18, 2010, pp. 7138-7144. doi:10.1021/es9039677 [15] A. Karp and I. Shield, “Bioenergy from Plants and the Sustainable Yield Challenge,” New Phytologist, Vol. 179, No. 1, 2008, pp. 15-32. doi:10.1111/j.1469-8137.2008.02432.x [16] US Environmental Protection Agency, “Carbon Seques- tration in Agriculture and Forestry,” 2012. http://www.epa.gov/sequestration/tools_resources.html [17] L. Baskaran, H. I. Jager, P. E. Schweizer and R. Sriniva- san, “Progress toward Evaluating the Sustainability of Switchgrass as a Bioenergy Crop Using the SWAT Model,” Transactions of the ASABE, Vol. 53, No. 5, 2010, pp. 1547-1556. [18] J. G. Arnold, R. Srinivasan, R. S. Muttiah and J. R. Wi- liams, “Large-Area Hydrologic Modeling and Assessment Part I: Model Development,” Journal of the American Water Resources Association, Vol. 34, No. 1, 1998, pp. 73-89. doi:10.1111/j.1752-1688.1998.tb05961.x [19] P. W. Gassman, M. R. Reyes, C. H. Green and J. G. Ar- nold, “The Soil and Water Assessment Tool: Historical Development, Applications, and Future Research Direc- tions,” Transactions of the ASABE, Vol. 50, No. 4, 2007, pp. 1211-1250. [20] R. Srinivasan, X. Zhang and J. Arnold, “SWAT Un- gauged: Hydrological Budget and Crop Yield Predictions in the Upper Mississippi River Basin,” Transactions of the ASABE, Vol. 53, No. 5, 2010, pp. 1533-1546. [21] S. S. Nair, D. W. King, J. D. Witter, B. L. Sohngen and N. R. Fausey, “Importance of Crop Yield in Calibrating Wa- tershed Water Quality Simulation Tools,” Journal of the American Water Resources Association, Vol. 47, No. 6, 2011, pp. 1285-1297. doi:10.1111/j.1752-1688.2011.00570.x [22] National Climatic Data Center (NCDC), “Locate Weather Observation Station Record,” 2012. http://www.ncdc.noaa.gov/oa/climate/stationlocator.html [23] Natural Resources Conservation Service (NRCS), “Mis- sissippi Conservation Security Program (CSP),” 2012. http://www.ms.nrcs.usda.gov/-programs/MissCSP.html [24] US Environmental Protection Agency (US EPA), “Wa- terbody Report for Town Creek,” 2012. http://oaspub.epa.gov/tmdl/attains_waterbody.con- trol?p_list_id=MS013TE&p_cycle=2006&p_state=MS& p_report_type=T [25] S. L. Neitsch, J. G. Arnold, J. R. Kiniry and J. R. Wil- liams, “Soil and Water Assessment Tool (SWAT), Theo- retical Documentation,” Blackland Research Center, Grass- land, Soil and Water Research Laboratory, Agricultural Research Service, Temple, 2005. [26] SCS (Soil Conservation Service), “Section 4: Hydrol- ogy,” In: V. Mockus, and Revised by V. McKeever, W. Owen and R. Rallison, Eds., National Engineering Hand- book, USDA/NRCS, Washington DC, 1972, 127 Pages. [27] P. B. Parajuli, “Assessing Sensitivity of Hydrologic Re- sponses to Climate Change from Forested Watershed in Mississippi,” Hy drologic Processes, Vol. 24, No. 26, 2010, pp. 3785-3797. doi:10.1002/hyp.7793 [28] J. R. Williams, C. A. Jones, J. R. Kiniry and D. A. Spanel, “The EPIC Crop Growth Model,” Transactions of the American Society of Agricultural Engineers, Vol. 32, No. 2, 1989, pp. 497-511. [29] US Geological Survey (USGS), “National Elevation Data- set,” 2011. http://seamless.usgs.gov/ned1.php [30] US Department of Agriculture, Natural Resources Con- servation Service (USDA-NRCS), “US General Soil Map (STATSGO2) for Mississippi,” 2010. http://soildatatmart.nrsc.usda [31] National Agricultural Statistics Service (NASS), “Missis- sippi Cropland Data Layer,” 2010. http://datagateway.nrcs.usda.gov/ [32] A. N. Sharpley and J. R. Williams, “Erosion/Productivity Impact Calculator: 1. Model documentation. Tech. Bulle- tin 1768,” US Department of Agriculture, Agricultural Research Service, Washington DC, 1990. [33] W. G. Kepner, D. J. Semmens, S. Bassett, D. A. Mouat and D. C. Goodrich, “Scenario Analysis for the San Pedro River, Analyzing Hydrological Consequences of a Future Environment,” Journal of Environmental Monitoring and Assessment, Vol. 94, No. 1-3, 2004, pp. 115-127. doi:10.1023/B:EMAS.0000016883.10110.15 [34] D. J. Parrish and J. H. Fike, “The Biology and Agronomy of Switchgrass for Biofuels,” Critical Reviews in Plant Sciences, Vol. 24, No. 5-6, 2005, pp. 423-459. doi:10.1080/07352680500316433 [35] US Department of Agriculture-Natural Resources Con- Copyright © 2013 SciRes. JSBS  P. B. PARAJULI, S. E. DUFFY Copyright © 2013 SciRes. JSBS 208 servation Service (USDA-NRCS), “Planting and Manag- ing Switchgrass as a Biomass Energy Crop. Plant Materi- als Program, Technical Note 4,” 2012. http://www.nrcs.usda.gov/Internet/FSE_DOCUMENTS/s telprdb1042293.pdf [36] US Department of Agriculture-Natural Resources Con- servation Service (USDA-NRCS), “Planting and Har- vesting Giant Miscanthus as a Biomass Energy Crop. Plant Materials Program, Technical Note 4,” 2012. http://www.nrcs.usda.gov/Internet/FSE_DOCUMENTS/s telprdb1044768.pdf [37] R. Perrin, K. Vogel, M. Schmer and R. Mitchell, “Farm- Scale Production Cost of Switchgrass for Biomass,” Bio- energy Research, Vol. 1, No. 1, 2008, pp. 91-97. doi:10.1007/s12155-008-9005-y |