

Paper Menu >>
Journal Menu >>
 Advances in Remote Sensing, 2013, 2, 269-275 http://dx.doi.org/10.4236/ars.2013.23029 Published Online September 2013 (http://www.scirp.org/journal/ars) Determining the Best Optimum Time for Predicting Sugarcane Yield Using Hyper-Temporal Satellite Imagery Shingirirai Mutanga1,2, Chris van Schoor2, Phindile Lukhele Olorunju2, Tichatonga Gonah3, Abel Ramoelo4 1Africa Institute of South Africa, Science and Technology Programme, Pretoria, South Africa 2University of Pretoria, Industrial Engineering Department, Pretoria, South Africa 3Council for Scientific and Industrial Research (CSIR), Earth Observation Research Group, Natural Resource and Environment Unit, Pretoria, South Africa 4Department of Water Affairs, Hydrogeology Section, Pretoria, South Africa Email: [email protected] Received April 11, 2013; revised May 11, 2013; accepted June 11, 2013 Copyright © 2013 Shingirirai Mutanga et al. This is an open access article distributed under the Creative Commons Attribution Li- cense, which permits unrestricted use, distribution, and reproduction in any medium, provided the original work is properly cited. ABSTRACT Hyper-temporal satellite imagery provides timely up to date and relatively accurate information for the management of crops. Nonetheless models which use high time series satellite data for sugarcane yield estimation remain scant. This study det e rmined the be st optimum time for predicting suga rc ane yield using the normalized d i f ference veg etation i ndex (NDVI) derived from SPOT-VEGETATION images. The study used actual yield data obtained from the mill and re- lated it to NDVI of several two-month periods of integration spread along the sugarcane growing cycle. Findings were in agreement with results of previous stud ies which indicated that the best acquisition period of satellite images for the assessment of sugarcane yield is about 2 months preceding the beginning of harvest. Overall, of the five years tested to determine the relationship between actual yield and integrated NDVI, three years showed a significant positive rela- tionship with a highest r2 value of 85%. The study however warrants further investigation to improve and develop ac- curate operational sugarcane yield estimation models at the local level given that other years had weak results. Such hybrid models may combine different vegetation indexes with agro-meteorological models which take into account broader crop’s physiologi cal, growth dem a nds, and soil managem ent whi ch are equally importa nt when predi cti ng yiel d. Keywords: Sugarcane; NDVI; Yields; Spot Vegetation 1. Introduction The 21st Century demands the promotion of fast track modernization and diversification of the sugar sector to convert it into an efficient cane industry aimed at pro- ducing sufficient stocks for manufacturing sugar, for energy [1], and other by products [2,3]. Remote sensing in the form of hyper-temporal satellite imagery is one of the tools that can be used to provide timely up to date and relatively accurate information for the management of sugar cane crop. Several studies have applied remote sensing techniques in sugarcane monitoring. Particular focus has been on the crop’s classification [4] areal ex- tent mapping [5] thermal age group identification [6], varietal discrimination [7], crop health and nutritional status monitoring [8,15]. There is limited applied remote sensing for sugarcane yield prediction yet it has been used successfully on graneous crops, such as maize and wheat [9-12], linked the paucity of publications of ex- perimental results to the difficulty in collating data and the lengthy of the growing period of sugarcane. Given the crop’s relevance in today’s world economy, and the scant models developed this far, the study uses SPOT VEGETATION multi-temporal images to estimate the optimum time for sugarcane yield prediction. 1.1. Sugarcane Growth Sugarcane is a perennial crop of the Saccharum genus that is grown in the warm tropics and sub tropics [13]. In the sub tropics the crop is often grown in irrigated areas due to its high water requirements. Its growth is charac- terized by three development stages namely: sprouting, tillering, stalk grow th and maturation [8]. Th e maturation is triggered by a decrease in soil water content, in tem- perature and nitrogen availability. This stage is charac- C opyright © 2013 SciRes. ARS 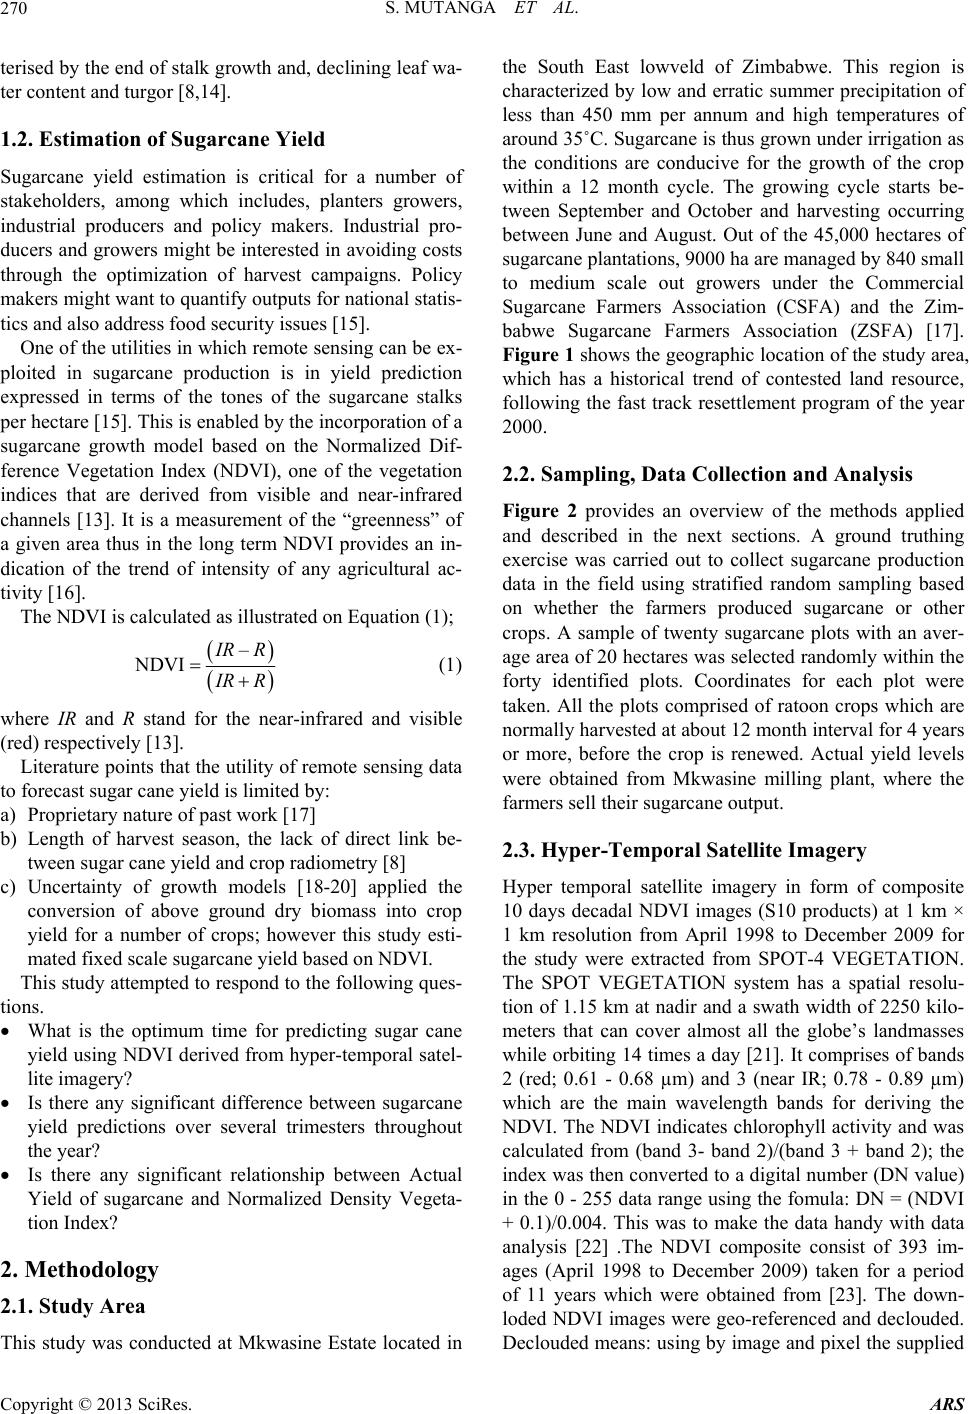 S. MUTANGA ET AL. 270 terised by the end of stalk growth and, declining leaf wa- ter content and turgor [8,14]. 1.2. Estimation of Sugarcane Yield Sugarcane yield estimation is critical for a number of stakeholders, among which includes, planters growers, industrial producers and policy makers. Industrial pro- ducers and growers might be interested in avoiding costs through the optimization of harvest campaigns. Policy makers might want to quantify outputs for national statis- tics and also address food security issues [15]. One of the utilities in which re mote sensing can be ex- ploited in sugarcane production is in yield prediction expressed in terms of the tones of the sugarcane stalks per hectare [15]. This is enabled by the incorporation of a sugarcane growth model based on the Normalized Dif- ference Vegetation Index (NDVI), one of the vegetation indices that are derived from visible and near-infrared channels [13]. It is a measurement of the “greenness” of a given area thus in the long term NDVI provides an in- dication of the trend of intensity of any agricultural ac- tivity [16]. The NDVI is calculated as illustrated on Equation (1); – NDVI I RR I RR (1) where IR and R stand for the near-infrared and visible (red) respectively [13]. Literature points that the utility of remote sensing data to forecast sugar cane yield is li mited by: a) Proprietary nature of past wo r k [1 7] b) Length of harvest season, the lack of direct link be- tween sugar cane yield and crop radiometry [8] c) Uncertainty of growth models [18-20] applied the conversion of above ground dry biomass into crop yield for a number of crops; however this study esti- mated fixed scale sugarcane yield based on NDVI. This study attempted to respond to the following ques- tions. What is the optimum time for predicting sugar cane yield using NDVI derived from hyper-temporal satel- lite imagery? Is there any significant difference between sugarcane yield predictions over several trimesters throughout the year? Is there any significant relationship between Actual Yield of sugarcane and Normalized Density Vegeta- tion Inde x? 2. Methodology 2.1. Study Area This study was conducted at Mkwasine Estate located in the South East lowveld of Zimbabwe. This region is characterized by low and erratic summer precipitation of less than 450 mm per annum and high temperatures of around 35˚C. Sugarcane is thus grown under irrigation as the conditions are conducive for the growth of the crop within a 12 month cycle. The growing cycle starts be- tween September and October and harvesting occurring between June and August. Out of the 45,000 hectares of sugarcane plantations, 9000 ha are managed by 840 small to medium scale out growers under the Commercial Sugarcane Farmers Association (CSFA) and the Zim- babwe Sugarcane Farmers Association (ZSFA) [17]. Figure 1 shows the geographic location of the study area, which has a historical trend of contested land resource, following the fast track resettlement program of the year 2000. 2.2. Sampling, Data Collection and Analysis Figure 2 provides an overview of the methods applied and described in the next sections. A ground truthing exercise was carried out to collect sugarcane production data in the field using stratified random sampling based on whether the farmers produced sugarcane or other crops. A sample of twenty sugarcane plots with an aver- age area of 20 hectares was selected randomly with in the forty identified plots. Coordinates for each plot were taken. All the plots comprised of ratoon crops which are normally harvested at about 12 month interval for 4 years or more, before the crop is renewed. Actual yield levels were obtained from Mkwasine milling plant, where the farmers sell their sugarcane output. 2.3. Hyper-Temporal Satellite Imagery Hyper temporal satellite imagery in form of composite 10 days decadal NDVI images (S10 products) at 1 km × 1 km resolution from April 1998 to December 2009 for the study were extracted from SPOT-4 VEGETATION. The SPOT VEGETATION system has a spatial resolu- tion of 1.15 km at nadir and a swath width of 2250 kilo- meters that can cover almost all the globe’s landmasses while orbiting 14 times a day [21]. It comprises of bands 2 (red; 0.61 - 0.68 µm) and 3 (near IR; 0.78 - 0.89 µm) which are the main wavelength bands for deriving the NDVI. The NDVI indicates chlorophyll activity and was calculated from (band 3- band 2)/(band 3 + band 2); the index was then converted to a digital number (DN value) in the 0 - 255 data range using the fomula: DN = (NDVI + 0.1)/0.004. This was to make the data handy with data analysis [22] .The NDVI composite consist of 393 im- ages (April 1998 to December 2009) taken for a period of 11 years which were obtained from [23]. The down- loded NDVI images were geo-referenced and declouded. eclouded means: using by image and pixel the supplied D Copyright © 2013 SciRes. ARS 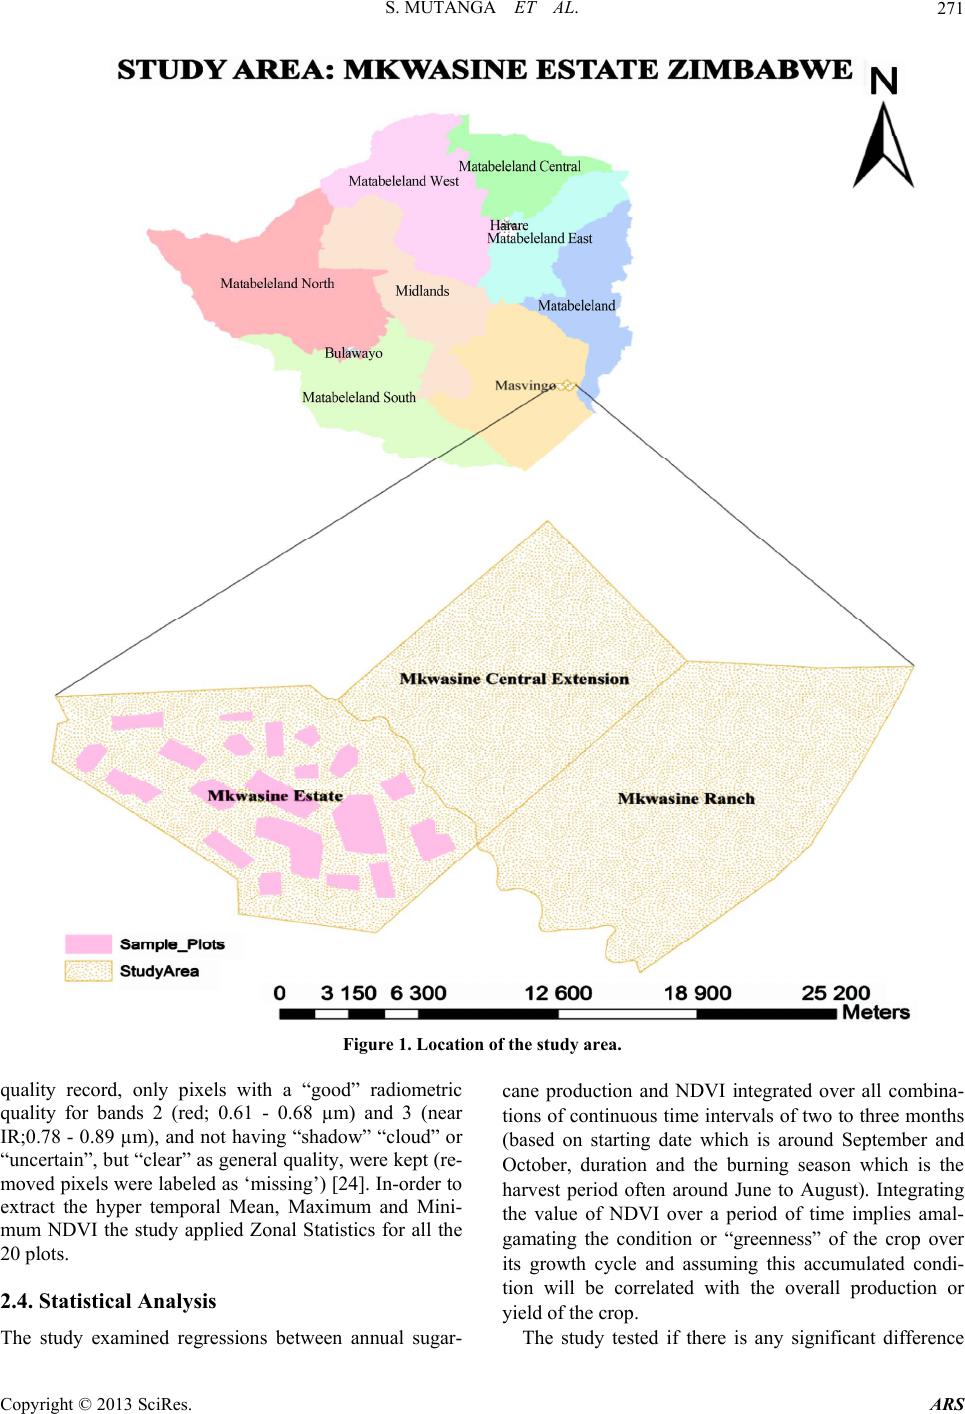 S. MUTANGA ET AL. Copyright © 2013 SciRes. ARS 271 Figure 1. Location of the study area. quality record, only pixels with a “good” radiometric quality for bands 2 (red; 0.61 - 0.68 µm) and 3 (near IR;0.78 - 0.89 µm), and not having “shadow” “cloud” or “uncertain”, but “clear” as general quality, were kept (re- moved pixels were labeled as ‘missing’) [24]. In-order to extract the hyper temporal Mean, Maximum and Mini- mum NDVI the study applied Zonal Statistics for all the 20 plots. cane production and NDVI integrated over all combina- tions of continuous time intervals of two to three months (based on starting date which is around September and October, duration and the burning season which is the harvest period often around June to August). Integrating the value of NDVI over a period of time implies amal- gamating the condition or “greenness” of the crop over its growth cycle and assuming this accumulated condi- tion will be correlated with the overall production or yield of the crop. 2.4. Statistical Analysis The study tested if there is any significant difference The study examined regressions between annual sugar- 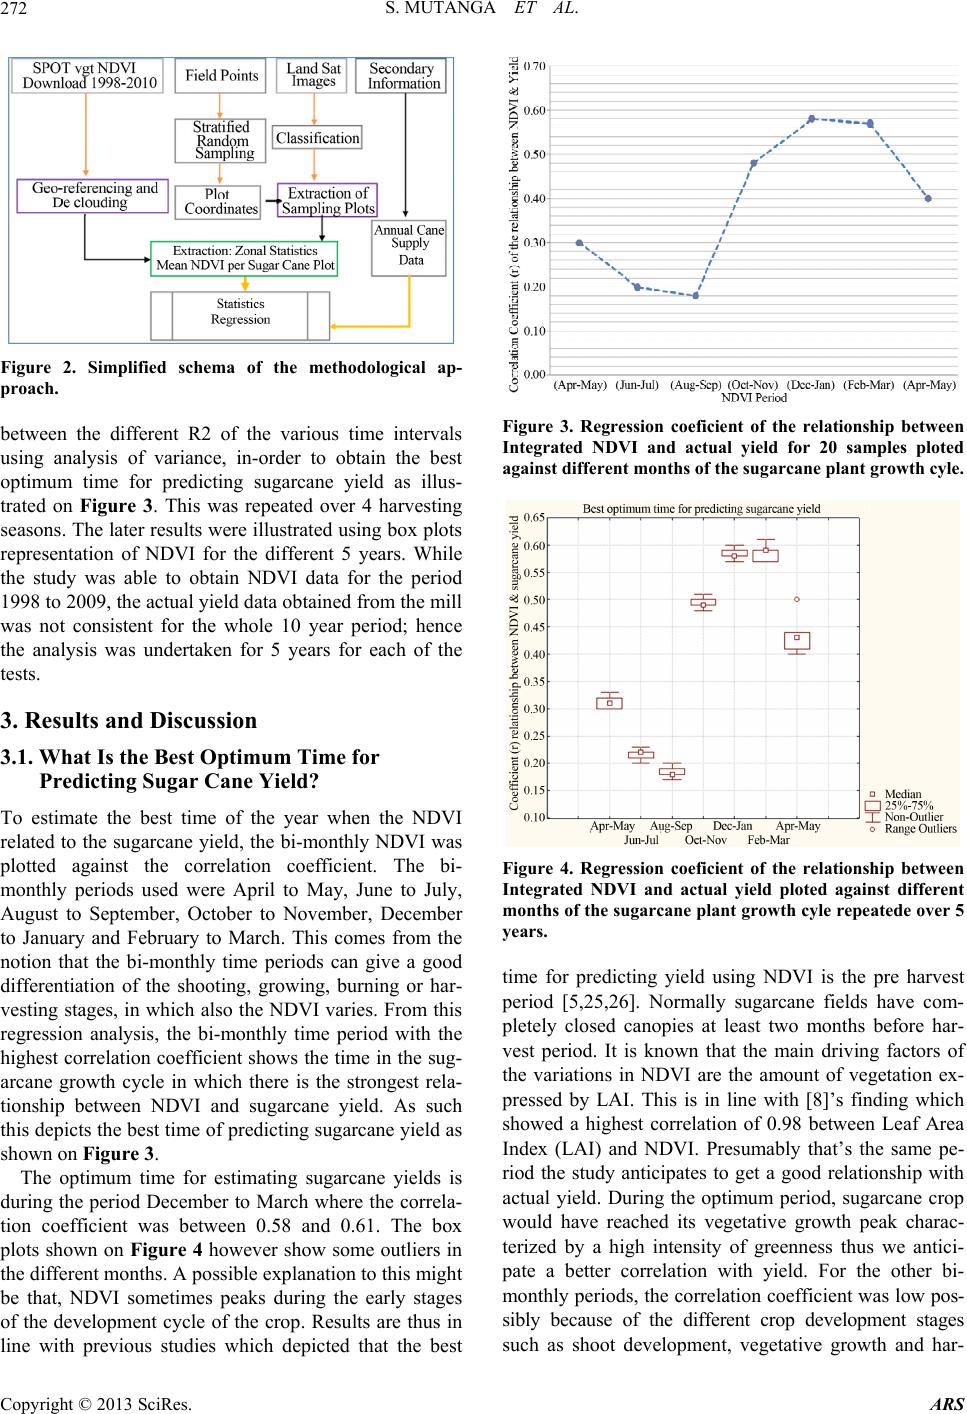 S. MUTANGA ET AL. 272 Figure 2. Simplified schema of the methodological ap- proach. between the different R2 of the various time intervals using analysis of variance, in-order to obtain the best optimum time for predicting sugarcane yield as illus- trated on Figure 3. This was repeated over 4 harvesting seasons. The later results were illustrated using box plots representation of NDVI for the different 5 years. While the study was able to obtain NDVI data for the period 1998 to 2009, the actual yield data ob tained fro m the mill was not consistent for the whole 10 year period; hence the analysis was undertaken for 5 years for each of the tests. 3. Results and Discussion 3.1. What Is the Best Optimum Time for Predicting Sugar Cane Yield? To estimate the best time of the year when the NDVI related to the sugarcane yield, the bi-monthly NDVI was plotted against the correlation coefficient. The bi- monthly periods used were April to May, June to July, August to September, October to November, December to January and February to March. This comes from the notion that the bi-monthly time periods can give a good differentiation of the shooting, growing, burning or har- vesting stages, in which also the NDVI varies. From this regression analysis, the bi-monthly time period with the highest correlation coefficient shows the time in the sug- arcane growth cycle in which there is the strongest rela- tionship between NDVI and sugarcane yield. As such this depicts the best time of predicting sugarcane yield as shown on Figure 3. The optimum time for estimating sugarcane yields is during the period December to March where the correla- tion coefficient was between 0.58 and 0.61. The box plots shown on Figure 4 however show some outliers in the different months. A possible explanation to this might be that, NDVI sometimes peaks during the early stages of the development cycle of the crop. Results are thus in line with previous studies which depicted that the best Figure 3. Regression coeficient of the relationship between Integrated NDVI and actual yield for 20 samples ploted against different months of the sugarcane plant growth cyle. Figure 4. Regression coeficient of the relationship between Integrated NDVI and actual yield ploted against different months of the sugarcane plant growth cyle repeatede over 5 years. time for predicting yield using NDVI is the pre harvest period [5,25,26]. Normally sugarcane fields have com- pletely closed canopies at least two months before har- vest period. It is known that the main driving factors of the variations in NDVI are the amount of vegetation ex- pressed by LAI. This is in line with [8]’s finding which showed a highest correlation of 0.98 between Leaf Area Index (LAI) and NDVI. Presumably that’s the same pe- riod the study anticipates to get a good relationship with actual yield. During the optimum period, sugarcane crop would have reached its vegetative growth peak charac- terized by a high intensity of greenness thus we antici- pate a better correlation with yield. For the other bi- monthly periods, the correlation coefficient was low pos- sibly because of the different crop development stages such as shoot development, vegetative growth and har- Copyright © 2013 SciRes. ARS  S. MUTANGA ET AL. 273 vesting making these periods no t optimum for estimating sugarcane yield. Likewise during the harvest period the sugarcane crop loses its greenness as leaves are burnt, hence the NDVI decreases, a similar trend observed over the different years in the analysis. Arguably the illustrated results show weak correlation coefficient for the best optimu m pred iction trimester ov er the different tested years. Results of ANOVA indicated that the Fcritical is 2.4, which is less than th e P-value of 2.6 showing a significant difference between the means of the different trimesters. This therefore implies that there is no other better trimester which can be used to predict yield given the cropping calendar. The low correlations coefficients are explained on the next set of results. 3.2. Relations between Sugarcane Yield and Integrated NDVI: Is There Any Significant Relationship between Integrated NDVI and Annual Yield? The relationship between integrated NDVI of the pre harvest season determined in this study and actual sug- arcane yield from the mill was estimated using linear regression with r esults shown on Table 1 . Overall, of the five years tested three years showed a sign ificant po sitive relationship between NDVI and the actual yield with a highest r-square (r2) value of 85%. This analysis shows that areas with high NDVI coincide with years of high or better yields. Findings of this study concur with a study by [27] which found a positive relationship between NDVI derived from NOAA AVHHR and sugarcane yield at a regional scale. Notwithstanding in some instances the standard error of the yield estimate shows a relatively low precision, while some areas showed a weak relationship between NDVI and actual yield. Various possible explanations can help explain this scenario. While SPOT VEGETA- TION has a strength in high temporal resolution, the spa- tial resolution is course i.e. (1 * 1 KM), implying that the measured reflectance will be affected by other factors other than the condition of the sugarcane. Possibly the reliability of the imagery as a means of estimating the Table 1. Simple regression analysis between yield and integrated NDVI for different periods of study. Years R2 RMSE F-stats P 2005 0.41 10.27 12.51 0.002000 2006 0.59 9.84 25.41 0.000085 2007 0.64 7.36 32.52 0.000021 2008 0.85 4.80 100.3 0.000000 2009 0.80 9.11 72.03 0.000000 yield might be compromised by the time interval be- tween the date the image was taken and the harvest date. It can be argued that the relationship between inte- grated NDVI and yield depends on a variety of environ- mental conditions [28], and production related factors. As an example canopy condition of sugarcane is mainly determined by moisture and chlorophyll status as meas- ured by NDVI however it’s not the only facto r determin- ing yield. Other extern al factors such as droughts, nutria- ent deficiency might influence the yield, which might be a reason for the weak relationship shown on Table 1 and Figures 3 and 4. Other factors which might need to be taken into account could include the harvesting process and transportation to the mill. Often substantial amount of cane can be lost before selling to the mills, and such cane is unaccounted for as the actual yield used in this study was based on records from the milling company. The fact that our results were based on field measure- ments of output at the mill negates this notion since re- sults indicated some satisfactory relationship. This shows the potential of high time series data to predict yields though with room for improvement. 4. Conclusions Hyper-temporal satellite imagery (Spot Vegetation) can play a significant role in sugarcane management. The main finding of this study is that the preceding two months before harvest is the optimum period for predict- ing yield using NDVI . Despite the weak correlation coef- ficient for the optimum prediction trimester over the dif- ferent tested years there is no better trimester which can be used to predict yield given the cropping calendar. Had it been that this study analysed data for the anticipated 10-year period better informed results might have been envisaged. Based on the 20 samples for each of the five years tested to determine the relationship between actual yield and integrated NDVI, three years showed a significant positive relationship showing the potential of high time series data in yield prediction. In a nutshell the study warrants further investigatio n to improve and develop accurate operational sugarcane yield estimation models at the local lev el given the evidence of weak results for other years. Such hybrid models may combine different vegetation indices with agro-meteoro- logical models which take into account broader crop’s physiological, growth demands, soil management which are equally important when predicting yield. Post yield prediction factors which may affect the sugarcane need to be taken into account for example diseases, poor har- vesting processes, and cane transportation losses. It might also be advantageous to consider a model which inte- grates high spatial resolu tion imagery with high tempor al resolution. Copyright © 2013 SciRes. ARS  S. MUTANGA ET AL. 274 REFERENCES [1] B. Amigun, R. Sigamoney and H. Van Blottnits, “Com- mercialisation of Biofuel Industry in Africa: A Review,” Renewable and Sustainable Energy Reviews, Vol. 12, No. 3, 2008, pp. 690-711. doi:10.1016/j.rser.2006.10.019 [2] C. J. Tucker, “Red and Photographic Infrared Linear Combinations for Monitoring Vegetation,” Remote Sens- ing of Environment, Vol. 8, No. 2, 1979, pp. 127-150. doi:10.1016/0034-4257(79)90013-0 [3] A. C. Xavier, B. F. T. Ruddofr, Y. E. Shimabukuro, L. M. S. Berka and M. A. Moreira, “Multi-Temporal Analysis of MODIS Data to Classify Sugarcane Crop,” Interna- tional Journal of Remote Sensing, Vol. 27, No. 4, 2006, pp. 755-768. doi:10.1080/01431160500296735 [4] L. G. Lovick and L. Kirchner, “Limitations of Landsat TM Data in Monitoring Growth and Predicting Yields in Sugarcane,” Proceedings of Australian Society of Sugar Cane Technologists, Vol. 13, 1991. pp. 124-130. [5] W. Hadsarang and S. Sukmuang, “Utilization of Land- sat-5 TM imagery for sugarcane area survey and mapping in Thailand,” Proceedings of the Asian Conference on Remote Sensing, Taipei, 2000. www.gisdevelopment.net/aars/acrs/2000/ps2/ps214pf.htm [6] A. K. L. Johnson and A. E. Kinsey-Henderson, “Satel- lite-based remote sensing for monitoring land use in the sugar industry,” Proceedings of the Australian Society of Sugar Cane Technology, Vol. 19, 1997, pp. 237-245. [7] E. J. Schmidt, G. Narciso, P. Frost and C. J. Gers, “Ap- plication of Remote Sensing Technology in the South Af- rican Sugar Industry: A Review of Recent Research Findings,” Proceedings of the South African Sugar Tech- nologists’ Association, Vol. 74, 2000, pp. 192-201. [8] A. Begue, V. Lebourgeois, E. Bappel, P. Todoroff, A. Pellegrino, F. Baillarin and B. Siegmund, “Spatio-Tem- poral Variability of Sugarcane Fields and Recommenda- tions for Yeild Forecust Using NDVI,” International Journal of Remote Sensing, Vol. 31, No. 20, 2010, pp. 5391-5407. doi:10.1080/01431160903349057 [9] D. W. Lamb, “The Use of Qualitative Airborne Multis- pectral Imaging for Manging Agricultural Crops. A Case Study in South-Eastern Australia,” Australian Journal of Experimental Agriculture, Vol. 40, 2000, pp. 725-738. doi:10.1071/EA99086 [10] P. J. Printer, J. L. Hatfield, J. S. Schepers, E. M. Barnes, M. S. Moran, C. S. T. Daughtry and D. R. Upchurch, “Remote Sensing for Crop Management,” Photogramet- ric Engineering & Remote Sensing, Vol. 69, No. 6, 2003, pp. 647-664. [11] J. Wang, P. M. Rich, K. P. Pric e and W. D. Ket tle, “Rela - tions between NDVI, Grassland Production, and Crop Yield in the Central Great Plains,” Geocarto Interna- tional, Vol. 20, No. 3, 2005, pp. 5-11 [12] M. D. S. Simoes, J. V. Rocha and R. A. C. Lamparelli, “Spectral Variables, Growth Analysis and Yield of Sugar Cane,” Sceintia Agricola, Vol. 62, No. 3, 2005, pp. 199- 207. doi:10.1590/S0103-90162005000300001 [13] C. P. L. Grof, J. A. Campbell, “Sugarcane Sucrose Me- tabolism: Scope of Molecular Manipulation,” Australian Journal of plant Physiology, Vol. 28, No. 1, 2001, pp. 1- 12. [14] T. C. Hsiao, “Plant Responses to Water Stress,” Annual Review of Plant Physiology, Vol. 24, 1973, pp. 519-570. doi:10.1146/annurev.pp.24.060173.002511 [15] E. M. Abdel-Rahman and F. B. Ahmed, “The Application of Remote Sensing Techniques to Sugar Cane (Saccha- rum spp. hybrid) Production: A Review of Literature,” International Journal of Remote Sensing, Vol. 29, No. 13, 2008, pp. 3753-3767. doi:10.1080/01431160701874603 [16] S. J. Zwart and L. M. C. Leclert, “A Remote Sensing- Based Irrigation Performance Assessment: A Case Study of the Office du Niger in Mali,” Journal of Irrigation Science, Vol. 28, No. 6, 2010, pp. 371-385 [17] T. I. R. Almeida, C. R. De Souza and R. Rossetto, “AS- TER and LandSat ETM+ Images Applied to Sugarcane Yield Forecast,” International Journal of Remote Sensing, Vol. 27, No. 19, 2006, pp. 4057-4069. doi:10.1080/01431160600857451 [18] P. Promburom, A. Jintrawet and M. Ekasingh, “Estimat- ing Sugarcane Yields with Oy-Thai Interface,” Proceed- ings of the 24th Congress of the International Society of Sugar Cane Technologists (ISSCT), Brisbane, 17-21 Sep- tember 2001, pp. 81-86. [19] N. G. Inman-Bamber, G. D. Bonnett, D. M. Smith and P. J. Thorburn, “Sugarcane Physiology: Integrating from Cell to Crop to Advance Sugarcane Production,” Field Crops Research, Vol. 92, No. 2, 2005, pp. 115-117. doi:10.1016/j.fcr.2005.01.011 [20] W. G. M. Bastiaanssen and S. Ali, “A New Crop Yield Forecasting Model Based on Satellite Measurements Ap- plied across the Inuds Basin, Pakistan,” Agriculture, Ecosystem and Environment, Vol. 94, No. 3, 2003, pp. 321-340. doi:10.1016/S0167-8809(02)00034-8 [21] F. Van Der Meer, K. S. Schimdt and W. Bakker, “New Environmental Remote Sensing Systems,” Taylor Francis, London, 2002 [22] A. Murwira, “Scale Matters! A New Approach to Quan- tify Spatial Heterogeneity for Predicting the Distribuiton of Wildlife,” International Institute for Geo-Information Science & Earth Observation (ITC), 2003 [23] VITO, 2010 http://free.vgt.vito.be/ [24] A. K. Skidmore, A. G. Toxopeus, K. De Bie, F. Corsi, V. Venus, D. P. Omolo and J. Marquex, “Herpertological species Mapping for the Meditteranean,” ISPRS Com- mission VII Mid Term Symposium on Remote Sensing from Pixel to Processes, Enschede, 2006. http://www.isprs.org/proceedings/XXXVI/part7/PDF/010 .pdf [25] M. Uerno, Y. Kawamitsu, L. Sun, E. Taira and K. Maeda, “Combined Applications of NIR, RS and GIS for Sugar- cane Production,” Proceedings of the International Soci- ety of Sugarcane Technologists, Guatamela, 30 January-4 February 2005, pp. 204-210. [26] B. F. T. Rudorff and G. T. Batista, “Yield Estimation of Sugarcane Based on Agrometeorological Spectral Mod- els,” Remote Sensing of the Environment, Vol. 33, No. 3, Copyright © 2013 SciRes. ARS  S. MUTANGA ET AL. Copyright © 2013 SciRes. ARS 275 1990, pp. 183-192. doi:10.1016/0034-4257(90)90029-L [27] E. J. Schmidt, C. J. Gers, G. Narciso and P. Frost, “Re- mote sensing in the South African sugar industry,” Pro- ceedings of the International Society of Sugar Cane Tech- nologists, Vol. 24, 2001, pp. 241-245. [28] E. Bastdas-Obando and J. Carbonell-Gonzalez, “Evaluat- ing the Applicability of MODIS Data for Forecasting Sugarcane Yields in Colombia,” Proceedings of the 26th International Society of Sugarcane Technologists, Durban, 30 July-3 August 2007, pp. 173-176. |