

Paper Menu >>
Journal Menu >>
 Journal of Sensor Technology, 2013, 3, 70-74 http://dx.doi.org/10.4236/jst.2013.33012 Published Online September 2013 (http://www.scirp.org/journal/jst) Refractometric Fiber Optic Sensor for Detecting Salinity of Water Supriya S. Patil1, Arvind D. Shaligram2 1Department of Electronic Science, Abasaheb Garware College, Pune, India 2Department of Electronic Science, University of Pune, Pune, India Email: [email protected], [email protected] Received June 6, 2013; revised July 6, 2013; accepted July 14, 2013 Copyright © 2013 Supriya S. Patil, Arvind D. Shaligram. This is an open access article distributed under the Creative Commons Attribution License, which permits unrestricted use, distribution, and reproduction in any medium, provided the original work is properly cited. ABSTRACT Salinity is an important property of industrial and natural waters. It is defined as the measure of the mass of dissolved salts in a given mass of solution. High salinity has an impact on people and industries reliant on water. High levels of salt can reduce crop yields, limit the choice of crops that can be grown and, at higher concentrations over long periods, can kill trees and make the land unsuitable for agricultural purposes. Salinity increases the “hardness” of water, which can mean more soap and detergents have to be used or water softeners installed and maintained. This can also cause scaling in pipes and heaters. The experimental determination of the salt content by drying and weighing presents some difficulties due to the loss of some components. The only reliable way to determine the true or absolute salinity of natural water is to make a complete chemical analysis. However, the method is time consuming and cannot yield the precision necessity for accurate work. Thus to determine salinity, one normally used method involves the measurement of a physical prop- erty such as conductivity, density or refractive index. The paper reports the refractometric fiber optic sensor for detec- tion of salinity of water. The mathematical model is developed for detection of the refractive index of liquid and simu- lated in MATLAB. The fiber optic sensor probe is developed to measure the refractive index of the solution containing different amount of salt dissolved in water i.e. different molar concentrations. Experiments are carried out using the developed probe for these solutions. Experimental results are showing good agreement with the simulated results. Keywords: Fiber Optic Chemical Sensor; Hardness of Water; Refractometry; Retro-Reflective Type Fiber Optic Sensor; Salinity of Water 1. Introduction Water quality monitoring is essential to modern life. Not only is it a major factor in safeguarding public health, but also high-quality freshwater is also a key input in agri- culture and many industrial process. Salinity is a very important parameter for oceanics, marine environment monitoring, seasonal climate prediction, mariculture, and solar engineering. Very briefly, it can be concluded that, in the past, the salinity in water was determined by hy- drometric methods. In recent years, several new methods and technologies have been proposed for salinity meas- urement. For example, an ultrasonic technique [1] based on measurement of the travel time of light was presented to measure the salinity in a solar pond in 1995. A chemi- cal method [2] based on polyaniline matrix coated wire electrodes was developed for salinity measurement in a range from 0.010‰ to 75‰, where salinity is expressed in grams per kilogram of seawater, that is, in parts per thousand, or per mile, whereby the ‰ symbol is used. Fiber-optic sensors are capturing an ever greater share of the sensor market as industry realizes the numerous advantages they offer, compared with their conventional counterparts. The advantages of fiber-optic sensors over electrical transducers are the inherent immunity to elec- tromagnetic interferences [3,4], higher sensitivity, small sensing unit, safety in hazardous or explosive environ- ments, the possibility of processing the signal at large distances from the sensor with little degradation, and the ability to work under high-temperature and high-pressure conditions. An intensity-modulated fiber-optic sensor for salinity measurement based on radiation loss was devel- oped [5]. In the sensor probe, a part of fiber cladding is removed, and when it is placed into the salt water, some light will radiate into the liquid. The variations of the salinity in water will lead to the changes of the light in- C opyright © 2013 SciRes. JST 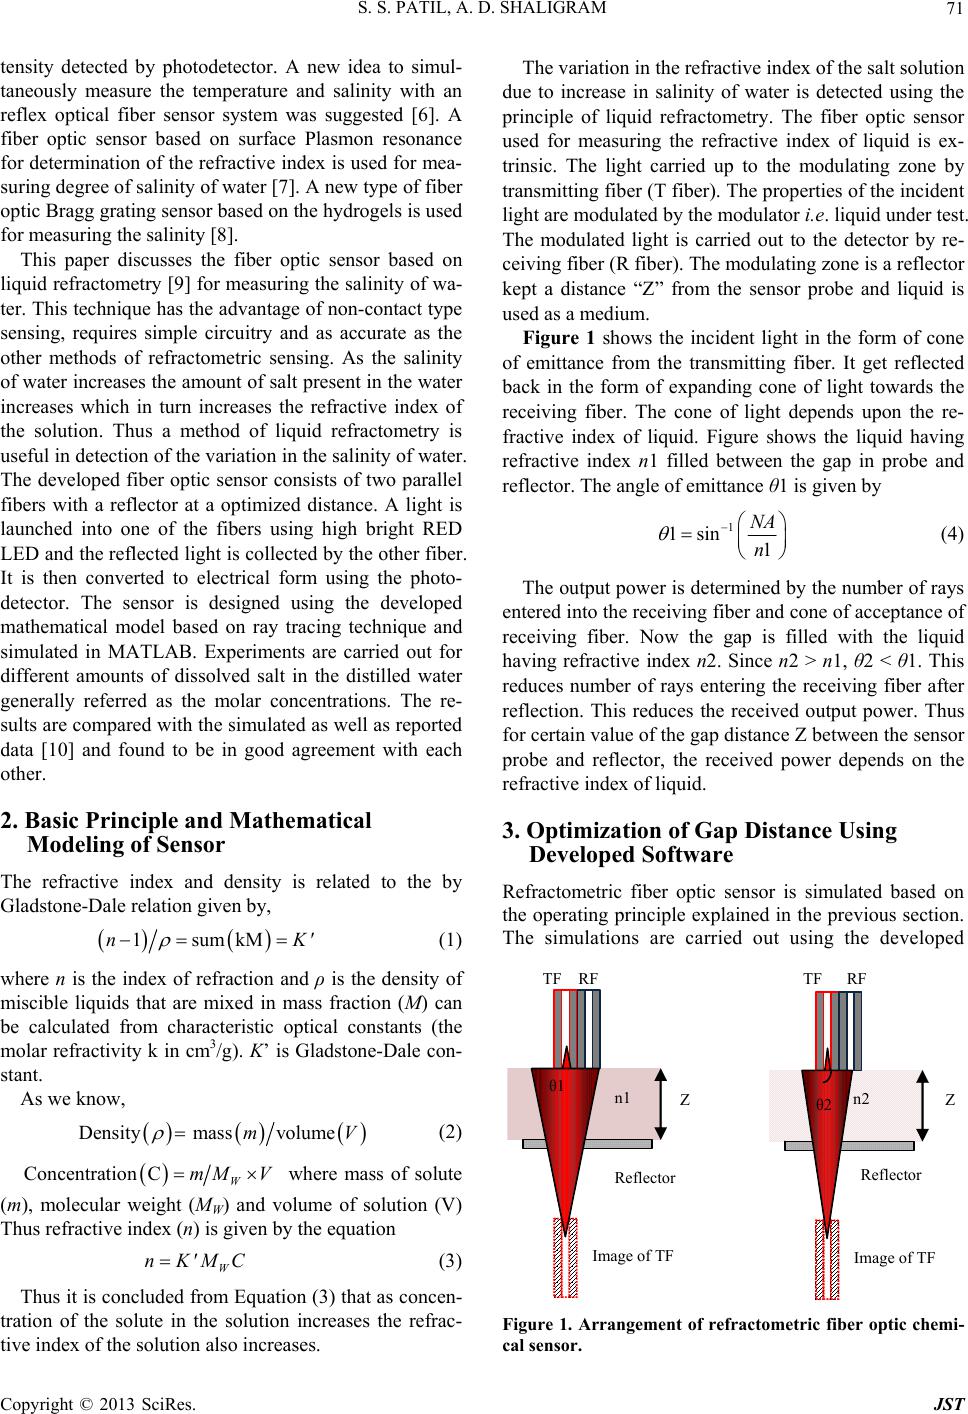 S. S. PATIL, A. D. SHALIGRAM 71 tensity detected by photodetector. A new idea to simul- taneously measure the temperature and salinity with an reflex optical fiber sensor system was suggested [6]. A fiber optic sensor based on surface Plasmon resonance for determination of the refractive index is used for mea- suring degree of salinity of water [7]. A new type of fiber optic Bragg grating sensor based on the hydrogels is used for measuring the salinity [8]. This paper discusses the fiber optic sensor based on liquid refractometry [9] for measuring the salinity of wa- ter. This technique has the advantage of non-contact type sensing, requires simple circuitry and as accurate as the other methods of refractometric sensing. As the salinity of water increases the amount of salt present in the water increases which in turn increases the refractive index of the solution. Thus a method of liquid refractometry is useful in detection of the variation in the salinity of water. The developed fiber optic sensor consists of two parallel fibers with a reflector at a optimized distance. A light is launched into one of the fibers using high bright RED LED and the reflected light is collected by the other fiber. It is then converted to electrical form using the photo- detector. The sensor is designed using the developed mathematical model based on ray tracing technique and simulated in MATLAB. Experiments are carried out for different amounts of dissolved salt in the distilled water generally referred as the molar concentrations. The re- sults are compared with the simulated as well as reported data [10] and found to be in good agreement with each other. 2. Basic Principle and Mathematical Modeling of Sensor The refractive index and density is related to the by Gladstone-Dale relation given by, 1sum kMnK ' (1) where n is the index of refraction and ρ is the density of miscible liquids that are mixed in mass fraction (M) can be calculated from characteristic optical constants (the molar refractivity k in cm3/g). K’ is Gladstone-Dale con- stant. As we know, Densitymassvolume m V (2) Concentration CW mM V where mass of solute (m), molecular weight (MW) and volume of solution (V) Thus refractive index (n) is given by the equation W nK'MC (3) Thus it is concluded from Equation (3) that as concen- tration of the solute in the solution increases the refrac- tive index of the solution also increases. The variation in the refractive index of the salt solution due to increase in salinity of water is detected using the principle of liquid refractometry. The fiber optic sensor used for measuring the refractive index of liquid is ex- trinsic. The light carried up to the modulating zone by transmitting fiber (T fiber). The properties of the incident light are modulated by the modulator i.e. liquid under test. The modulated light is carried out to the detector by re- ceiving fiber (R fiber). The modulating zone is a reflector kept a distance “Z” from the sensor probe and liquid is used as a medium. Figure 1 shows the incident light in the form of cone of emittance from the transmitting fiber. It get reflected back in the form of expanding cone of light towards the receiving fiber. The cone of light depends upon the re- fractive index of liquid. Figure shows the liquid having refractive index n1 filled between the gap in probe and reflector. The angle of emittance θ1 is given by 1 1sin 1 NA n (4) The output power is determined by the number of rays entered into the receiving fiber and cone of acceptance of receiving fiber. Now the gap is filled with the liquid having refractive index n2. Since n2 > n1, θ2 < θ1. This reduces number of rays entering the receiving fiber after reflection. This reduces the received output power. Thus for certain value of the gap distance Z between the sensor probe and reflector, the received power depends on the refractive index of liquid. 3. Optimization of Gap Distance Using Developed Software Refractometric fiber optic sensor is simulated based on the operating principle explained in the previous section. The simulations are carried out using the developed Z Z TF RF n2 Reflector Image of TF θ2 TF RF n1 Reflector Image of TF θ1 Figure 1. Arrangement of refractometric fiber optic chemi- cal sensor. Copyright © 2013 SciRes. JST 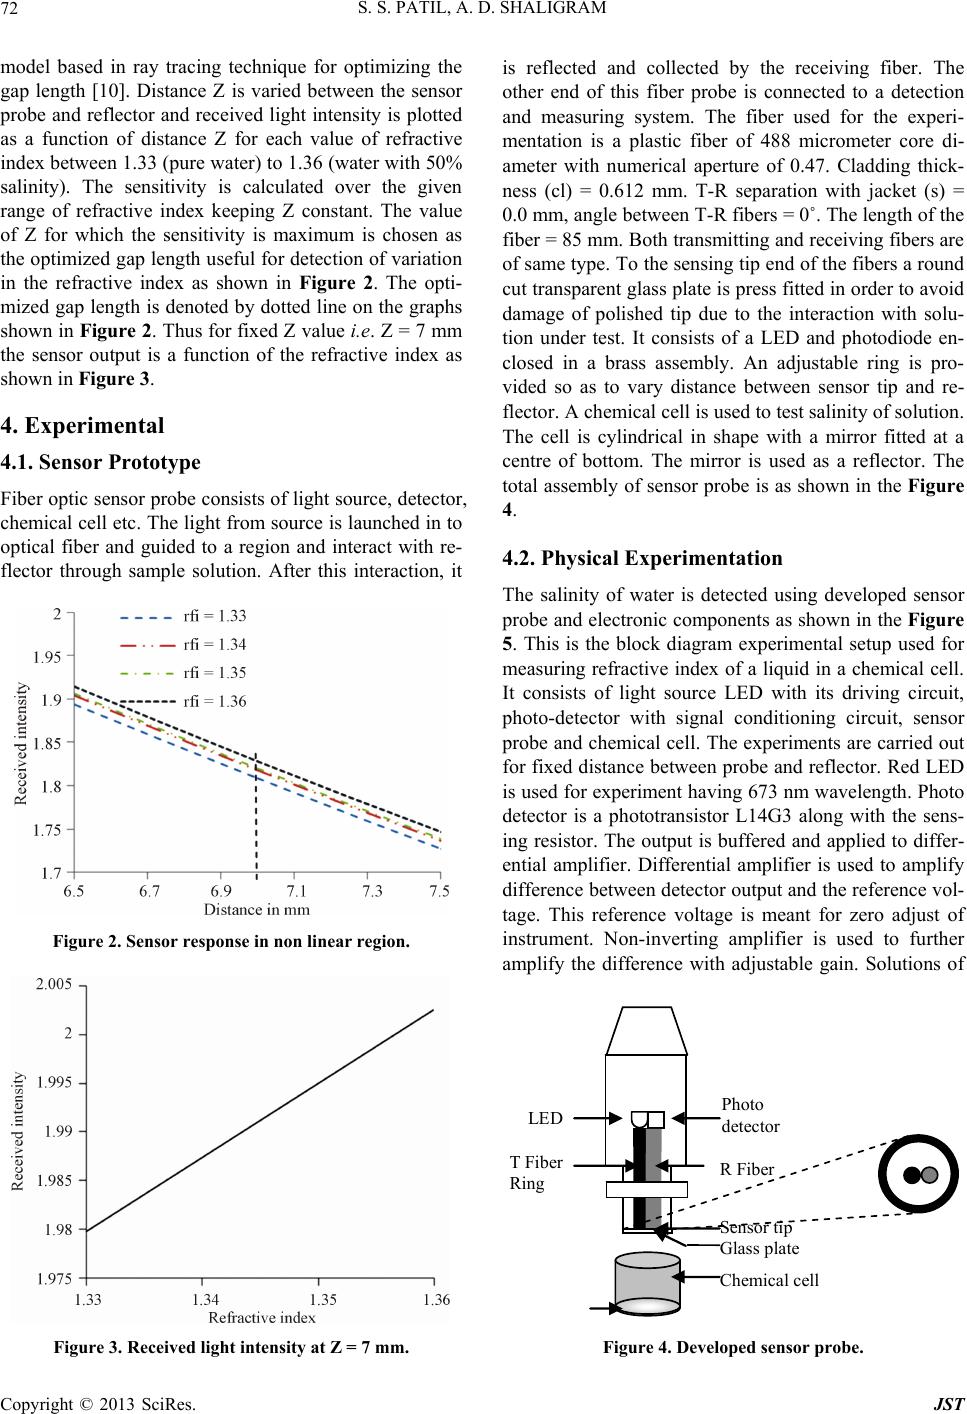 S. S. PATIL, A. D. SHALIGRAM 72 model based in ray tracing technique for optimizing the gap length [10]. Distance Z is varied between the sensor probe and reflector and received light intensity is plotted as a function of distance Z for each value of refractive index between 1.33 (pure water) to 1.36 (water with 50% salinity). The sensitivity is calculated over the given range of refractive index keeping Z constant. The value of Z for which the sensitivity is maximum is chosen as the optimized gap length useful for detection of variation in the refractive index as shown in Figure 2. The opti- mized gap length is denoted by dotted line on the graphs shown in Figure 2. Thus for fixed Z value i.e. Z = 7 mm the sensor output is a function of the refractive index as shown in Figure 3. 4. Experimental 4.1. Sensor Prototype Fiber optic sensor probe consists of light source, detector, chemical cell etc. The light from source is launched in to optical fiber and guided to a region and interact with re- flector through sample solution. After this interaction, it Figure 2. Sensor response in non linear region. Figure 3. Received light intensity at Z = 7 mm. is reflected and collected by the receiving fiber. The other end of this fiber probe is connected to a detection and measuring system. The fiber used for the experi- mentation is a plastic fiber of 488 micrometer core di- ameter with numerical aperture of 0.47. Cladding thick- ness (cl) = 0.612 mm. T-R separation with jacket (s) = 0.0 mm, angle between T-R fibers = 0˚. The length of the fiber = 85 mm. Both transmitting and receiving fibers are of same type. To the sensing tip end of the fibers a round cut transparent glass plate is press fitted in order to avoid damage of polished tip due to the interaction with solu- tion under test. It consists of a LED and photodiode en- closed in a brass assembly. An adjustable ring is pro- vided so as to vary distance between sensor tip and re- flector. A chemical cell is used to test salinity of solution. The cell is cylindrical in shape with a mirror fitted at a centre of bottom. The mirror is used as a reflector. The total assembly of sensor probe is as shown in the Figure 4. 4.2. Physical Experimentation The salinity of water is detected using developed sensor probe and electronic components as shown in the Figure 5. This is the block diagram experimental setup used for measuring refractive index of a liquid in a chemical cell. It consists of light source LED with its driving circuit, photo-detector with signal conditioning circuit, sensor probe and chemical cell. The experiments are carried out for fixed distance between probe and reflector. Red LED is used for experiment having 673 nm wavelength. Photo detector is a phototransistor L14G3 along with the sens- ing resistor. The output is buffered and applied to differ- ential amplifier. Differential amplifier is used to amplify difference between detector output and the reference vol- tage. This reference voltage is meant for zero adjust of instrument. Non-inverting amplifier is used to further amplify the difference with adjustable gain. Solutions of LED Photo detector T Fiber Ring R Fiber Chemical cell Sensor tip Glass plate Figure 4. Developed sensor probe. Copyright © 2013 SciRes. JST 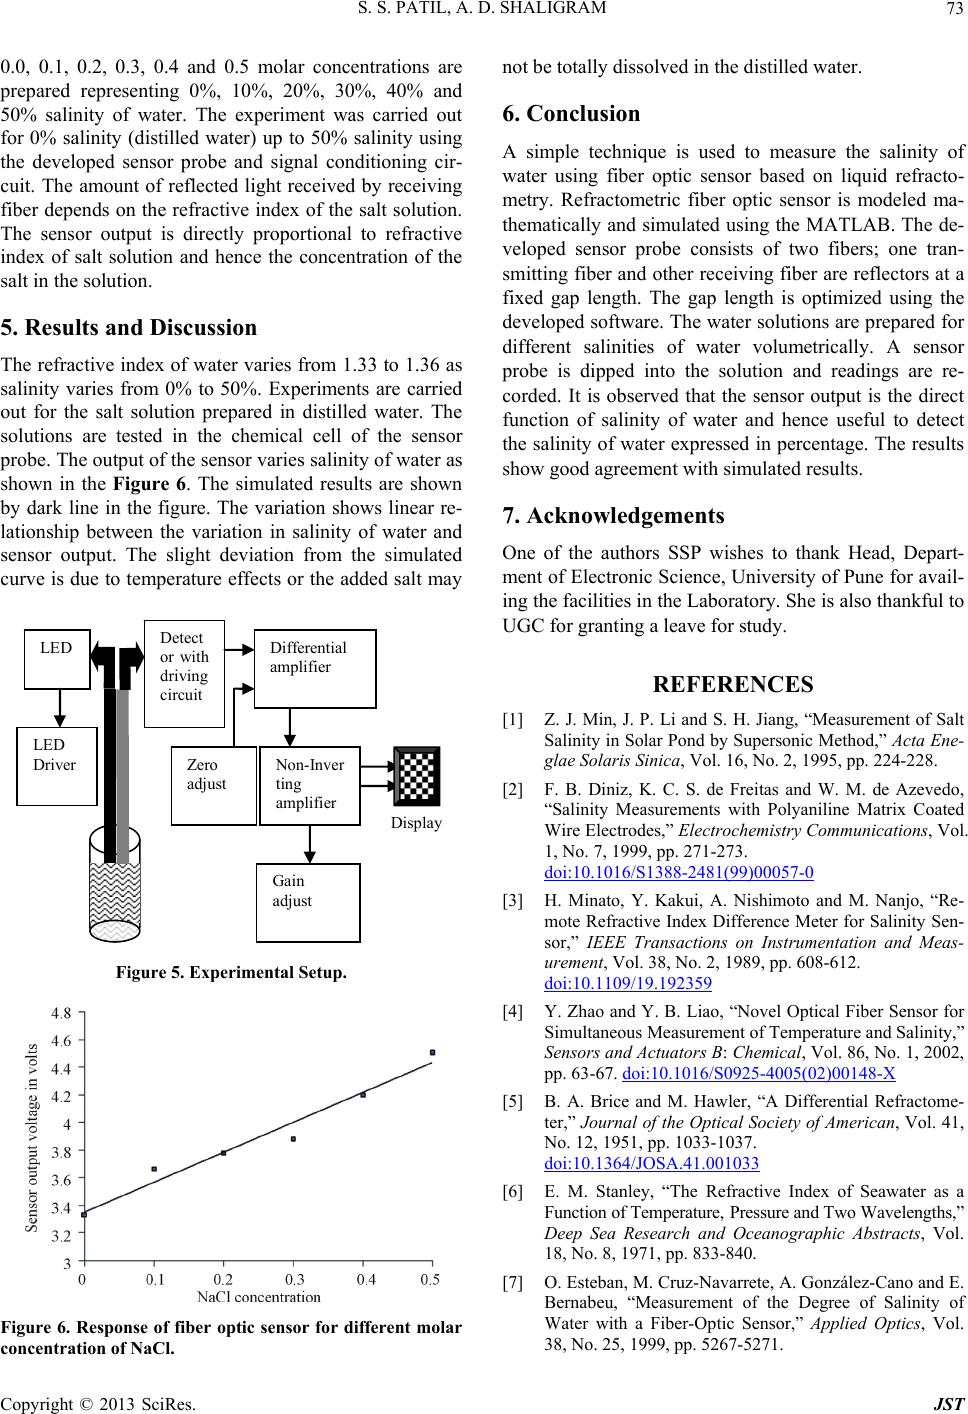 S. S. PATIL, A. D. SHALIGRAM 73 0.0, 0.1, 0.2, 0.3, 0.4 and 0.5 molar concentrations are prepared representing 0%, 10%, 20%, 30%, 40% and 50% salinity of water. The experiment was carried out for 0% salinity (distilled water) up to 50% salinity using the developed sensor probe and signal conditioning cir- cuit. The amount of reflected light received by receiving fiber depends on the refractive index of the salt solution. The sensor output is directly proportional to refractive index of salt solution and hence the concentration of the salt in the solution. 5. Results and Discussion The refractive index of water varies from 1.33 to 1.36 as salinity varies from 0% to 50%. Experiments are carried out for the salt solution prepared in distilled water. The solutions are tested in the chemical cell of the sensor probe. The output of the sensor varies salinity of water as shown in the Figure 6. The simulated results are shown by dark line in the figure. The variation shows linear re- lationship between the variation in salinity of water and sensor output. The slight deviation from the simulated curve is due to temperature effects or the added salt may LED Driver Detect or with driving circuit Display LED Differential amplifier Zero adjust Non-Inver ting amplifier Gain adjust Figure 5. Experimental Setup. Figure 6. Response of fiber optic sensor for different molar concentration of NaCl. not be totally dissolved in the distilled water. 6. Conclusion A simple technique is used to measure the salinity of water using fiber optic sensor based on liquid refracto- metry. Refractometric fiber optic sensor is modeled ma- thematically and simulated using the MATLAB. The de- veloped sensor probe consists of two fibers; one tran- smitting fiber and other receiving fiber are reflectors at a fixed gap length. The gap length is optimized using the developed software. The water solutions are prepared for different salinities of water volumetrically. A sensor probe is dipped into the solution and readings are re- corded. It is observed that the sensor output is the direct function of salinity of water and hence useful to detect the salinity of water expressed in percentage. The results show good agreement with simulated results. 7. Acknowledgements One of the authors SSP wishes to thank Head, Depart- ment of Electronic Science, University of Pune for avail- ing the facilities in the Laboratory. She is also thankful to UGC for granting a leave for study. REFERENCES [1] Z. J. Min, J. P. Li and S. H. Jiang, “Measurement of Salt Salinity in Solar Pond by Supersonic Method,” Acta Ene- glae Solaris Sinica, Vol. 16, No. 2, 1995, pp. 224-228. [2] F. B. Diniz, K. C. S. de Freitas and W. M. de Azevedo, “Salinity Measurements with Polyaniline Matrix Coated Wire Electrodes,” Electrochemistry Communications, Vol. 1, No. 7, 1999, pp. 271-273. doi:10.1016/S1388-2481(99)00057-0 [3] H. Minato, Y. Kakui, A. Nishimoto and M. Nanjo, “Re- mote Refractive Index Difference Meter for Salinity Sen- sor,” IEEE Transactions on Instrumentation and Meas- urement, Vol. 38, No. 2, 1989, pp. 608-612. doi:10.1109/19.192359 [4] Y. Zhao and Y. B. Liao, “Novel Optical Fiber Sensor for Simultaneous Measurement of Temperature and Salinity,” Sensors and Actuators B: Chemical, Vol. 86, No. 1, 2002, pp. 63-67. doi:10.1016/S0925-4005(02)00148-X [5] B. A. Brice and M. Hawler, “A Differential Refractome- ter,” Journal of the Optical Society of American, Vol. 41, No. 12, 1951, pp. 1033-1037. doi:10.1364/JOSA.41.001033 [6] E. M. Stanley, “The Refractive Index of Seawater as a Function of Temperature, Pressure and Two Wavelengths,” Deep Sea Research and Oceanographic Abstracts, Vol. 18, No. 8, 1971, pp. 833-840. [7] O. Esteban, M. Cruz-Navarrete, A. González-Cano and E. Bernabeu, “Measurement of the Degree of Salinity of Water with a Fiber-Optic Sensor,” Applied Optics, Vol. 38, No. 25, 1999, pp. 5267-5271. Copyright © 2013 SciRes. JST  S. S. PATIL, A. D. SHALIGRAM Copyright © 2013 SciRes. JST 74 doi:10.1364/AO.38.005267 [8] J. Cong, X. M. Zhang, K. S. Chen and J. Xu, “Fiber Optic Bragg Grating Sensor Based on Hydrogels for Measuring Salinity,” Sensors and Actuators B: Chemical, Vol. 87, No. 3, 2002, pp. 487-490. doi:10.1016/S0925-4005(02)00289-7 [9] A. L. Chaudhari and A. D. Shaligram, “Multi-Wavelength Optical Fiber Liquid Refractometry Based on Intensity Modulation,” Sensors and Actuators A: Physical, Vol. 100, No. 2-3, 2002, pp. 160-164. [10] S. S. Patil and A. D. Shaligram, “Modeling and Experi- mental Studies on Retro-Reflective Fiber Optic Micro- Displacement Sensor with Variable Geometrical Proper- ties,” Sensors and Actuators A: Physical, Vol. 172, No. 2, 2011, pp. 428-433. doi:10.1016/j.sna.2011.10.006 |