

Paper Menu >>
Journal Menu >>
 Pharmacology & Pharmacy, 2013, 4, 478-483 http://dx.doi.org/10.4236/pp.2013.46069 Published Online September 2013 (http://www.scirp.org/journal/pp) Changes in mRNA Expression and Activity of Xenobiotic Metabolizing Enzymes in Livers from Adjuvant-I nduced Arthritis Rats Atsushi Kawase, Syoko Wada, Masahiro Iwaki* Department of Pharmacy, School of Pharmacy, Kinki University, Osaka, Japan. Email: *[email protected] Received June 26th, 2013; revised August 1st, 2013; accepted August 16th, 2013 Copyright © 2013 Atsushi Kawase et al. This is an open access article distributed under the Creative Commons Attribution License, which permits unrestricted use, distribution, and reproduction in any medium, provided the original work is properly cited. ABSTRACT Pathophysiological changes in human patients and in animal models of infection or inflammation are associated with alterations in the production of numerous liver-derived proteins including metabolizing enzymes. In this study, the ef- fects of adjuvant-induced arthritis (AA) in rats on the levels of mRNA and activity of hepatic xenobiotic metabolizing enzymes were determined during the inflammatory response. The mRNA levels of cytochrome P450 (CYP) 1A2, CYP2C12, CYP2D1, CYP2D2, and CYP3A1 were significantly decreased compared with control levels in almost all phases of inflammation. A reduction in the activity of CYP2C and CYP3A, which are abundantly expressed in the liver, was also observed. For phase II metabolizing enzymes, mRNA levels of uridine 5’-diphospho-glucuronosyltransferase (UGT) 1A1, UGT1A6, sulfotransferase (SULT) 2A1, and glutathione S-transferase 2 were significantly decreased compared with control levels. However, the mRNA levels of UGT2B and SULT1A1 returned to control levels during the subacute (7 d after adjuvant treatment) and chronic (21 d after adjuvant treatment) phases although these levels de- creased during the acute (3 d after adjuvant treatment) phase. These results suggest that the effects of inflammation on the expression of xenobiotic metabolizing enzymes differ depending on the isoform of the enzyme and could affect the pharmacokinetics of each substrate. Keywords: Inflammation; Arthritis; Enzyme; Cytochrome; Metabolism 1. Introduction Pathophysiological changes in human patients and in animal models of infection or inflammation are associ- ated with immediate and often dramatic alterations in the production of numerous liver-derived proteins, including metabolizing enzymes such as cytochrome P450s (CYP), UDP-glucuronosyltransferases (UGT), sulfotransferases (SULT), and glutathione S-transferases (GST) [1,2]. In- flammatory conditions such as rheumatoid arthritis and Crohn’s disease have been shown to reduce hepatic clearance of several highly cleared drugs [3-5]. Adju- vant-induced arthritis (AA) in rats has been used as an animal model for rheumatoid arthritis in the development of new anti-inflammatory medicines because rats exhibit a systemic inflammatory disease with similar bone and cartilage alterations to those observed in rheumatoid ar- thritis on day 3 (acute), day 7 (subacute) and day 21 (chronic) after adjuvant treatment [6]. Changes in the pharmacokinetics and pharmacological effects of several drugs via altered CYP activities and serum protein bind- ing have been reported in AA rats, including elevated plasma concentrations of cyclosporine A, acebutolol and propranolol [4,7], and prolongation of sleeping time with pentobarbital [8]. We also demonstrated that flurbiprofen glucuronidation activity and CYP content in liver micro- somes were reduced [9] and intestinal CYP3A activity was decreased in AA rats [10]. Inflammatory cytokines, for example, tumor necrosis factor (TNF)-α, interleukin (IL)-6, and IL-1 could be involved in the decrease of me- tabolizing enzymes [11-13]. The nuclear receptor NR1I2, which is a pregnane X receptor (PXR) and NR1I3, which is a constitutive androstane receptor (CAR), is involved in the regulation of CYP transcription by interacting with xenobiotics and endogenous toxins [14-16]. However, a comprehensive understanding of the chang- ing profile of xenobiotic metabolizing enzymes in acute *Corresponding author. Copyright © 2013 SciRes. PP 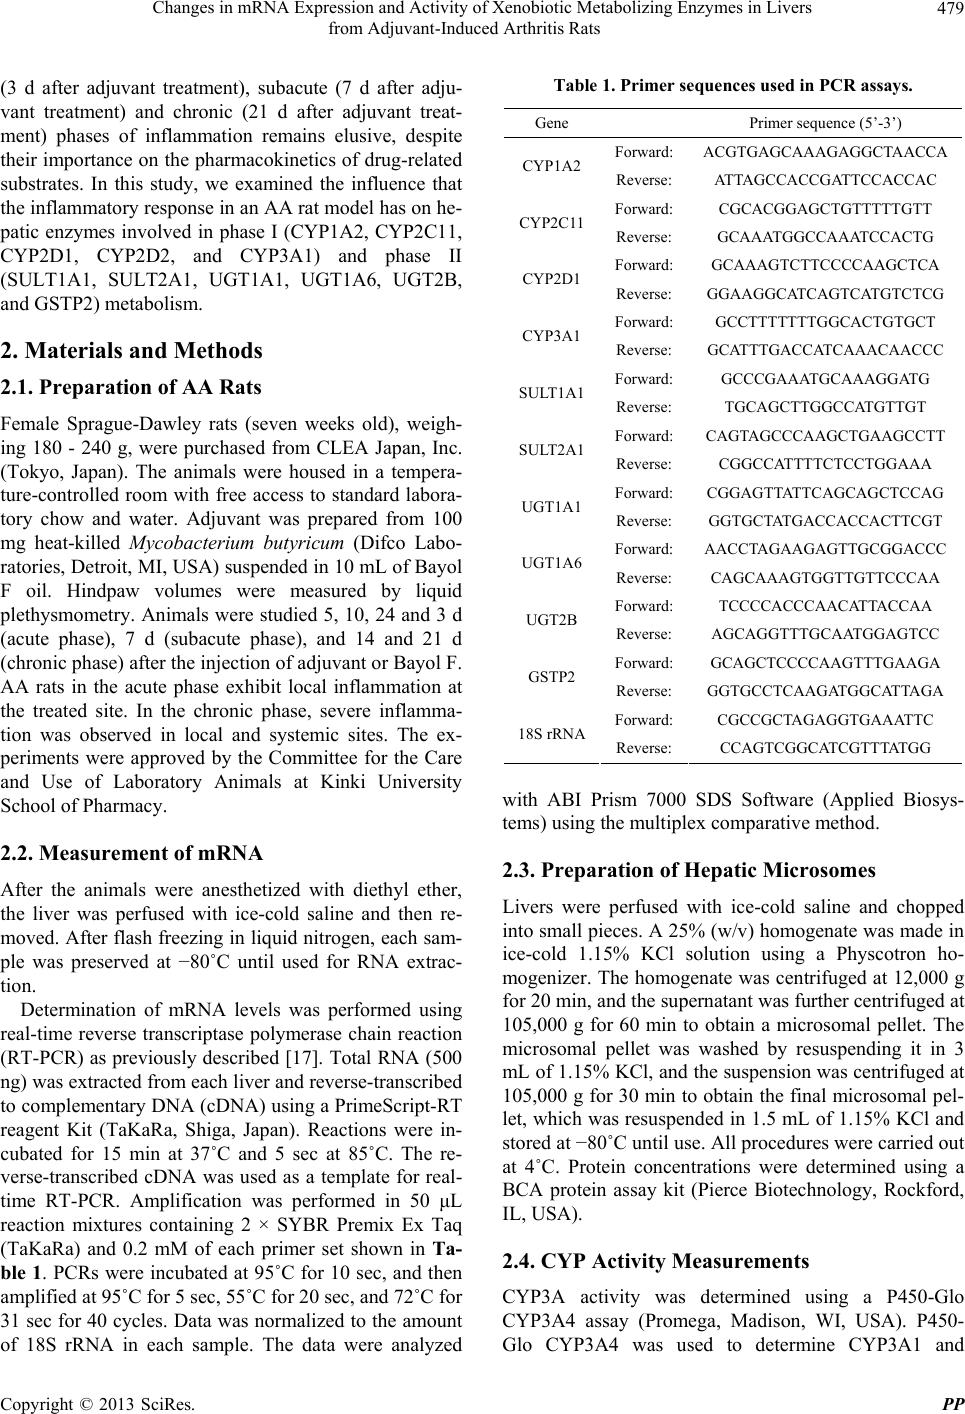 Changes in mRNA Expression and Activity of Xenobiotic Metabolizing Enzymes in Livers from Adjuvant-Induced Arthritis Rats 479 (3 d after adjuvant treatment), subacute (7 d after adju- vant treatment) and chronic (21 d after adjuvant treat- ment) phases of inflammation remains elusive, despite their importance on the pharmacokinetics of drug-related substrates. In this study, we examined the influence that the inflammatory response in an AA rat model has on he- patic enzymes involved in phase I (CYP1A2, CYP2C11, CYP2D1, CYP2D2, and CYP3A1) and phase II (SULT1A1, SULT2A1, UGT1A1, UGT1A6, UGT2B, and GSTP2) metabolism. 2. Materials and Methods 2.1. Preparation of AA Rats Female Sprague-Dawley rats (seven weeks old), weigh- ing 180 - 240 g, were purchased from CLEA Japan, Inc. (Tokyo, Japan). The animals were housed in a tempera- ture-controlled room with free access to standard labora- tory chow and water. Adjuvant was prepared from 100 mg heat-killed Mycobacterium butyricum (Difco Labo- ratories, Detroit, MI, USA) suspended in 10 mL of Bayol F oil. Hindpaw volumes were measured by liquid plethysmometry. Animals were studied 5, 10, 24 and 3 d (acute phase), 7 d (subacute phase), and 14 and 21 d (chronic phase) after the injection of adjuvant or Bayol F. AA rats in the acute phase exhibit local inflammation at the treated site. In the chronic phase, severe inflamma- tion was observed in local and systemic sites. The ex- periments were approved by the Committee for the Care and Use of Laboratory Animals at Kinki University School of Pharmacy. 2.2. Measurement of mRNA After the animals were anesthetized with diethyl ether, the liver was perfused with ice-cold saline and then re- moved. After flash freezing in liquid nitrogen, each sam- ple was preserved at −80˚C until used for RNA extrac- tion. Determination of mRNA levels was performed using real-time reverse transcriptase polymerase chain reaction (RT-PCR) as previously described [17]. Total RNA (500 ng) was extracted from each liver and reverse-transcribed to complementary DNA (cDNA) using a PrimeScript-RT reagent Kit (TaKaRa, Shiga, Japan). Reactions were in- cubated for 15 min at 37˚C and 5 sec at 85˚C. The re- verse-transcribed cDNA was used as a template for real- time RT-PCR. Amplification was performed in 50 μL reaction mixtures containing 2 × SYBR Premix Ex Taq (TaKaRa) and 0.2 mM of each primer set shown in Ta- ble 1. PCRs were incubated at 95˚C for 10 sec, and then amplified at 95˚C for 5 sec, 55˚C for 20 sec, and 72˚C for 31 sec for 40 cycles. Data was normalized to the amount of 18S rRNA in each sample. The data were analyzed Table 1. Primer sequence s use d in P CR assays. Gene Primer sequence (5’-3’) Forward: ACGTGAGCAAAGAGGCTAACCA CYP1A2 Reverse:ATTAGCCACCGATTCCACCAC Forward:CGCACGGAGCTGTTTTTGTT CYP2C11 Reverse:GCAAATGGCCAAATCCACTG Forward:GCAAAGTCTTCCCCAAGCTCA CYP2D1 Reverse:GGAAGGCATCAGTCATGTCTCG Forward:GCCTTTTTTTGGCACTGTGCT CYP3A1 Reverse:GCATTTGACCATCAAACAACCC Forward:GCCCGAAATGCAAAGGATG SULT1A1 Reverse:TGCAGCTTGGCCATGTTGT Forward:CAGTAGCCCAAGCTGAAGCCTT SULT2A1 Reverse:CGGCCATTTTCTCCTGGAAA Forward:CGGAGTTATTCAGCAGCTCCAG UGT1A1 Reverse:GGTGCTATGACCACCACTTCGT Forward: AACCTAGAAGAGTTGCGGACCC UGT1A6 Reverse:CAGCAAAGTGGTTGTTCCCAA Forward:TCCCCACCCAACATTACCAA UGT2B Reverse:AGCAGGTTTGCAATGGAGTCC Forward: GCAGCTCCCCAAGTTTGAAGA GSTP2 Reverse:GGTGCCTCAAGATGGCATTAGA Forward:CGCCGCTAGAGGTGAAATTC 18S rRNAReverse:CCAGTCGGCATCGTTTATGG with ABI Prism 7000 SDS Software (Applied Biosys- tems) using the multiplex comparative method. 2.3. Preparation of Hepatic Microsomes Livers were perfused with ice-cold saline and chopped into small pieces. A 25% (w/v) homogenate was made in ice-cold 1.15% KCl solution using a Physcotron ho- mogenizer. The homogenate was centrifuged at 12,000 g for 20 min, and the supernatant was further centrifuged at 105,000 g for 60 min to obtain a microsomal pellet. The microsomal pellet was washed by resuspending it in 3 mL of 1.15% KCl, and the suspension was centrifuged at 105,000 g for 30 min to obtain the final microsomal pel- let, which was resuspended in 1.5 mL of 1.15% KCl and stored at −80˚C until use. All procedures were carried out at 4˚C. Protein concentrations were determined using a BCA protein assay kit (Pierce Biotechnology, Rockford, IL, USA). 2.4. CYP Activity Measurements CYP3A activity was determined using a P450-Glo CYP3A4 assay (Promega, Madison, WI, USA). P450- Glo CYP3A4 was used to determine CYP3A1 and Copyright © 2013 SciRes. PP 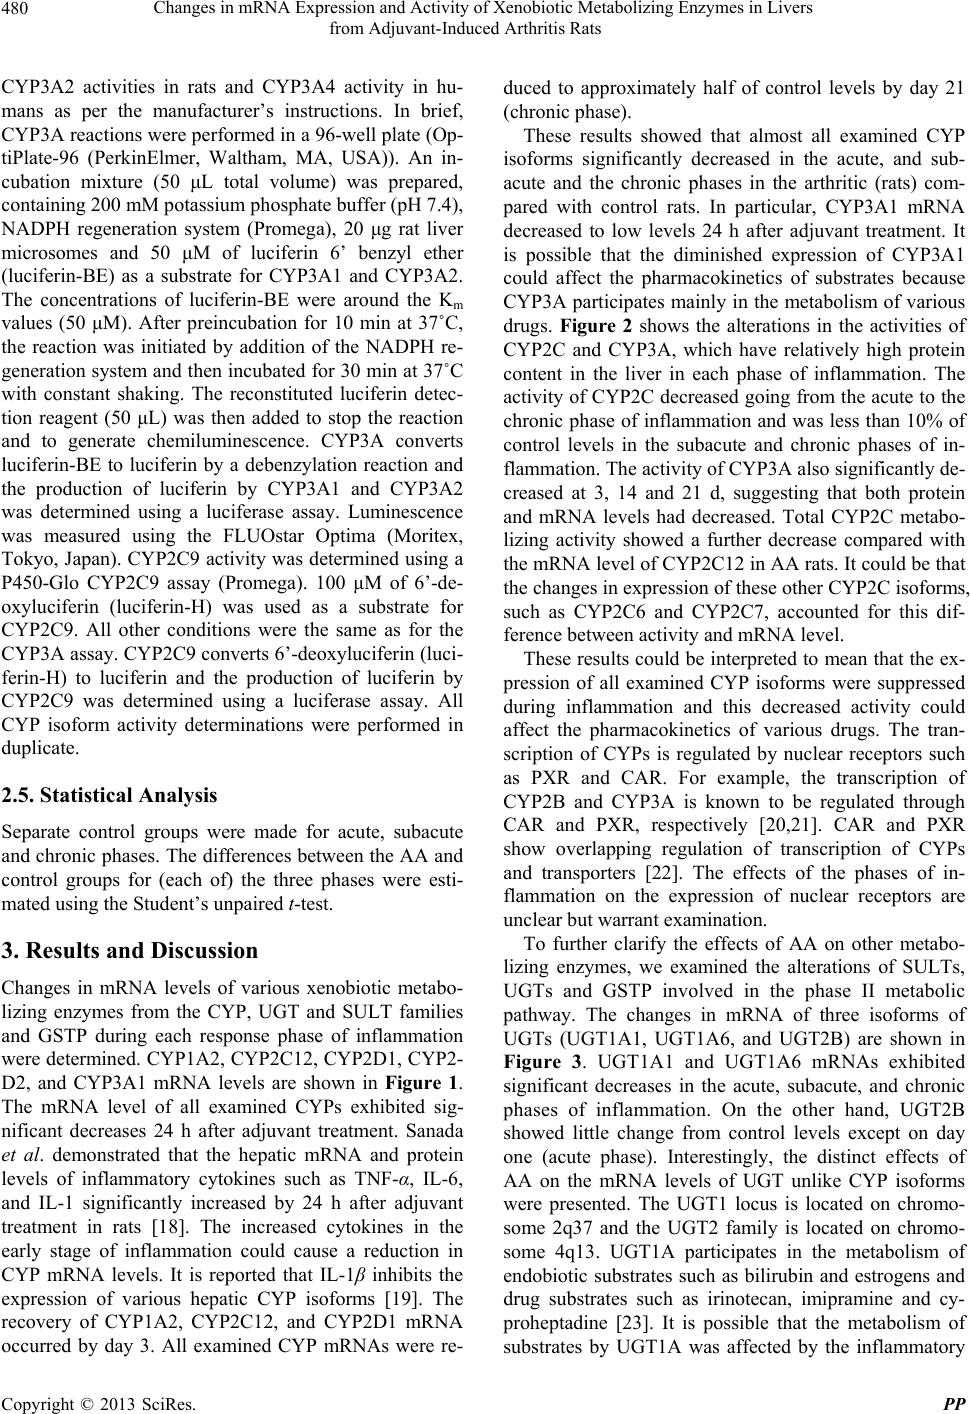 Changes in mRNA Expression and Activity of Xenobiotic Metabolizing Enzymes in Livers from Adjuvant-Induced Arthritis Rats 480 CYP3A2 activities in rats and CYP3A4 activity in hu- mans as per the manufacturer’s instructions. In brief, CYP3A reactions were performed in a 96-well plate (Op- tiPlate-96 (PerkinElmer, Waltham, MA, USA)). An in- cubation mixture (50 μL total volume) was prepared, containing 200 mM potassium phosphate buffer (pH 7.4), NADPH regeneration system (Promega), 20 μg rat liver microsomes and 50 μM of luciferin 6’ benzyl ether (luciferin-BE) as a substrate for CYP3A1 and CYP3A2. The concentrations of luciferin-BE were around the Km values (50 μM). After preincubation for 10 min at 37˚C, the reaction was initiated by addition of the NADPH re- generation system and then incubated for 30 min at 37˚C with constant shaking. The reconstituted luciferin detec- tion reagent (50 μL) was then added to stop the reaction and to generate chemiluminescence. CYP3A converts luciferin-BE to luciferin by a debenzylation reaction and the production of luciferin by CYP3A1 and CYP3A2 was determined using a luciferase assay. Luminescence was measured using the FLUOstar Optima (Moritex, Tokyo, Japan). CYP2C9 activity was determined using a P450-Glo CYP2C9 assay (Promega). 100 μM of 6’-de- oxyluciferin (luciferin-H) was used as a substrate for CYP2C9. All other conditions were the same as for the CYP3A assay. CYP2C9 converts 6’-deoxyluciferin (luci- ferin-H) to luciferin and the production of luciferin by CYP2C9 was determined using a luciferase assay. All CYP isoform activity determinations were performed in duplicate. 2.5. Statistical Analysis Separate control groups were made for acute, subacute and chronic phases. The differences between the AA and control groups for (each of) the three phases were esti- mated using the Student’s unpaired t-test. 3. Results and Discussion Changes in mRNA levels of various xenobiotic metabo- lizing enzymes from the CYP, UGT and SULT families and GSTP during each response phase of inflammation were determined. CYP1A2, CYP2C12, CYP2D1, CYP2- D2, and CYP3A1 mRNA levels are shown in Figure 1. The mRNA level of all examined CYPs exhibited sig- nificant decreases 24 h after adjuvant treatment. Sanada et al. demonstrated that the hepatic mRNA and protein levels of inflammatory cytokines such as TNF-α, IL-6, and IL-1 significantly increased by 24 h after adjuvant treatment in rats [18]. The increased cytokines in the early stage of inflammation could cause a reduction in CYP mRNA levels. It is reported that IL-1β inhibits the expression of various hepatic CYP isoforms [19]. The recovery of CYP1A2, CYP2C12, and CYP2D1 mRNA occurred by day 3. All examined CYP mRNAs were re- duced to approximately half of control levels by day 21 (chronic phase). These results showed that almost all examined CYP isoforms significantly decreased in the acute, and sub- acute and the chronic phases in the arthritic (rats) com- pared with control rats. In particular, CYP3A1 mRNA decreased to low levels 24 h after adjuvant treatment. It is possible that the diminished expression of CYP3A1 could affect the pharmacokinetics of substrates because CYP3A participates mainly in the metabolism of various drugs. Figure 2 shows the alterations in the activities of CYP2C and CYP3A, which have relatively high protein content in the liver in each phase of inflammation. The activity of CYP2C decreased going from the acute to the chronic phase of inflammation and was less than 10% of control levels in the subacute and chronic phases of in- flammation. The activity of CYP3A also significantly de- creased at 3, 14 and 21 d, suggesting that both protein and mRNA levels had decreased. Total CYP2C metabo- lizing activity showed a further decrease compared with the mRNA level of CYP2C12 in AA rats. It could be that the changes in expression of these other CYP2C isoforms, such as CYP2C6 and CYP2C7, accounted for this dif- ference between activity and mRNA level. These results could be interpreted to mean that the ex- pression of all examined CYP isoforms were suppressed during inflammation and this decreased activity could affect the pharmacokinetics of various drugs. The tran- scription of CYPs is regulated by nuclear receptors such as PXR and CAR. For example, the transcription of CYP2B and CYP3A is known to be regulated through CAR and PXR, respectively [20,21]. CAR and PXR show overlapping regulation of transcription of CYPs and transporters [22]. The effects of the phases of in- flammation on the expression of nuclear receptors are unclear but warrant examination. To further clarify the effects of AA on other metabo- lizing enzymes, we examined the alterations of SULTs, UGTs and GSTP involved in the phase II metabolic pathway. The changes in mRNA of three isoforms of UGTs (UGT1A1, UGT1A6, and UGT2B) are shown in Figure 3. UGT1A1 and UGT1A6 mRNAs exhibited significant decreases in the acute, subacute, and chronic phases of inflammation. On the other hand, UGT2B showed little change from control levels except on day one (acute phase). Interestingly, the distinct effects of AA on the mRNA levels of UGT unlike CYP isoforms were presented. The UGT1 locus is located on chromo- some 2q37 and the UGT2 family is located on chromo- some 4q13. UGT1A participates in the metabolism of endobiotic substrates such as bilirubin and estrogens and drug substrates such as irinotecan, imipramine and cy- proheptadine [23]. It is possible that the metabolism of substrates by UGT1A was affected by the inflammatory Copyright © 2013 SciRes. PP 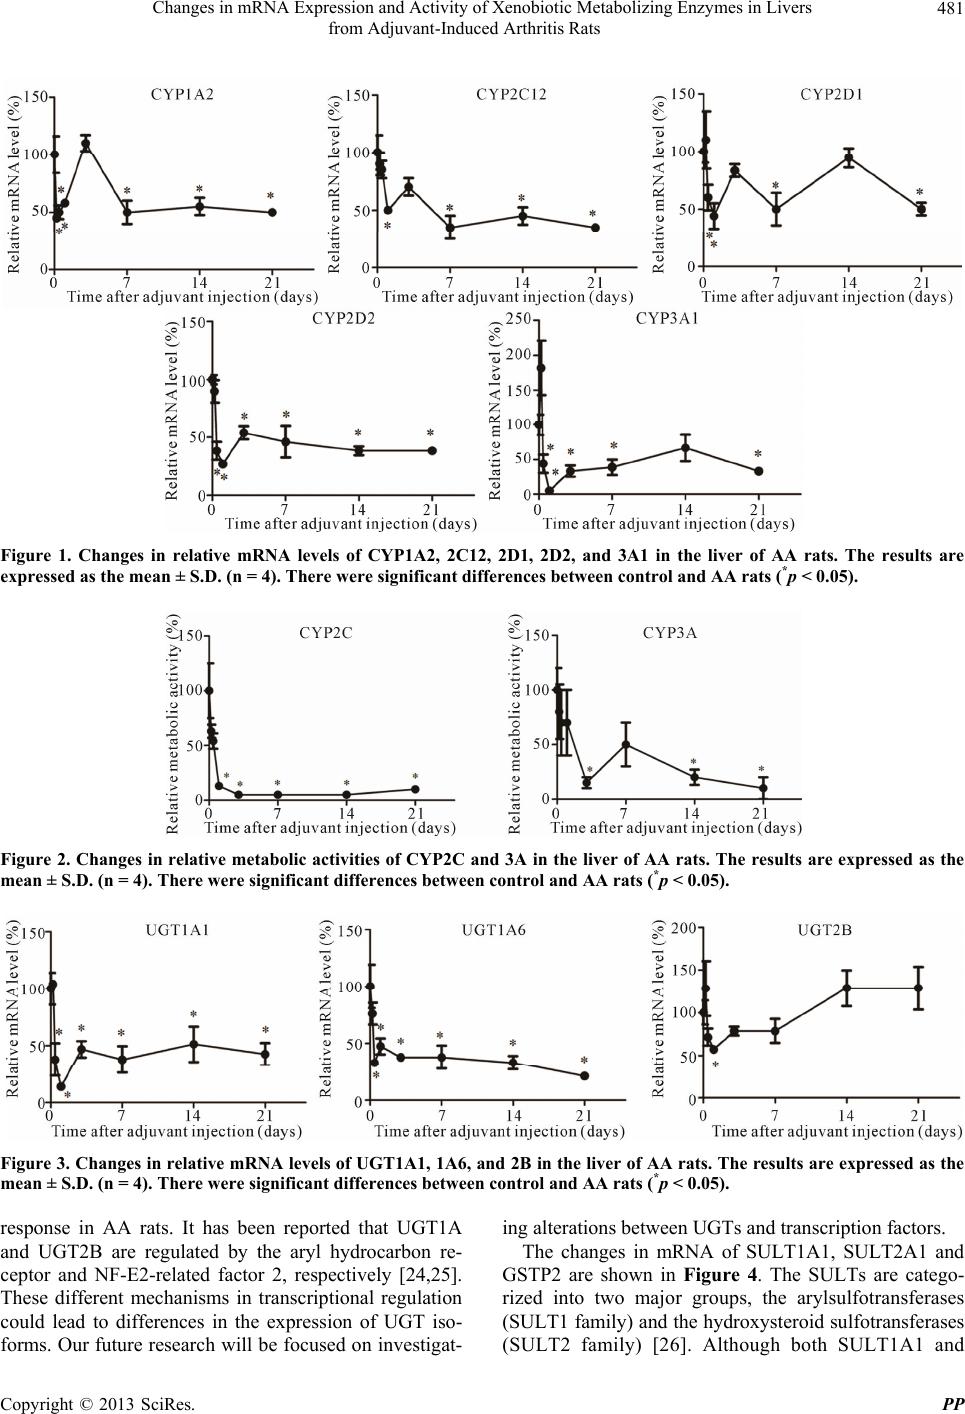 Changes in mRNA Expression and Activity of Xenobiotic Metabolizing Enzymes in Livers from Adjuvant-Induced Arthritis Rats Copyright © 2013 SciRes. PP 481 Figure 1. Changes in relative mRNA levels of CYP1A2, 2C12, 2D1, 2D2, and 3A1 in the liver of AA rats. The results are expressed as the mean ± S.D. (n = 4). There were significant differences between control and AA rats (*p < 0.05). Figure 2. Changes in relative metabolic activities of CYP2C and 3A in the liver of AA rats. The results are expressed as the mean ± S.D. (n = 4). There were significant differences between control and AA rats (*p < 0.05). Figure 3. Changes in relative mRNA levels of UGT1A1, 1A6, and 2B in the liver of AA rats. The results are expressed as the mean ± S.D. (n = 4). There were significant differences between control and AA rats (*p < 0.05). response in AA rats. It has been reported that UGT1A and UGT2B are regulated by the aryl hydrocarbon re- ceptor and NF-E2-related factor 2, respectively [24,25]. These different mechanisms in transcriptional regulation could lead to differences in the expression of UGT iso- forms. Our future research will be focused on investigat- ing alterations between UGTs and transcription factors. The changes in mRNA of SULT1A1, SULT2A1 and GSTP2 are shown in Figure 4. The SULTs are catego- rized into two major groups, the arylsulfotransferases (SULT1 family) and the hydroxysteroid sulfotransferases (SULT2 family) [26]. Although both SULT1A1 and 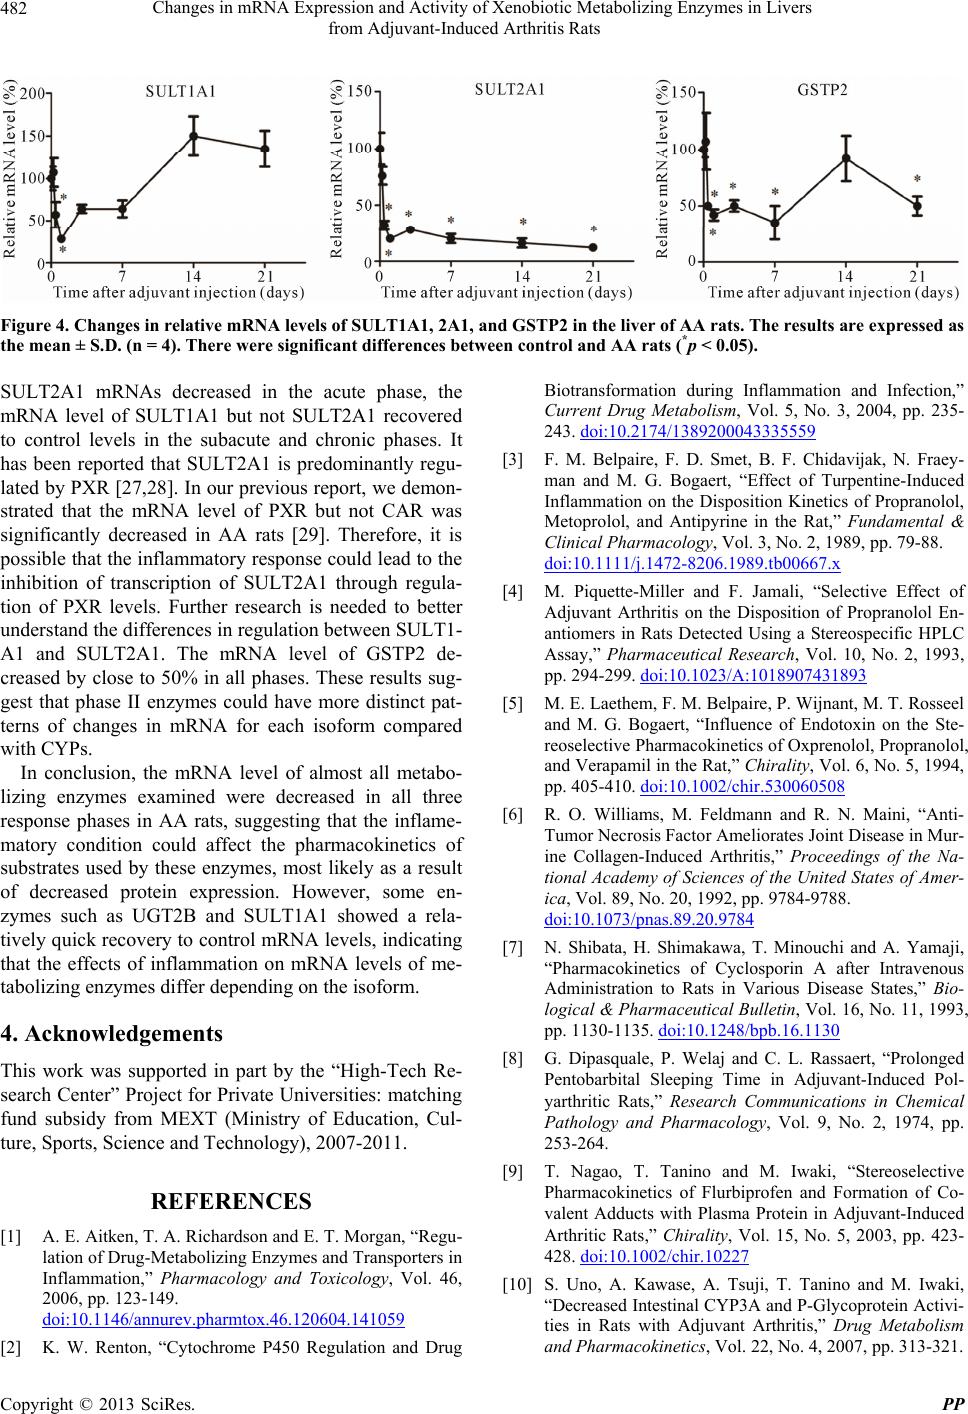 Changes in mRNA Expression and Activity of Xenobiotic Metabolizing Enzymes in Livers from Adjuvant-Induced Arthritis Rats 482 Figure 4. Changes in relative mRNA levels of SULT1A1, 2A1, and GSTP2 in the liver of AA rats. The results are expressed as the mean ± S.D. (n = 4). There were significant differences between control and AA rats (*p < 0.05). SULT2A1 mRNAs decreased in the acute phase, the mRNA level of SULT1A1 but not SULT2A1 recovered to control levels in the subacute and chronic phases. It has been reported that SULT2A1 is predominantly regu- lated by PXR [27,28]. In our previous report, we demon- strated that the mRNA level of PXR but not CAR was significantly decreased in AA rats [29]. Therefore, it is possible that the inflammatory response could lead to the inhibition of transcription of SULT2A1 through regula- tion of PXR levels. Further research is needed to better understand the differences in regulation between SULT1- A1 and SULT2A1. The mRNA level of GSTP2 de- creased by close to 50% in all phases. These results sug- gest that phase II enzymes could have more distinct pat- terns of changes in mRNA for each isoform compared with CYPs. In conclusion, the mRNA level of almost all metabo- lizing enzymes examined were decreased in all three response phases in AA rats, suggesting that the inflame- matory condition could affect the pharmacokinetics of substrates used by these enzymes, most likely as a result of decreased protein expression. However, some en- zymes such as UGT2B and SULT1A1 showed a rela- tively quick recovery to control mRNA levels, indicating that the effects of inflammation on mRNA levels of me- tabolizing enzymes differ depending on the isoform. 4. Acknowledgements This work was supported in part by the “High-Tech Re- search Center” Project for Private Universities: matching fund subsidy from MEXT (Ministry of Education, Cul- ture, Sports, Science and Technology), 2007-2011. REFERENCES [1] A. E. Aitken, T. A. Richardson and E. T. Morgan, “Regu- lation of Drug-Metabolizing Enzymes and Transporters in Inflammation,” Pharmacology and Toxicology, Vol. 46, 2006, pp. 123-149. doi:10.1146/annurev.pharmtox.46.120604.141059 [2] K. W. Renton, “Cytochrome P450 Regulation and Drug Biotransformation during Inflammation and Infection,” Current Drug Metabolism, Vol. 5, No. 3, 2004, pp. 235- 243. doi:10.2174/1389200043335559 [3] F. M. Belpaire, F. D. Smet, B. F. Chidavijak, N. Fraey- man and M. G. Bogaert, “Effect of Turpentine-Induced Inflammation on the Disposition Kinetics of Propranolol, Metoprolol, and Antipyrine in the Rat,” Fundamental & Clinical Pharmacology, Vol. 3, No. 2, 1989, pp. 79-88. doi:10.1111/j.1472-8206.1989.tb00667.x [4] M. Piquette-Miller and F. Jamali, “Selective Effect of Adjuvant Arthritis on the Disposition of Propranolol En- antiomers in Rats Detected Using a Stereospecific HPLC Assay,” Pharmaceutical Research, Vol. 10, No. 2, 1993, pp. 294-299. doi:10.1023/A:1018907431893 [5] M. E. Laethem, F. M. Belpaire, P. Wijnant, M. T. Rosseel and M. G. Bogaert, “Influence of Endotoxin on the Ste- reoselective Pharmacokinetics of Oxprenolol, Propranolol, and Verapamil in the Rat,” Chirality, Vol. 6, No. 5, 1994, pp. 405-410. doi:10.1002/chir.530060508 [6] R. O. Williams, M. Feldmann and R. N. Maini, “Anti- Tumor Necrosis Factor Ameliorates Joint Disease in Mur- ine Collagen-Induced Arthritis,” Proceedings of the Na- tional Academy of Sciences of the United States of Amer- ica, Vol. 89, No. 20, 1992, pp. 9784-9788. doi:10.1073/pnas.89.20.9784 [7] N. Shibata, H. Shimakawa, T. Minouchi and A. Yamaji, “Pharmacokinetics of Cyclosporin A after Intravenous Administration to Rats in Various Disease States,” Bio- logical & Pharmaceutical Bulletin, Vol. 16, No. 11, 1993, pp. 1130-1135. doi:10.1248/bpb.16.1130 [8] G. Dipasquale, P. Welaj and C. L. Rassaert, “Prolonged Pentobarbital Sleeping Time in Adjuvant-Induced Pol- yarthritic Rats,” Research Communications in Chemical Pathology and Pharmacology, Vol. 9, No. 2, 1974, pp. 253-264. [9] T. Nagao, T. Tanino and M. Iwaki, “Stereoselective Pharmacokinetics of Flurbiprofen and Formation of Co- valent Adducts with Plasma Protein in Adjuvant-Induced Arthritic Rats,” Chirality, Vol. 15, No. 5, 2003, pp. 423- 428. doi:10.1002/chir.10227 [10] S. Uno, A. Kawase, A. Tsuji, T. Tanino and M. Iwaki, “Decreased Intestinal CYP3A and P-Glycoprotein Activi- ties in Rats with Adjuvant Arthritis,” Drug Metabolism and Pharmacokinetics, Vol. 22, No. 4, 2007, pp. 313-321. Copyright © 2013 SciRes. PP  Changes in mRNA Expression and Activity of Xenobiotic Metabolizing Enzymes in Livers from Adjuvant-Induced Arthritis Rats 483 doi:10.2133/dmpk.22.313 [11] G. W. Warren, S. M. Poloyac, D. S. Gary, M. P. Mattson and R. A. Blouin, “Hepatic Cytochrome P-450 Expres- sion in Tumor Necrosis Factor-Alpha Receptor (p55/p75) Knockout Mice after Endotoxin Administration,” Journal of Pharmacology and Experimental Therapeutics, Vol. 288, No. 3, 1999, pp. 945-950. [12] E. Siewert, R. Bort, R. Kluge, P. C. Heinrich, J. Castell and R. Jover, “Hepatic Cytochrome P450 Down-Regula- tion during Aseptic Inflammation in the Mouse Is Inter- leukin 6 Dependent,” Hepatology, Vol. 32, No. 1, 2000, pp. 49-55. doi:10.1053/jhep.2000.8532 [13] E. T. Morgan, “Regulation of Cytochrome P450 by In- flammatory Mediators: Why and How?” Drug Metabo- lism and Disposition, Vol. 29, No. 3, 2001, pp. 207-212. [14] P. Honkakoski, I. Zelko, T. Sueyoshi and M. Negishi, “The Nuclear Orphan Receptor CAR-Retinoid X Recep- tor Heterodimer Activates the Phenobarbital-Responsive Enhancer Module of the CYP2B Gene,” Molecular and Cellular Biology, Vol. 18, No. 10, 1998, pp. 5652-5658. [15] S. A. Kliewer, J. T. Moore, L. Wade, J. L. Staudinger, M. A. Watson, S. A. Jones, D. D. McKee, B. B. Oliver, T. M. Willson, R. H. Zetterstrom, T. Perlmann and J. M. Leh- mann, “An Orphan Nuclear Receptor Activated by Preg- nanes Defines a Novel Steroid Signaling Pathway,” Cell, Vol. 92, No. 1, 1998, pp. 73-82. doi:10.1016/S0092-8674(00)80900-9 [16] D. J. Waxman, “P450 Gene Induction by Structurally Di- verse Xenochemicals: Central Role of Nuclear Receptors CAR, PXR, and PPAR,” Archives of Biochemistry and Biophysics, Vol. 369, No. 1, 1999, pp. 11-23. doi:10.1006/abbi.1999.1351 [17] A. Kawase, A. Fujii, M. Negoro, R. Akai, M. Ishikubo, H. Komura and M. Iwaki, “Differences in Cytochrome P450 and Nuclear Receptor mRNA Levels in Liver and Small Intestine between SD and DA Rats,” Drug Metabolism and Pharmacokinetics, Vol. 23, No. 3, 2008, pp. 196-206. doi:10.2133/dmpk.23.196 [18] H. Sanada, M. Sekimoto, A. Kamoshita and M. Degawa, “Changes in Expression of Hepatic Cytochrome P450 Subfamily Enzymes during Development of Adjuvant- Induced Arthritis in Rats,” Journal of Toxicological Sci- ences, Vol. 36, No. 2, 2011, pp. 181-190. doi:10.2131/jts.36.181 [19] E. Assenat, S. Gerbal-Chaloin, D. Larrey, J. Saric, J. M. Fabre, P. Maurel, M. J. Vilarem and J. M. Pascussi, “In- terleukin 1β Inhibits CAR-Induced Expression of Hepatic Genes Involved in Drug and Bilirubin Clearance,” Hepa- tology, Vol. 40, No. 4, 2009, pp. 951-960. [20] S. A. Kliewer, J. T. Moore, L. Wade, J. L. Staudinger, M. A. Watson, S. A. Jones, D. D. McKee, B. B. Oliver, T. M. Willson, R. H. Zetterstrom, T. Perlmann and J. M. Leh- mann, “An Orphan Nuclear Receptor Activated by Preg- nanes Defines a Novel Steroid Signaling Pathway,” Cell, Vol. 92, No. 1, 1998, pp. 73-82. doi:10.1016/S0092-8674(00)80900-9 [21] B. Goodwin, E. Hodgson and C. Liddle, “The Orphan Human Pregnane X Receptor Mediates the Transcrip- tional Activation of CYP3A4 by Rifampicin through a Distal Enhancer Module,” Molecular Pharmacology, Vol. 56, No. 6, 1999, pp. 1329-1339. [22] J. M. Maglich, C. M. Stoltz, B. Goodwin, D. Hawkins- Brown, J. T. Moore and S. A. Kliewer, “Nuclear Preg- nane x Receptor and Constitutive Androstane Receptor Regulate Overlapping but Distinct Sets of Genes Involved in Xenobiotic Detoxification,” Molecular Pharmacology, Vol. 62, No. 3, 2002, pp. 638-646. doi:10.1124/mol.62.3.638 [23] T. Izukawa, M. Nakajima, R. Fujiwara, H. Yamanaka, T. Fukami, M. Takamiya, Y. Aoki, S. Ikushiro, T. Sakaki and T. Yokoi, “Quantitative Analysis of UDP-Glucuro- nosyltransferase (UGT) 1A and UGT2B Expression Lev- els in Human Livers,” Drug Metabolism and Disposition, Vol. 37, No. 8, 2009, pp. 1759-1768. doi:10.1124/dmd.109.027227 [24] R. L. Yeager, S. A. Reisman, L. M. Aleksunes and C. D. Klaassen, “Introducing the TCDD-Inducible AhR-Nrf2 Gene Battery,” Toxicological Sciences, Vol. 111, No. 2, 2009, pp. 238-246. doi:10.1093/toxsci/kfp115 [25] S. Chen, D. Beaton, N. Nguyen, K. Seneko-Effenberger, E. Brace-Sinnokrak, U. Argikar, R. P. Remmel, J. Trottier, O. Barbier, J. K. Ritter and R. H. Tukey, “Tissue-Specific, Inducible, and Hormonal Control of the Human UDP- Glucuronosyltransferase-1 (UGT1) Locus,” Journal of Bio- logical Chemistry., Vol. 280, 2005, pp. 37547-37557. doi:10.1074/jbc.M506683200 [26] T. P. Dooley, R. Haldeman-Cahill, J. Joiner and T. W. Wilborn, “Expression Profiling of Human Sulfotrans- ferase and Sulfatase Gene Superfamilies in Epithelial Tis- sues and Cultured Cells,” Biochemical and Biophysical Research Communications, Vol. 277, No. 1, 2000, pp. 236-245. doi:10.1006/bbrc.2000.3643 [27] M. Runge-Morris, W. Wu and T. A. Kocarek, “Regula- tion of Rat Hepatic Hydroxysteroid Sulfotransferase (SULT2-40/41) Gene Expression by Glucocorticoids: Evi- dence for a Dual Mechanism of Transcriptional Control,” Molecular Pharmacology, Vol. 56, No. 6, 1999, pp. 1198- 1206. [28] J. Sonoda, W. Xie, J. M. Rosenfeld, J. L. Barwick, P. S. Guzelian and R. M. Evans, “Regulation of a Xenobiotic Sulfonation Cascade by Nuclear Pregnane X Receptor (PXR),” Proceedings of the National Academy of Sci- ences of the United States of America, Vol. 99, No. 21, 2002, pp. 13801-13806. doi:10.1073/pnas.212494599 [29] S. Uno, M. Uraki, A. Ito, Y. Shinozaki, A. Yamada, A. Kawase and M. Iwaki, “Changes in mRNA Expression of ABC and SLC Transporters in Liver and Intestines of the Adjuvant-Induced Arthritis Rat,” Biopharmaceutics & Drug Disposition, Vol. 30, No. 1, 2009, pp. 49-54. doi:10.1002/bdd.639 Copyright © 2013 SciRes. PP |