

Paper Menu >>
Journal Menu >>
 Advances in Bioscience and Biotechnology, 2013, 4, 24-32 ABB http://dx.doi.org/10.4236/abb.2013.49A004 Published Online September 2013 (http://www.scirp.org/journal/abb/) Carbon utilization profile of a thermophilic fungus, Thermomyces lanuginosus using phenotypic microarray Nokuthula Peace Mchunu1,2*, Kugen Permaul1, Maqsudul Alam2,3, Suren Singh1 1Department of Biotechnology and Food Technology, Durban University of Technology, Durban, South Africa 2Centre for Chemical Biology, University Sains Malaysia, Bayan Lepas, Penang, Malaysia 3Advanced Studies in Genomics, Proteomics and Bioinformatics, University of Hawaii, Honolulu, USA Email: *[email protected] Received 29 June 2013; revised 30 July 2013; accepted 26 August 2013 Copyright © 2013 Nokuthula Peace Mchunu et al. This is an open access article distributed under the Creative Commons Attribution License, which permits unrestricted use, distribution, and reproduction in any medium, provided the original work is properly cited. ABSTRACT The thermophilic filamentous fungus, Thermomyces lanuginosus produces the largest amount of xylanase reported. In addition to this, it expresses large amount of other enzymes that have been used indus- trially or have academic interest. Thus, this fungus has a potential to be applied for biomass conversion to produce biofuel or other applications. In this study, the Biolog system was used to characterize the utilisa- tion and growth of T. lanuginosus on 95 carbon sources. The carbohydrates based compounds, both single sugars and oligosaccharide, showed the best utilisation profile, with the pentose sugar xylose in- ducing the highest growth, followed by trehelose, raf- finose, D-mannose turanose fructose and glucose. Among oligosaccharides, sucrose had the highest my- celium formation followed by stachyose, maltose, maltotriose, glycogen and dextrin. Interestingly the fungus also grew well on cellobiose suggesting that this fungus can produce cellulose hydrolysing pro- teins. D-alanine was the best amino acid to promote fungal growth while the effect of other amino acids tested was similar to the control. These results dem- onstrate the ability of this fungus to grow relatively well on most plant based compounds thus making this fungus a possible candidate for plant biomass conver- sion which can be applied to a number of biotechno- logical applications including biofuel production. Keywords: Filamentous Fungi; Thermophilic; Carbon Source; Hexose; Pentose 1. INTRODUCTION The importance of fungi and other microorganisms is widely acknowledged, primarily due to their application in biotechnology industries as well as the effects they have on human health. Fungi are able to produce a vari- ety of biotechnology products which include industrial enzymes, enzymes used in bioassays or for diagnostics, antibiotics, and enzymes involved in bioremediation [1,2]. During industrial application and scientific re- search, specific metabolic pathways or molecules that are related to a particular process are studied in depth. This however can lead to the overlooking of other molecules or useful products. The invention of genomics has pro- duced a wealth of data, however to understand those data one must understand the relationship of genes within an organism and the interactions of gene products in me- tabolism. The area of studying either gene or protein interactions on a larger scale is a relatively new field as it has spilled over from genomics. Although high-throughput screens for bacteria and unicellular fungi (yeast) using knock-out experiments are used frequently, this technique is labour intensive and time consuming. Even after obtaining mu- tants, methods of characterization can be limited or ex- pensive as in the case of DNA microarrays. Alternative approaches for the characterization of functional genes are being developed and advanced [3]. One approach is to focus on the effect of a particular gene at a cellular level and to assess how it affects the organism as a whole. Therefore, phenotypic characteristics that the organism displays, become markers (for the effect) of a particular gene with relatively high certainty. Although phenotyp- ing has been around for some time, it still provides a very useful way to describe biological differences be- tween cells. As such, a specific phenotype is the final goal of any strain enhancement process for new products or processes. Therefore a good phenotypic assay method would be beneficiary in functional genomics [4]. Like many organisms, the natural habitat of fungi in- *Corresponding author. OPEN ACCESS  N. P. Mchunu et al. / Advances in Bioscience and Biotechnology 4 (2013) 24-32 25 fluences what phenotype it will display. The natural en- vironments of fungi involve many factors including, nu- trients, physical factors and other organisms. The nutri- ents are the major contributor of phenotypic characteris- tics, thus assessing nutrient requirements is vital. In the- ory, a complete phenotyping assay will involve a combi- nation of hundreds of carbon source, nitrogen sources, phosphate, sulphur and other nutrients. This will push the boundaries with assay numbers of hundreds of thousands when including other physical factors such as tempera- ture, pH and O2. Such scales are not feasible for most laboratories due to labour and cost restrictions. The in- troduction of the Phenotypic MicroArray System (PM) from Biolog Incorporated (Harvard, California) offers a viable screening option for most researchers and indus- tries. The Biolog system is designed for high throughput screening of different basic nutrient sources, additives required for growth and antagonistic compounds for nu- merous microorganisms including filamentous fungi. The phenotypic assays are designed from a physiological perspective to survey in vivo function of diverse path- ways including both metabolic and regulatory pathways. Included in the tests are basic cellular nutritional path- ways for C, N, P, and S metabolism, pH growth range and regulation of pH control, sensitivity to NaCl and various other ions, and sensitivity to chemical agents that disrupt various biological pathways. The FF database also analyzes fungal growth via turbidimetric analysis (Biolog, Inc, CA). Analysis of both color development and turbidity provides for extremely accurate identifica- tions to the species level [5,6]. One of the most desired characteristics of numerous industries is the ability of an organism to utilize any plant biomass. Optimizing plant biomass conversion is a pre- dominant factor identified for improving the production of an economical biofuel production. One of the obsta- cles however, is finding a suitable organism that is capa- ble of converting different carbohydrate compounds and that has biological and physiological characteristics to be able to fit in this process. An organism that has a poten- tial to be applied in this area is T. lanuginosus. Thus thermophilic filamentous fungus produces a wide range of thermostable enzyme including a large group of car- bohydrate hydrolyses. These enzymes include: amylase, glucoamylase, xylanase, lipase, phytase, protease and chitinase [2]. These thermostable enzymes can be applied in different industries including the food industry for the production of sugar syrup, animal feed industry, pulp and paper industry and bioremediation/bio-conversion of waste industry [7]. Based on this organism’s ability to produce carbohydrate hydrolases and other useful en- zyme like lipases, it has been proposed that T. lanugino- sus may contain previously unidentified proteins that have ability to act on the different carbohydrate material and this can be anaylsed using the Biolog system. FF MicroPlate is specifically designed for the testing of car- bon utilisation in filamentous fungi and yeast, including species from the genera Aspergillus, Penicillium, Fusa- rium, Alternaria, Mucor , Gliocladium, Cladosporium, Paecilomyces, Stachybotrys, Trichoderma, Zygosaccha- romyces, Acremonium, Beauveria, Botryosphaeria, Bo- trytis, Candida, and Geotrichum (Biolog, Inc.). This arti- cle discusses the use of Phenotypic MicroArray using the FF MicroPlate to assess the ability of T. lanuginosus to utilize different carbon sources. 2. MATERIALS AND METHODS The experiments were performed by growing T. lanugi- nosus on 2% malt extract agar at 50˚C for 5 - 7 days until spore formation was visible. Global carbon assimilation profiles were evaluated by using Biolog FF MicroPlate (Biolog, Inc., Hayward, CA). The FF MicroPlate test panel contains 95 wells, each with a different carbon- containing compound, and one well with water as control. The inoculum for the 96 well FF plates for the biology system was prepared by first soaking a sterile swab then gently rolling over the plate. The spores were suspended in 16 ml of FF inoculum media supplied by Biolog in glass tubes the mixed gently by hand. The spore suspend- sion used was approximately 75% transmittance at 590 nm using the Biolog Tubidometer. 100 µl of the spore suspension was added to each well and microplates were incubated at 50˚C. Sample were done in triplicates and readings were taken using the Biolog Microstation, at 2 h intervals until 68 h. Water and tween 80 were used as controls. Biolog software was used to measure growth or bio- mass at the absorbance of 750 nm, while assimilation (general uptake and usage) was evaluated at 490 nm by measuring the formation of a reddish-orange colour. Joining Cluster Analysis was used to group carbon sources utilized by T. lanuginosus using the Minitab 16 software (Minitab Inc.) and was applied to identify the different groups of carbon sources from the experimental data set. The joining cluster analysis was designed by means of the Euclidean distance with complete linkage. Out of the 95 compounds used in this analysis for the purpose of this study, only compound belonging to car- bohydrates and amino acid groups will be discussed in details (Figure 1). 3. RESULTS 3.1. Cluster Analysis of Carbon Source Assimilation and Growth Profiles Carbon source utilization profiles for T. lanuginosus were analyzed using cluster analysis. The data generated was divided into 4 distinct clusters for assimilation Copyright © 2013 SciRes. OPEN ACCESS 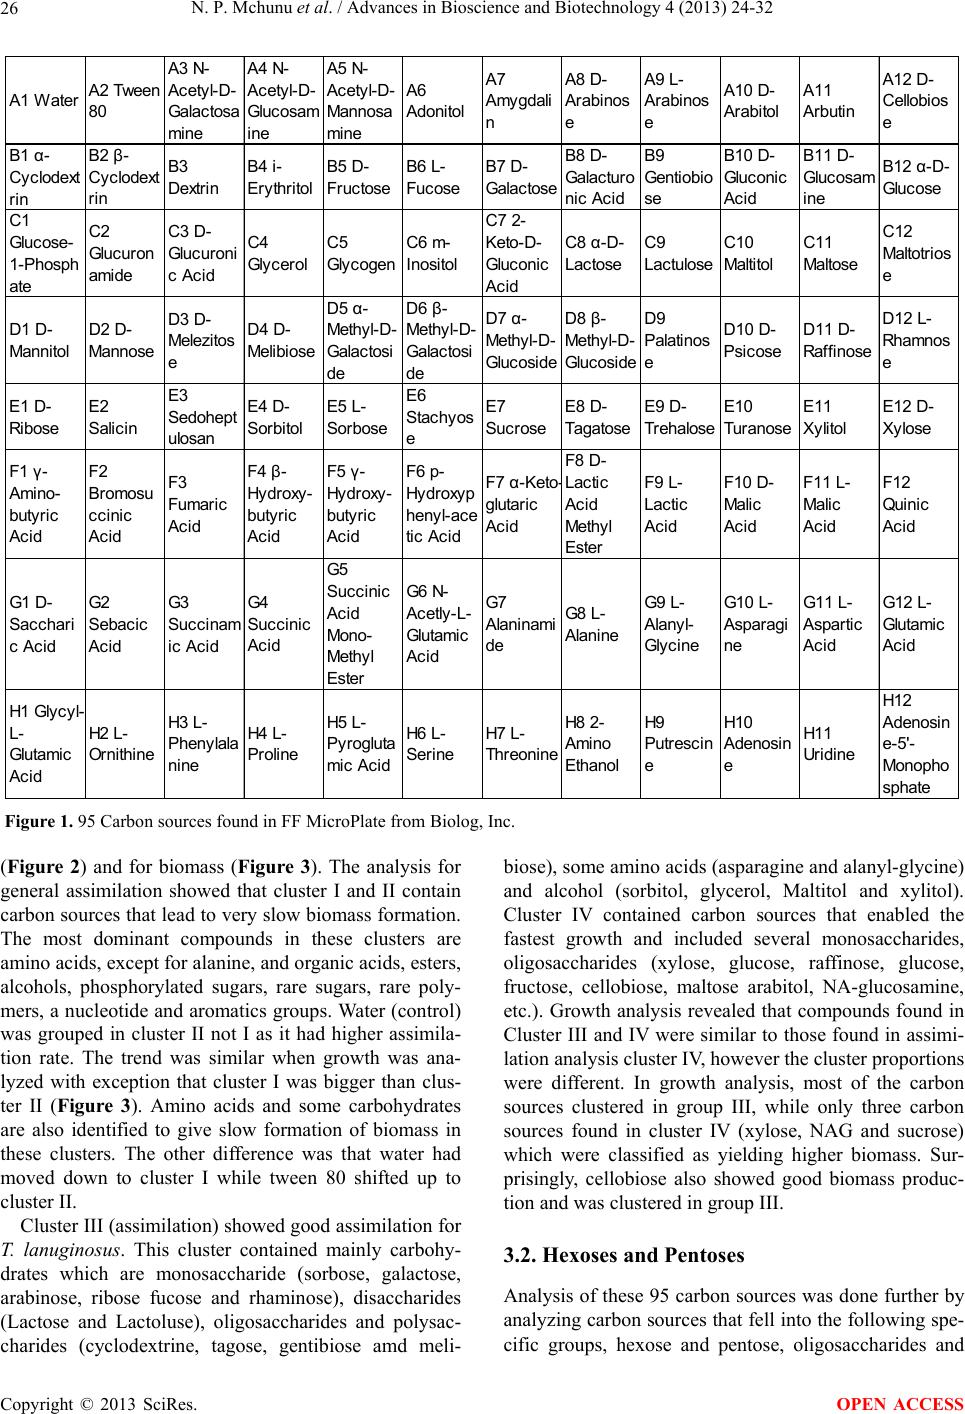 N. P. Mchunu et al. / Advances in Bioscience and Biotechnology 4 (2013) 24-32 Copyright © 2013 SciRes. 26 A1 Water A2 Tween 80 A3 N- Acetyl-D- Ga l act o sa mine A4 N- Acetyl-D- Glucosam ine A5 N- Acetyl-D- Mannosa mine A6 Adonitol A7 Amygdali n A8 D- Arabinos e A9 L- Arabinos e A10 D- Arabitol A11 Arbutin A12 D- Cellobios e B1 α- Cyclodext rin B2 β- Cyclodext rin B3 Dextrin B4 i- Erythritol B5 D- Fructose B6 L- Fucose B7 D- Galactose B8 D- Ga l acturo nic Acid B9 Gentiobio se B10 D- Gluconic Acid B11 D- Glucosam ine B12 α-D- Glucose C1 Glucose- 1-Phosph ate C2 Glucuron amide C3 D- Glucuroni c Acid C4 Glycerol C5 Glycogen C6 m- Inositol C7 2- Keto-D - Gluconic Acid C8 α-D- Lactose C9 Lactulose C10 Maltitol C11 Maltose C12 Maltotrios e D1 D- Mannitol D2 D- Mannose D3 D- Melezitos e D4 D- Melibiose D5 α- Methyl-D- Galactosi de D6 β- Me t hyl-D - Ga l actos i de D7 α- Me t hyl-D - Glucoside D8 β- Methyl-D- Glucoside D9 Palatinos e D10 D- Psicose D11 D- Raffinose D12 L- Rhamnos e E1 D- Ribose E2 Salicin E3 Sedohept ulosan E4 D- Sorbitol E5 L- Sorbose E6 Stachyos e E7 Sucrose E8 D- Tagatose E9 D- Trehalose E10 Turanose E11 Xylitol E12 D- Xylose F1 γ- Amino- butyric Acid F2 Br omosu ccinic Acid F3 Fumaric Acid F4 β- Hydroxy- butyric Acid F5 γ- Hydroxy- butyric Acid F6 p- Hydroxyp henyl-ace tic Acid F7 α-Keto - glutaric Acid F8 D- Lactic Acid Methyl Ester F9 L- Lactic Acid F10 D- Malic Acid F11 L- Malic Acid F12 Quinic Acid G1 D- Sacchari c Acid G2 Sebacic Acid G3 Succinam ic Acid G4 Succinic Acid G5 Succinic Acid Mono- Methyl Ester G6 N- Acetly-L- Glutamic Acid G7 Alaninami de G8 L- Alanine G9 L- Alanyl- Glycine G10 L- Asparagi ne G11 L- Aspartic Acid G12 L- Glutamic Acid H1 Glycyl- L- Glutamic Acid H2 L- Ornithine H3 L- Ph e n yla la nine H4 L- Proline H5 L- Pyrogluta mic Acid H6 L- Serine H7 L- Threonine H8 2- Amino Ethanol H9 Putrescin e H10 Adenosin e H11 Uridine H12 Adenosin e-5'- Monopho sphate Figure 1. 95 Carbon sources found in FF MicroPlate from Biolog, Inc. (Figure 2) and for biomass (Figure 3). The analysis for general assimilation showed that cluster I and II contain carbon sources that lead to very slow biomass formation. The most dominant compounds in these clusters are amino acids, except for alanine, and organic acids, esters, alcohols, phosphorylated sugars, rare sugars, rare poly- mers, a nucleotide and aromatics groups. Water (control) was grouped in cluster II not I as it had higher assimila- tion rate. The trend was similar when growth was ana- lyzed with exception that cluster I was bigger than clus- ter II (Figure 3). Amino acids and some carbohydrates are also identified to give slow formation of biomass in these clusters. The other difference was that water had moved down to cluster I while tween 80 shifted up to cluster II. Cluster III (assimilation) showed good assimilation for T. lanuginosus. This cluster contained mainly carbohy- drates which are monosaccharide (sorbose, galactose, arabinose, ribose fucose and rhaminose), disaccharides (Lactose and Lactoluse), oligosaccharides and polysac- charides (cyclodextrine, tagose, gentibiose amd meli- biose), some amino acids (asparagine and alanyl-glycine) and alcohol (sorbitol, glycerol, Maltitol and xylitol). Cluster IV contained carbon sources that enabled the fastest growth and included several monosaccharides, oligosaccharides (xylose, glucose, raffinose, glucose, fructose, cellobiose, maltose arabitol, NA-glucosamine, etc.). Growth analysis revealed that compounds found in Cluster III and IV were similar to those found in assimi- lation analysis cluster IV, however the cluster proportions were different. In growth analysis, most of the carbon sources clustered in group III, while only three carbon sources found in cluster IV (xylose, NAG and sucrose) which were classified as yielding higher biomass. Sur- prisingly, cellobiose also showed good biomass produc- tion and was clustered in group III. 3.2. Hexoses and Pentoses Analysis of these 95 carbon sources was done further by analyzing carbon sources that fell into the following spe- ific groups, hexose and pentose, oligosaccharides and c OPEN ACCESS 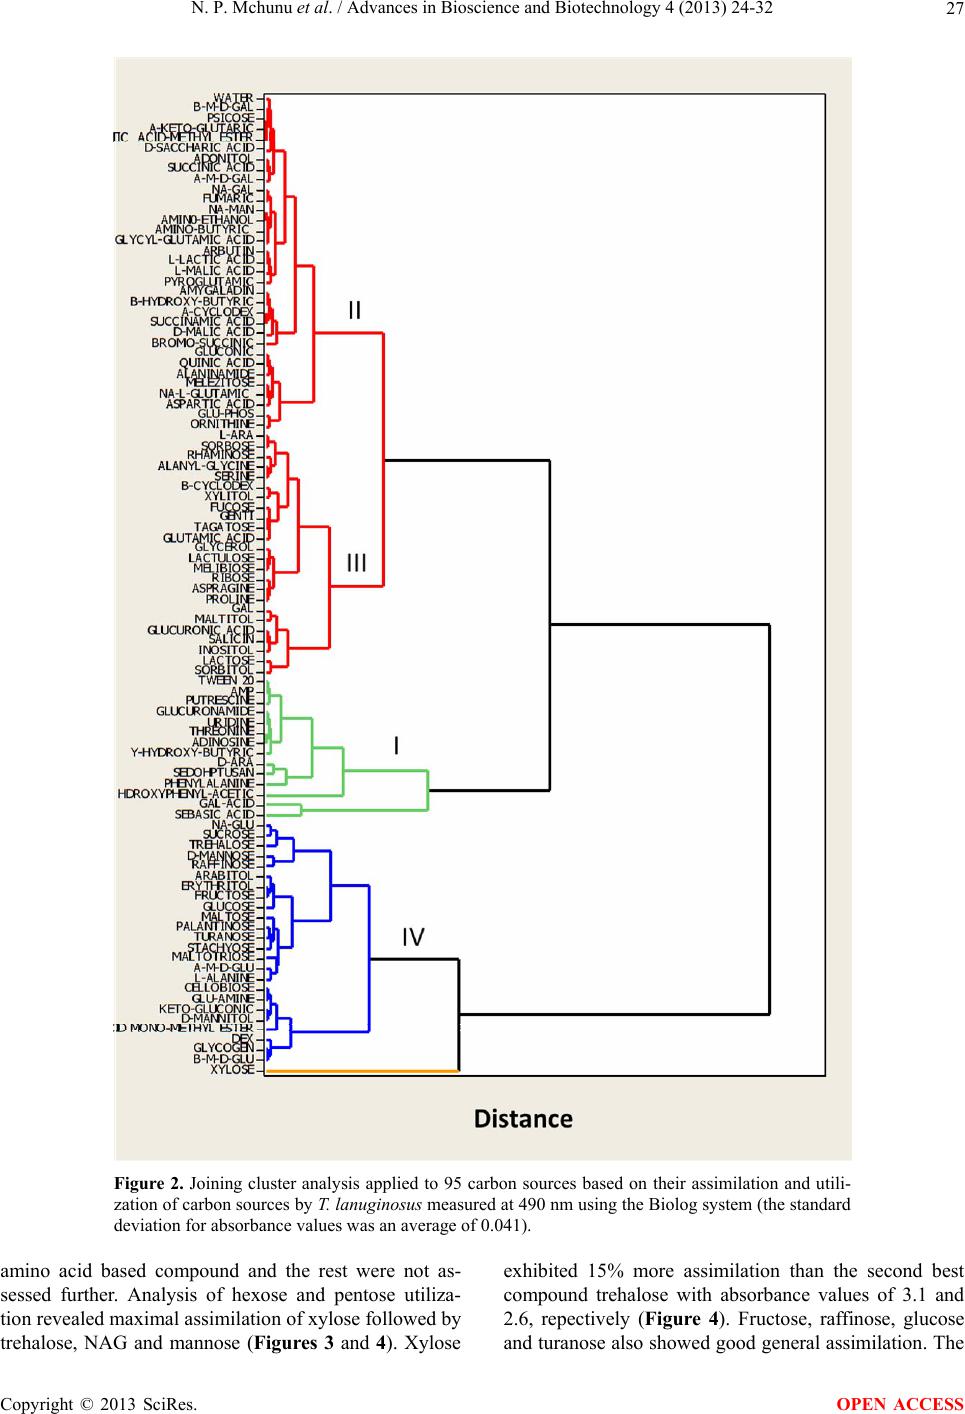 N. P. Mchunu et al. / Advances in Bioscience and Biotechnology 4 (2013) 24-32 27 Figure 2. Joining cluster analysis applied to 95 carbon sources based on their assimilation and utili- zation of carbon sources by T. lanuginosus measured at 490 nm using the Biolog system (the standard deviation for absorbance values was an average of 0.041). amino acid based compound and the rest were not as- sessed further. Analysis of hexose and pentose utiliza- tion revealed maximal assimilation of xylose followed by trehalose, NAG and mannose (Figures 3 and 4). Xylose exhibited 15% more assimilation than the second best compound trehalose with absorbance values of 3.1 and 2.6, repectively (Figure 4). Fructose, raffinose, glucose nd turanose also showed good general assimilation. The a Copyright © 2013 SciRes. OPEN ACCESS 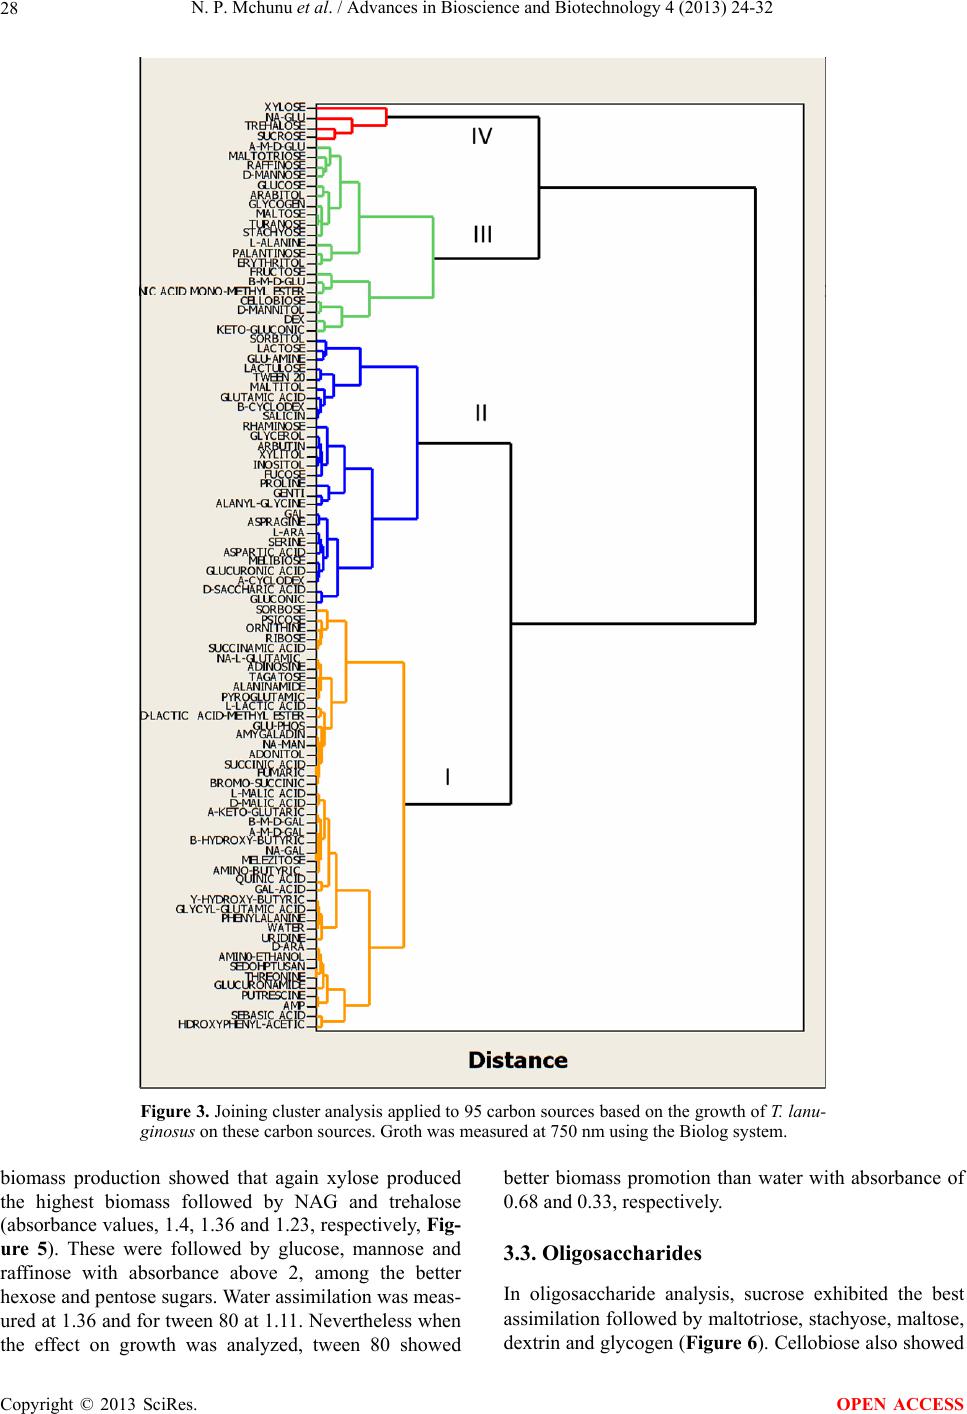 N. P. Mchunu et al. / Advances in Bioscience and Biotechnology 4 (2013) 24-32 28 Figure 3. Joining cluster analysis applied to 95 carbon sources based on the growth of T. lanu- ginosus on these carbon sources. Groth was measured at 750 nm using the Biolog system. biomass production showed that again xylose produced the highest biomass followed by NAG and trehalose (absorbance values, 1.4, 1.36 and 1.23, respectively, Fig- ure 5). These were followed by glucose, mannose and raffinose with absorbance above 2, among the better hexose and pentose sugars. Water assimilation was meas- ured at 1.36 and for tween 80 at 1.11. Nevertheless when the effect on growth was analyzed, tween 80 showed better biomass promotion than water with absorbance of 0.68 and 0.33, respectively. 3.3. Oligosaccharides In oligosaccharide analysis, sucrose exhibited the best assimilation followed by maltotriose, stachyose, maltose, extrin and glycogen (Figure 6). Cellobiose also showed d Copyright © 2013 SciRes. OPEN ACCESS  N. P. Mchunu et al. / Advances in Bioscience and Biotechnology 4 (2013) 24-32 29 Figure 4. Assimilation of monomeric sugars (hexose and pentose) by T. lanuginosus SSBP. The as- similation was measured at an absorbance of 490 nm for 68 hours at 2 hour intervals. Figure 5. Growth of T. lanuginosus SSBP in monomeric sugars (hexose and pentose). The growth was measured at an absorbance of 750 nm for 68 hours at 2 hour intervals. Figure 6. Assimilation of oligosaccharides by T. lanuginosus SSBP. The assimilation was measured at an absorbance of 490 nm for 68 hours at 2 hour intervals. Copyright © 2013 SciRes. OPEN ACCESS  N. P. Mchunu et al. / Advances in Bioscience and Biotechnology 4 (2013) 24-32 30 relatively good general assimilation. Water assimilation was lower than most of common carbohydrates while the assimilation of rare occurring carbohydrate compounds was even lower than water and tween 80 (sedoheptulose and gentibiose). In biomass production sucrose again produced the most biomass followed by maltose, glyco- gen, maltose, stachyose, palantiose, cellobiose and dex- trin (Figure 7). Again common carbohydrate compounds supported more biomass production in T. lanuginosus than rare compounds. 3.4. Amino A cids Amino acid analysis, L-alanine displayed the best as- similation followed by proline, asparagine, and glutamic acid (Figure 8). Gylcyl-glutamic acid gave the lowest assimilation even lower than water and tween 80. It was also noted that although most of the amino acid base compounds had high assimilation, they were unable to support significant biomass production. In biomass pro- duction L-alanine yielded greater biomass when com- pared to other amino acids (Figure 9). The rest of the amino acid compounds produced less biomass than tween 80 but more than water except for threonine which was lower. 4. DISCUSSION In nature the ability of a microorganism to use a variety of compounds is vital for survival in composting envi- ronment as different substrates are degraded and utilised by different organisms. Filamentous fungi play a vital role in this ecological dynamics as they are responsible for the majority of the hydrolysis [8,9]. T. lanugiosus is Figure 7. Growth of T. lanuginosus SSBP in oligosaccharide compounds. The growth was measured at an absorbance of 750 nm for 68 hours at 2 hour intervals. Figure 8. Assimilation of amino acid based compounds by T. lanuginosus SSBP. The assimilation was measured at an absorbance of 490 nm for 68 hours at 2 hour intervals. Copyright © 2013 SciRes. OPEN ACCESS  N. P. Mchunu et al. / Advances in Bioscience and Biotechnology 4 (2013) 24-32 31 Figure 9. Growth of T. lanuginosus SSBP in amino acid based compounds. The growth was measured at an absorbance of 750 nm for 68 hours at 2 hour intervals. among those fungal organisms that thrive in such envi- ronments with an added ability to survive high tempera- ture which is only for a select few eukaryotic organisms [10]. The analysis of carbon source assimilation and utilization for biomass production in this organism re- vealed a similar profile to other filamentous fungi studies of this nature where glucose, xylose, trehalose and NAG produced high biomass in Trichoderma reesei and As- pergillus niger [5]. Although the clusters in these studies were similar to our findings, closer analysis of Cluster IV revealed that for T. lanuginosus, xylose is the preferred sugar compared to glucose. This concurs with reports that T. lanuginosus has the most powerful system for xylanase production and xylose utilization and thus it was expected that xylose would produce the most bio- mass and have the highest assimilation [11-13] However, the most interesting finding was the high cellobiose utilization as this organism is well reported as a cellulose free organism. T. lanuginosus has been pre- viously described as non-cellulolytic and it was sug- gested that it probably relies on commensal relationships in composts with cellulolytic fungi [13-15]. In this study, growth on cellobiose suggests that this fungus produces enzymes that have cellulose related activity. This is in agreement with unpublished data on genome sequencing of this fungus revealing that 8 predicted genes are with the possibility of having cellulose activity. Of the 8 genes, 3 were similar to Trichoderma reesei cellulases and the others to Aspergillus kawachi [16,17]. Trehalose also produced good biomass and assimila- tion in T. lanuginosus. The suggested reason for this is that trehalose is used by the organisms as an energy source; however there is a more important reason in thermophilic organisms. Trehalose has been widely re- ported as a part of the physiological adaptation to various environmental stresses e.g. high temperature, in yeasts and filamentous fungi [18]. NAG also had high assimila- tion and biomass production because it is the building block of fungal cell walls which contain chitin and also can be converted to energy molecule, therefore high as- similation and the ability to support growth were ex- pected [19]. It was surprising that only one amino acid, alanine, produced significant biomass. This may be be- cause alanine is one of the few amino acids that can transform into glucose and can be used in TCA cycle to provide energy for the cell, thus it may be preferred by this fungus to supplement the supply of mineral nitrogen and energy [20]. In conclusion, this study indicates that T. lanuginosus is a versatile organism that can utilize a diverse range of carbon sources, including carbohydrates, amino acids, carboxylic acids, polymers, aromatics, esters, phos- phorylated and sugar alcohols. The application of Phe- notypic Array as a tool of carbon utilization studies is a quick approach to studying and assessing filamentous fungi for specific activities. 5. ACKNOWLEDGEMENTS This study was supported by grants from the National Research Foun- dation, Republic of South Africa and collaboration with the Centre for Chemical Biology, University Sains Malaysia. The authors are thankful to Dr. Alison Winger, a Research Associate in Dept. Biotechnology and Food Technology Durban University of Technology, for valuable suggestions and critical evaluation of the manuscript. REFERENCES [1] Ghorai, S., Banik, P., Verma, D., Chowdhury, S., Muk- herjee, S. and Khowala, S. (2009) Fungal biotechnology in food and feed processing. Food Research International, 42, 577-587. doi:10.1016/j.foodres.2009.02.019 [2] Singh, S., Madlala, A.M. and Prior, B.A. (2003) Ther- Copyright © 2013 SciRes. OPEN ACCESS  N. P. Mchunu et al. / Advances in Bioscience and Biotechnology 4 (2013) 24-32 32 momyces lanuginosus: Properties of strains and their he- micellulases. FEMS Microbiology Reviews, 27, 3-16. [3] Nitsche, B.M., Crabtree, J., Cerqueira, G.C., Meyer, V., Ram, A.F.J. and Wortman, J.R. (2011) New resources for functional analysis of omics data for the genus aspergil- lus. BMC Genomics, 12, 486. [4] Murat, C., Riccioni, C., Belfiori, B., Cichocki, N., Labba, J., Morin, E., Tisserant, E., Paolocci, F., Rubini, A. and Martin, F. (2012) Distribution and localization of mi- crosatellites in the perigord black truffle genome and identification of new molecular markers. Fungal Genetics and Biology, 48, 592-601. doi:10.1016/j.fgb.2010.10.007 [5] Druzhinina, I., S. , Schmoll, M., Seiboth, B. and Kubicek, C., P. (2005) Global carbon utilization profiles of wild- type, mutant, transformant strains of Hypocrea jecorina. Applied and Environmantal Microbiology, 72, 2126- 2133. [6] Singh, M.P. (2009) Application of biolog ff microplate for substrate utilization and metabolite profiling of clo- sely related fungi. Journal of Microbiological Methods, 77, 102-108. doi:10.1016/j.mimet.2009.01.014 [7] Maheshwari, R., Bharadwaj, G. and Mahakingesgwara, K.B. (2000) Thermophilic fungi: Their physiology and enzymes. Microbiology and Molecular Biology Reviews, 64, 461-488. doi:10.1128/MMBR.64.3.461-488.2000 [8] Tang, J.-C. and Katayama, A. (2005) Relating quinone profile to the aerobic biodegradation in thermophilic composting processes of cattle manure with various bul- king agents. World Journal of Microbiology and Bio- technology, 21, 1249-1254. [9] Yu, H., Zeng, G., Huang, H., Xi, X., Wang, R., Huang, D., Huang, G. and Li, J. (2007) Microbial community succession and lignocellulose degradation during agri- cultural waste composting. Biodegradation, 18, 793-802. [10] Puchart, V., Katapodis, P. and Biely, P. (1999) Produc- tion of xylanases, mannanases and pectinases by the the- mophilic Fungus Thermomyces lanuginosus. Enzyme Mi- crobial Technology, 24, 355-361. [11] Dodd, D., Mackie, R., I and Cann, I., K.O. (2011) Xylan degradation, a metabolic property shared by rumen and human colonic bacteroidetes. Molecular Microbiology, 79, 292-304. doi:10.1111/j.1365-2958.2010.07473.x [12] Kuttanpillai, S.K., Ayyachamy, M., Kugen, P. and Suren, S. (2009) Production of β-xylanase by a Thermomyces lanuginosus mc 134 mutant on corn cobs and its applica- tion in biobleaching of bagasse pulp. Journal of Biosci- ence and Bioengineering, 107, 494-498. doi:10.1016/j.jbiosc.2008.12.020 [13] Singh, S., Reddy, P., Haarhoff, J., Biely, P., Janse, B., Pillay, B., Pillay, D. and Prior, B.A. (2000) Relatedness of Thermomyces lanuginosus strains producing a thermo- stable xylanase. Journal of Biotechnology, 81, 119-128. [14] Manimaran, A., Kuttan-Pillai, S.K., Permaul, K. and Sin- gh, S. (2009) Hyper production of cellulase-free xylanase by Thermomyces lanuginosus ssbp on bagasse pulp and its application in biobleaching. Applied Microbiology and Biotechnology, 81, 887-893. [15] Purkarthofer, H., Sinner, M. and Steiner, W. (1993) Cel- lulase-free xylanase from Thermomyces lanuginosus: Op- timization of production in submerged and solid-state culture. Enzyme and Microbial Technology, 15, 677-682. [16] Martinez, D., Cullen, D., Danchin, E.G.J., Grigoriev, I.V., Harris, P., Jackson, M., Kubicek, C.P., Han, C.S., Ho, I., Larrondo, L.F., de Leon, A.L., Berka, R.M., Magnuson, J.K., Merino, S., Misra, M., Nelson, B., Putnam, N., Robbertse, B., Salamov, A.A., Schmoll, M., Terry, A., Thayer, N., Henrissat, B., Westerholm-Parvinen, A., Schoch, C.L., Yao, J., Barabote, R., Barbote, R., Nelson, M.A., Detter, C., Bruce, D., Kuske, C.R., Xie, G., Salo- heimo, M., Richardson, P., Rokhsar, D.S., Lucas, S.M., Rubin, E.M., Dunn-Coleman, N., Ward, M., Brettin, T.S., Arvas, M., Baker, S.E., Chapman, J., Chertkov, O. and Coutinho, P.M. (2008) Genome sequencing and analysis of the biomass-degrading fungus Trichoderma reesei (syn. Hypocrea jecorina). Nature Biotechnology, 26, 553-560. doi:10.1038/nbt1403 [17] Zhao, Z., Liu, H., Wang, C. and Xu, J.-R. (2013) Com- parative analysis of fungal genomes reveals different plant cell wall degrading capacity in fungi. BMC Genom- ics, 14, 274. doi:10.1186/1471-2164-14-274 [18] Ferreira, A.S., Tótola, M.R. and Borges, A.C. (2007) Physiological implications of trehalose in the ectomy- corrhizal fungus pisolithus sp. Under thermal stress. Journal of Thermal Biology, 32, 34-41. doi:10.1016/j.jtherbio.2006.08.009 [19] Hartl, L., Zach, S. and Seidl-Seiboth, V. (2012) Fungal chitinases: Diversity, mechanistic properties and biote- chnological potential. Applied Microbiology and Biote- chnology, 93, 533-543. doi:10.1007/s00253-011-3723-3 [20] Bechem, E.E.T. (2012) Utilisation of organic and inor- ganic nitrogen sources by Scleroderma sinnamariense mont. Isolated from Gnetum africanum welw. African Journal of Biotechnology, 11, 9205-9213. Copyright © 2013 SciRes. OPEN ACCESS |