

Paper Menu >>
Journal Menu >>
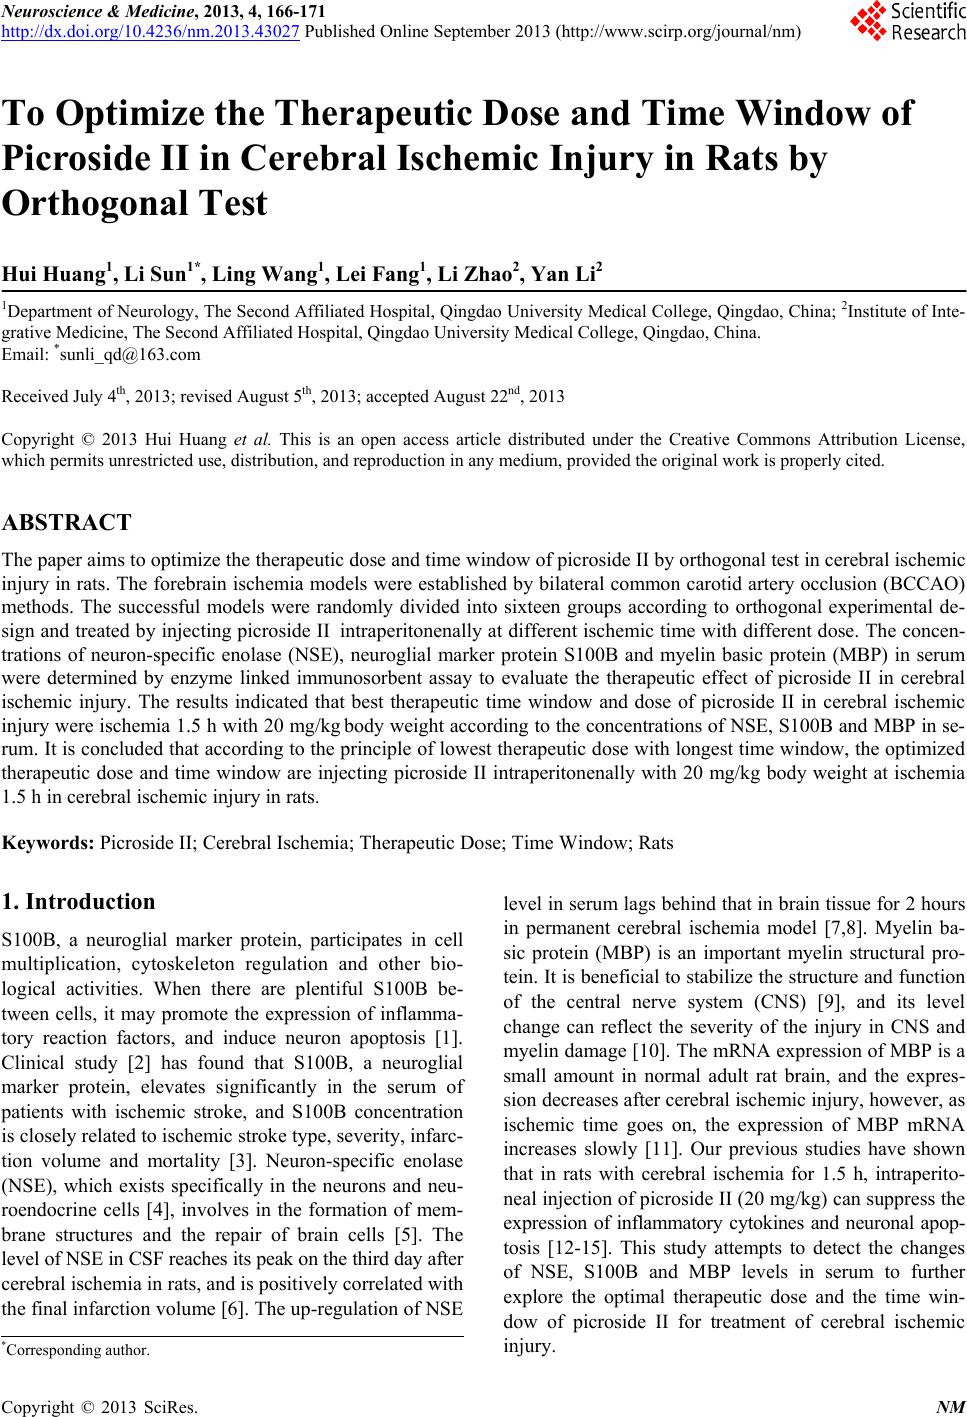 Neuroscience & Medicine, 2013, 4, 166-171 http://dx.doi.org/10.4236/nm.2013.43027 Published Online September 2013 (http://www.scirp.org/journal/nm) To Optimize the Therapeutic Dose and Time Window of Picroside II in Cerebral Ischemic Injury in Rats by Orthogonal Test Hui Huang1, Li Sun1*, Ling Wang1, Lei Fang1, Li Zhao2, Yan Li2 1Department of Neurology, The Second Affiliated Hospital, Qingdao University Medical College, Qingdao, China; 2Institute of Inte- grative Medicine, The Second Affiliated Hospital, Qingdao University Medical College, Qingdao, China. Email: *[email protected] Received July 4th, 2013; revised August 5th, 2013; accepted August 22nd, 2013 Copyright © 2013 Hui Huang et al. This is an open access article distributed under the Creative Commons Attribution License, which permits unrestricted use, distribution, and reproduction in any medium, provided the original work is properly cited. ABSTRACT The paper aims to optimize the therapeutic dose and time window of picroside II by orthogonal test in cerebral ischemic injury in rats. The forebrain ischemia models were established by bilateral common carotid artery occlusion (BCCAO) methods. The successful models were randomly divided into sixteen groups according to orthogonal experimental de- sign and treated by injecting picroside II intraperitonenally at different ischemic time with different dose. The concen- trations of neuron-specific enolase (NSE), neuroglial marker protein S100B and myelin basic protein (MBP) in serum were determined by enzyme linked immunosorbent assay to evaluate the therapeutic effect of picroside II in cerebral ischemic injury. The results indicated that best therapeutic time window and dose of picroside II in cerebral ischemic injury were ischemia 1.5 h with 20 mg/kg body weight according to the concentrations of NSE, S100B and MBP in se- rum. It is concluded that according to the principle of lowest therapeutic dose with longest time window, the optimized therapeutic dose and time window are injecting picroside II intraperitonenally with 20 mg/kg body weight at ischemia 1.5 h in cerebral ischemic injury in rats. Keywords: Picroside II; Cerebral Ischemia; Therapeutic Dose; Time Window; Rats 1. Introduction S100B, a neuroglial marker protein, participates in cell multiplication, cytoskeleton regulation and other bio- logical activities. When there are plentiful S100B be- tween cells, it may promote the expression of inflamma- tory reaction factors, and induce neuron apoptosis [1]. Clinical study [2] has found that S100B, a neuroglial marker protein, elevates significantly in the serum of patients with ischemic stroke, and S100B concentration is closely related to ischemic stroke type, severity, infarc- tion volume and mortality [3]. Neuron-specific enolase (NSE), which exists specifically in the neurons and neu- roendocrine cells [4], involves in the formation of mem- brane structures and the repair of brain cells [5]. The level of NSE in CSF reaches its peak on the third day after cerebral ischemia in rats, and is positively correlated with the final infarction volume [6]. The up-regulation of NSE level in serum lags behind that in brain tissue for 2 hours in permanent cerebral ischemia model [7,8]. Myelin ba- sic protein (MBP) is an important myelin structural pro- tein. It is beneficial to stabilize the structure and function of the central nerve system (CNS) [9], and its level change can reflect the severity of the injury in CNS and myelin damage [10]. The mRNA expression of MBP is a small amount in normal adult rat brain, and the expres- sion decreases after cerebral ischemic injury, however, as ischemic time goes on, the expression of MBP mRNA increases slowly [11]. Our previous studies have shown that in rats with cerebral ischemia for 1.5 h, intraperito- neal injection of picroside II (20 mg/kg) can suppress the expression of inflammatory cytokines and neuronal apop- tosis [12-15]. This study attempts to detect the changes of NSE, S100B and MBP levels in serum to further explore the optimal therapeutic dose and the time win- dow of picroside II for treatment of cerebral ischemic injury. *Corresponding author. Copyright © 2013 SciRes. NM 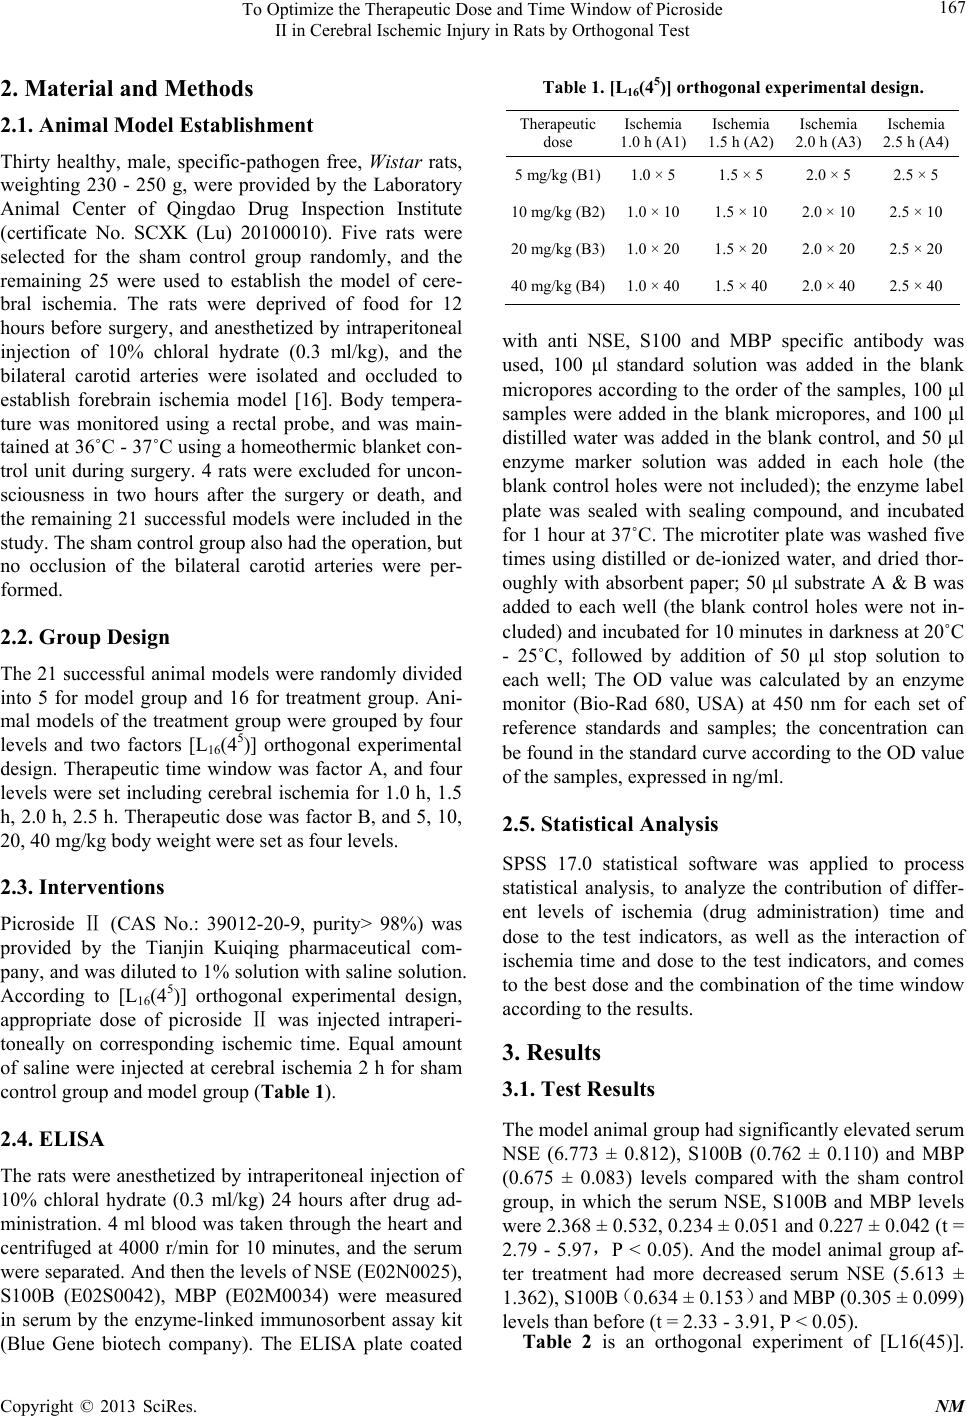 To Optimize the Therapeutic Dose and Time Window of Picroside II in Cerebral Ischemic Injury in Rats by Orthogonal Test 167 2. Material and Methods 2.1. Animal Model Establishment Thirty healthy, male, specific-pathogen free, Wistar rats, weighting 230 - 250 g, were provided by the Laboratory Animal Center of Qingdao Drug Inspection Institute (certificate No. SCXK (Lu) 20100010). Five rats were selected for the sham control group randomly, and the remaining 25 were used to establish the model of cere- bral ischemia. The rats were deprived of food for 12 hours before surgery, and anesthetized by intraperitoneal injection of 10% chloral hydrate (0.3 ml/kg), and the bilateral carotid arteries were isolated and occluded to establish forebrain ischemia model [16]. Body tempera- ture was monitored using a rectal probe, and was main- tained at 36˚C - 37˚C using a homeothermic blanket con- trol unit during surgery. 4 rats were excluded for uncon- sciousness in two hours after the surgery or death, and the remaining 21 successful models were included in the study. The sham control group also had the operation, but no occlusion of the bilateral carotid arteries were per- formed. 2.2. Group Design The 21 successful animal models were randomly divided into 5 for model group and 16 for treatment group. Ani- mal models of the treatment group were grouped by four levels and two factors [L16(45)] orthogonal experimental design. Therapeutic time window was factor A, and four levels were set including cerebral ischemia for 1.0 h, 1.5 h, 2.0 h, 2.5 h. Therapeutic dose was factor B, and 5, 10, 20, 40 mg/kg body weight were set as four levels. 2.3. Interventions Picroside (CAS ⅡNo.: 39012-20-9, purity> 98%) was provided by the Tianjin Kuiqing pharmaceutical com- pany, and was diluted to 1% solution with saline solution. According to [L16(45)] orthogonal experimental design, appropriate dose of picroside was injected intraⅡperi- toneally on corresponding ischemic time. Equal amount of saline were injected at cerebral ischemia 2 h for sham control group and model group (Table 1). 2.4. ELISA The rats were anesthetized by intraperitoneal injection of 10% chloral hydrate (0.3 ml/kg) 24 hours after drug ad- ministration. 4 ml blood was taken through the heart and centrifuged at 4000 r/min for 10 minutes, and the serum were separated. And then the levels of NSE (E02N0025), S100B (E02S0042), MBP (E02M0034) were measured in serum by the enzyme-linked immunosorbent assay kit (Blue Gene biotech company). The ELISA plate coated Table 1. [L16(45)] orthogonal experimental design. Therapeutic dose Ischemia 1.0 h (A1) Ischemia 1.5 h (A2) Ischemia 2.0 h (A3) Ischemia 2.5 h (A4) 5 mg/kg (B1)1.0 × 5 1.5 × 5 2.0 × 5 2.5 × 5 10 mg/kg (B2)1.0 × 10 1.5 × 10 2.0 × 10 2.5 × 10 20 mg/kg (B3)1.0 × 20 1.5 × 20 2.0 × 20 2.5 × 20 40 mg/kg (B4)1.0 × 40 1.5 × 40 2.0 × 40 2.5 × 40 with anti NSE, S100 and MBP specific antibody was used, 100 μl standard solution was added in the blank micropores according to the order of the samples, 100 μl samples were added in the blank micropores, and 100 μl distilled water was added in the blank control, and 50 μl enzyme marker solution was added in each hole (the blank control holes were not included); the enzyme label plate was sealed with sealing compound, and incubated for 1 hour at 37˚C. The microtiter plate was washed five times using distilled or de-ionized water, and dried thor- oughly with absorbent paper; 50 μl substrate A & B was added to each well (the blank control holes were not in- cluded) and incubated for 10 minutes in darkness at 20˚C - 25˚C, followed by addition of 50 μl stop solution to each well; The OD value was calculated by an enzyme monitor (Bio-Rad 680, USA) at 450 nm for each set of reference standards and samples; the concentration can be found in the standard curve according to the OD value of the samples, expressed in ng/ml. 2.5. Statistical Analysis SPSS 17.0 statistical software was applied to process statistical analysis, to analyze the contribution of differ- ent levels of ischemia (drug administration) time and dose to the test indicators, as well as the interaction of ischemia time and dose to the test indicators, and comes to the best dose and the combination of the time window according to the results. 3. Results 3.1. Test Results The model animal group had significantly elevated serum NSE (6.773 ± 0.812), S100B (0.762 ± 0.110) and MBP (0.675 ± 0.083) levels compared with the sham control group, in which the serum NSE, S100B and MBP levels were 2.368 ± 0.532, 0.234 ± 0.051 and 0.227 ± 0.042 (t = 2.79 - 5.97,P < 0.05). And the model animal group af- ter treatment had more decreased serum NSE (5.613 ± 1.362), S100B (0.634 ± 0.153) and MBP (0.305 ± 0.099) levels than before (t = 2.33 - 3.91, P < 0.05). Table 2 is an orthogonal experiment of [L16(45)]. Copyright © 2013 SciRes. NM 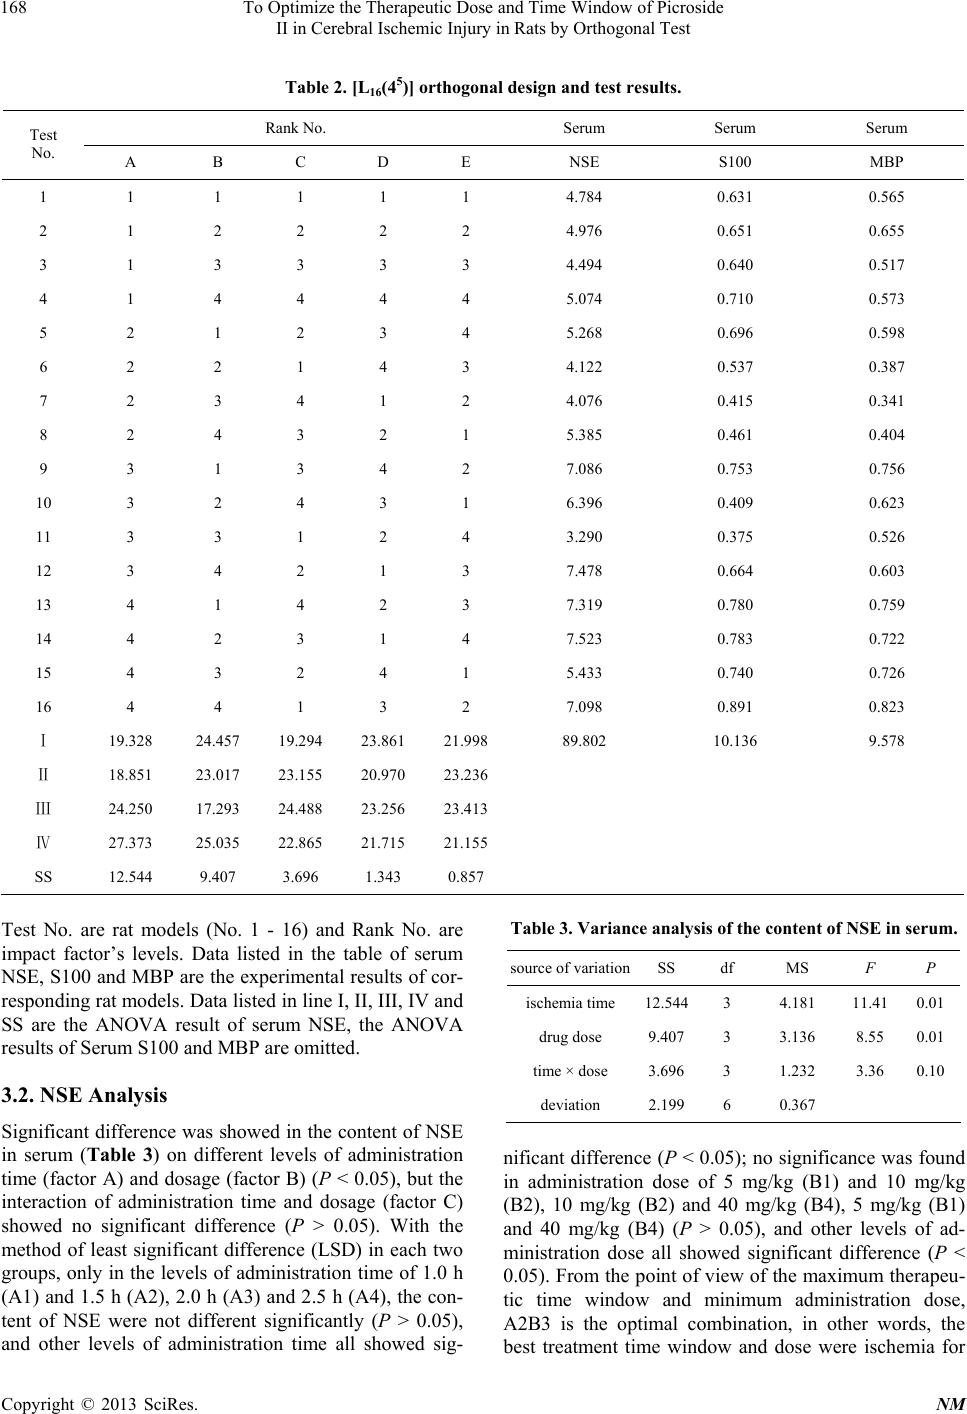 To Optimize the Therapeutic Dose and Time Window of Picroside II in Cerebral Ischemic Injury in Rats by Orthogonal Test Copyright © 2013 SciRes. NM 168 Table 2. [L16(45)] orthogonal design and test results. Rank No. Serum Serum Serum Test No. A B C D E NSE S100 MBP 1 1 1 1 1 1 4.784 0.631 0.565 2 1 2 2 2 2 4.976 0.651 0.655 3 1 3 3 3 3 4.494 0.640 0.517 4 1 4 4 4 4 5.074 0.710 0.573 5 2 1 2 3 4 5.268 0.696 0.598 6 2 2 1 4 3 4.122 0.537 0.387 7 2 3 4 1 2 4.076 0.415 0.341 8 2 4 3 2 1 5.385 0.461 0.404 9 3 1 3 4 2 7.086 0.753 0.756 10 3 2 4 3 1 6.396 0.409 0.623 11 3 3 1 2 4 3.290 0.375 0.526 12 3 4 2 1 3 7.478 0.664 0.603 13 4 1 4 2 3 7.319 0.780 0.759 14 4 2 3 1 4 7.523 0.783 0.722 15 4 3 2 4 1 5.433 0.740 0.726 16 4 4 1 3 2 7.098 0.891 0.823 Ⅰ 19.328 24.457 19.294 23.861 21.998 89.802 10.136 9.578 Ⅱ 18.851 23.017 23.155 20.970 23.236 Ⅲ 24.250 17.293 24.488 23.256 23.413 Ⅳ 27.373 25.035 22.865 21.715 21.155 SS 12.544 9.407 3.696 1.343 0.857 Test No. are rat models (No. 1 - 16) and Rank No. are impact factor’s levels. Data listed in the table of serum NSE, S100 and MBP are the experimental results of cor- responding rat models. Data listed in line I, II, III, IV and SS are the ANOVA result of serum NSE, the ANOVA results of Serum S100 and MBP are omitted. 3.2. NSE Analysis Significant difference was showed in the content of NSE in serum (Table 3) on different levels of administration time (factor A) and dosage (factor B) (P < 0.05), but the interaction of administration time and dosage (factor C) showed no significant difference (P > 0.05). With the method of least significant difference (LSD) in each two groups, only in the levels of administration time of 1.0 h (A1) and 1.5 h (A2), 2.0 h (A3) and 2.5 h (A4), the con- tent of NSE were not different significantly (P > 0.05), and other levels of administration time all showed sig- Table 3. Variance analysis of the content of NSE in serum. source of variation SS df MS F P ischemia time 12.5443 4.181 11.410.01 drug dose 9.4073 3.136 8.55 0.01 time × dose 3.6963 1.232 3.36 0.10 deviation 2.1996 0.367 nificant difference (P < 0.05); no significance was found in administration dose of 5 mg/kg (B1) and 10 mg/kg (B2), 10 mg/kg (B2) and 40 mg/kg (B4), 5 mg/kg (B1) and 40 mg/kg (B4) (P > 0.05), and other levels of ad- ministration dose all showed significant difference (P < 0.05). From the point of view of the maximum therapeu- tic time window and minimum administration dose, A2B3 is the optimal combination, in other words, the best treatment time window and dose were ischemia for 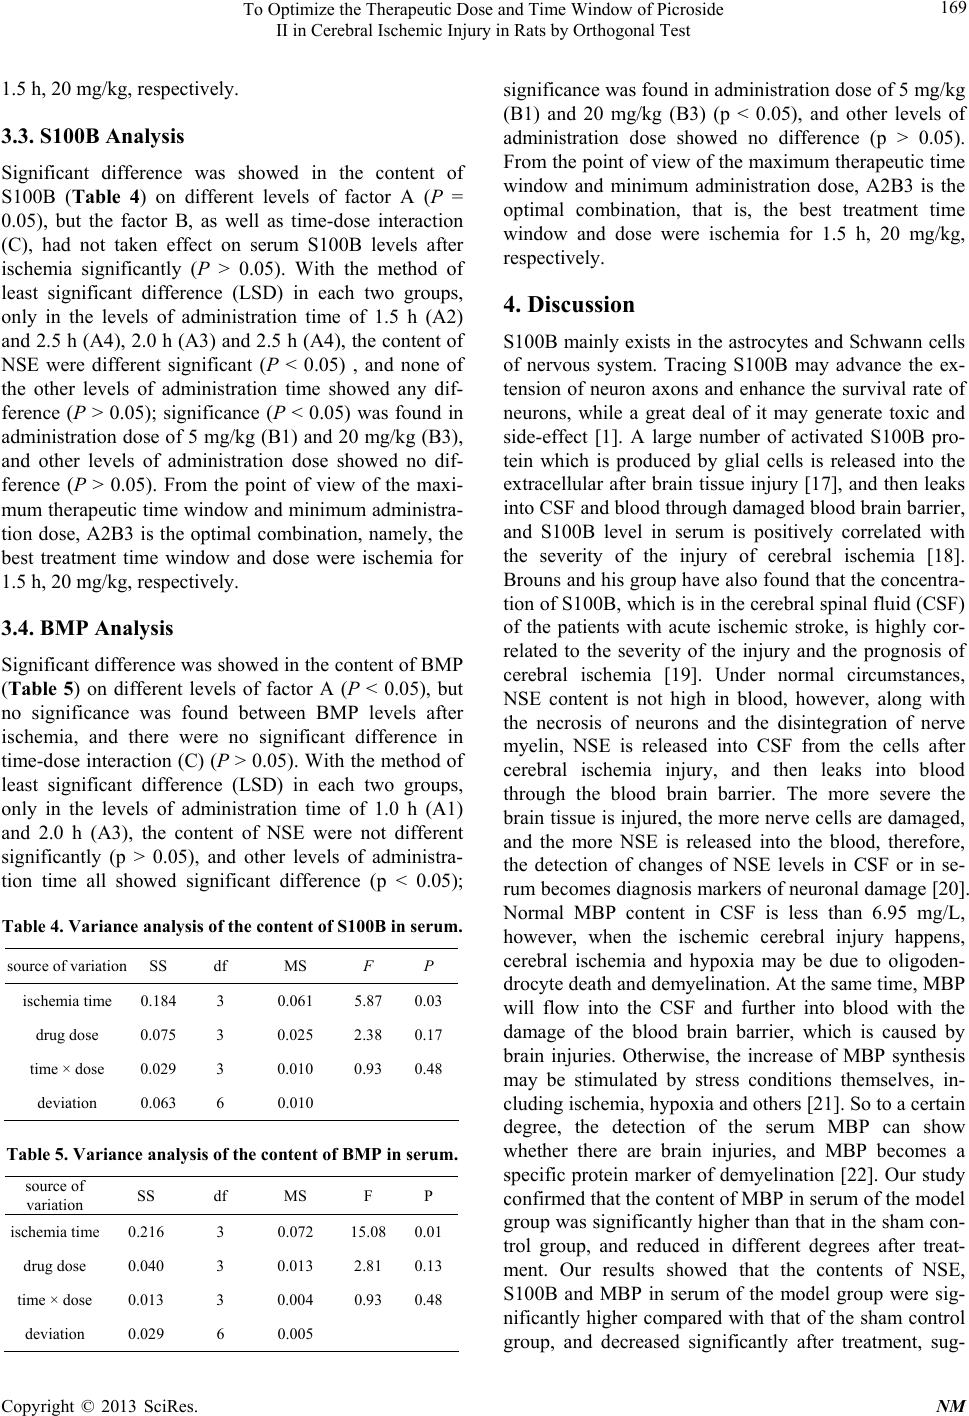 To Optimize the Therapeutic Dose and Time Window of Picroside II in Cerebral Ischemic Injury in Rats by Orthogonal Test 169 1.5 h, 20 mg/kg, respectively. 3.3. S100B Analysis Significant difference was showed in the content of S100B (Table 4) on different levels of factor A (P = 0.05), but the factor B, as well as time-dose interaction (C), had not taken effect on serum S100B levels after ischemia significantly (P > 0.05). With the method of least significant difference (LSD) in each two groups, only in the levels of administration time of 1.5 h (A2) and 2.5 h (A4), 2.0 h (A3) and 2.5 h (A4), the content of NSE were different significant (P < 0.05) , and none of the other levels of administration time showed any dif- ference (P > 0.05); significance (P < 0.05) was found in administration dose of 5 mg/kg (B1) and 20 mg/kg (B3), and other levels of administration dose showed no dif- ference (P > 0.05). From the point of view of the maxi- mum therapeutic time window and minimum administra- tion dose, A2B3 is the optimal combination, namely, the best treatment time window and dose were ischemia for 1.5 h, 20 mg/kg, respectively. 3.4. BMP Analysis Significant difference was showed in the content of BMP (Table 5) on different levels of factor A (P < 0.05), but no significance was found between BMP levels after ischemia, and there were no significant difference in time-dose interaction (C) (P > 0.05). With the method of least significant difference (LSD) in each two groups, only in the levels of administration time of 1.0 h (A1) and 2.0 h (A3), the content of NSE were not different significantly (p > 0.05), and other levels of administra- tion time all showed significant difference (p < 0.05); Table 4. Variance analysis of the content of S100B in serum. source of variation SS df MS F P ischemia time 0.184 3 0.061 5.87 0.03 drug dose 0.075 3 0.025 2.38 0.17 time × dose 0.029 3 0.010 0.93 0.48 deviation 0.063 6 0.010 Table 5. Variance analysis of the content of BMP in serum. source of variation SS df MS F P ischemia time 0.216 3 0.072 15.080.01 drug dose 0.040 3 0.013 2.81 0.13 time × dose 0.013 3 0.004 0.93 0.48 deviation 0.029 6 0.005 significance was found in administration dose of 5 mg/kg (B1) and 20 mg/kg (B3) (p < 0.05), and other levels of administration dose showed no difference (p > 0.05). From the point of view of the maximum therapeutic time window and minimum administration dose, A2B3 is the optimal combination, that is, the best treatment time window and dose were ischemia for 1.5 h, 20 mg/kg, respectively. 4. Discussion S100B mainly exists in the astrocytes and Schwann cells of nervous system. Tracing S100B may advance the ex- tension of neuron axons and enhance the survival rate of neurons, while a great deal of it may generate toxic and side-effect [1]. A large number of activated S100B pro- tein which is produced by glial cells is released into the extracellular after brain tissue injury [17], and then leaks into CSF and blood through damaged blood brain barrier, and S100B level in serum is positively correlated with the severity of the injury of cerebral ischemia [18]. Brouns and his group have also found that the concentra- tion of S100B, which is in the cerebral spinal fluid (CSF) of the patients with acute ischemic stroke, is highly cor- related to the severity of the injury and the prognosis of cerebral ischemia [19]. Under normal circumstances, NSE content is not high in blood, however, along with the necrosis of neurons and the disintegration of nerve myelin, NSE is released into CSF from the cells after cerebral ischemia injury, and then leaks into blood through the blood brain barrier. The more severe the brain tissue is injured, the more nerve cells are damaged, and the more NSE is released into the blood, therefore, the detection of changes of NSE levels in CSF or in se- rum becomes diagnosis markers of neuronal damage [20]. Normal MBP content in CSF is less than 6.95 mg/L, however, when the ischemic cerebral injury happens, cerebral ischemia and hypoxia may be due to oligoden- drocyte death and demyelination. At the same time, MBP will flow into the CSF and further into blood with the damage of the blood brain barrier, which is caused by brain injuries. Otherwise, the increase of MBP synthesis may be stimulated by stress conditions themselves, in- cluding ischemia, hypoxia and others [21]. So to a certain degree, the detection of the serum MBP can show whether there are brain injuries, and MBP becomes a specific protein marker of demyelination [22]. Our study confirmed that the content of MBP in serum of the model group was significantly higher than that in the sham con- trol group, and reduced in different degrees after treat- ment. Our results showed that the contents of NSE, S100B and MBP in serum of the model group were sig- nificantly higher compared with that of the sham control group, and decreased significantly after treatment, sug- Copyright © 2013 SciRes. NM  To Optimize the Therapeutic Dose and Time Window of Picroside II in Cerebral Ischemic Injury in Rats by Orthogonal Test 170 gesting a protective role of picroside II on both ische- mic brain tissue and blood brain barrier. This experiment was a [L16(45)] orthogonal experi- ment design, in which four time points of 1 h, 1.5 h, 2 h and 2.5 h after brain ischemia were set and four levels of picroside II dose were given (5 mg/kg, 10 mg/kg, 20 mg/kg and 40 mg/kg). The expressions of NSE, S100B and MBP in serum were measured, and the optimal therapeu- tic dosage and time window of picroside II were analysed. These results showed that there was a significant differ- ence for the therapeutic effects of picroside II in admini- stration time and the dose. From the principle of the low- est therapeutic dose with the longest time window, A2B3 was the optimal combination and the best treatment time window and dose were ischemia for 1.5 h and intraperi- toneal injection of 20 mg/kg. For the mechanism of cere- bral ischemic injury was very complicated, only four indexes, as mentioned here, were observed in this study, which must bring some variances. Therefore, the exact mechanism and optimal therapeutic time window and dosage of picroside II should be evaluated combined with other detection indexes. 5. Acknowledgements This study was supported by grant-in-aids for The Na- tional Natural Science Foundation of China (No. 8104 1092, 81274116). REFERENCES [1] J. Joseph, F. F. Cruz-Sánchez and J. Carreras, “Enolase Activity and Isoenzyme Distribution in Human Brain Re- gions and Tumors,” Journal of Neurochemistry, Vol. 66, No. 6, 1996, pp. 2484-2490. doi:10.1046/j.1471-4159.1996.66062484.x [2] V. Selakovic, R. Raicevic and L. Radenovic, “The In- crease of Neuron-Specific Enolase in Cerebrospinal Fluid and Plasma as a Marker of Neuronal Damage in Patients with Acute Brain Infarction,” Journal of Clinical Neuro- science, Vol. 12, No. 5, 2005, pp. 542-547. doi:10.1016/j.jocn.2004.07.019 [3] R. H. Hatfield and R. M. McKernan, “CSF Neuron-Spe- cific Enolase as a Quantitative Marker of Neuronal Dam- age in a Rat Stroke Model,” Brain Research, Vol. 557, No. 2, 1992, pp. 249-252. doi:10.1016/0006-8993(92)90280-M [4] T. X. Niu, Z. Y. Shi, J. J. Luo and X. D. Meng, “Determi- nation and Clinical Significance of NSE and S-100β Pro- tein in Hypoxia-Ischemia Brain Injured Rats (in Chinese),” Chinese Journal of Comprehensive Medical, Vol. 19, 2009, pp. 34-37. [5] E. C. Jauch, C. Lindsell, J. Broderick, S. C. Fagan, B. C. Tilley, S. R. Levine and NINDS rt-PA Stroke Study Group, “Association of Serial Biochemical Markers with Acute Ischemic Stroke: The National Institute of Neuro- logical Disorders and Stroke Recombinant Tissue Plasmi- nogen Activator Stroke Study,” Stroke, Vol. 37, 2006, pp. 2508-2513. doi:10.1161/01.STR.0000242290.01174.9e [6] T. Yardan, A. K. Erenler, A. Baydin, K. Aydin and C. Cokluk, “Usefulness of S100B Protein in Neurological Disorders,” Journal of Pakistan Medical Association, Vol. 61, 2011, pp. 276-281. [7] M. Üstündağ, M. Orak, C. Güloğlu, Y. Tamam, M. B. Sayhan and E. Kale, “The Role of Serum Osteoprotegerin and S-100 Protein Levels in Patients with Acute Ischae- mic Stroke: Determination of Stroke Subtype, Severity and Mortality,” Severity and Mortality, Vol. 39, 2011, pp. 780-789. [8] R. Kazmierski, S. Michalak, A. Wencel-Warot and W. L. Nowinski, “Serum Tight-Junction Proteins Predict Hem- orrhagic Transformation in Ischemic Stroke Patients,” Neu- rology, Vol. 79, 2012, pp. 1677- 1685. doi:10.1212/WNL.0b013e31826e9a83 [9] M. T. Wunderlich, C. W. Wallesch and M. Goertler, “Re- lease of Neurobiochemical Markers of Brain Damage Is Related to the Neurovascular Status on Admission and the Site of Arterial Occlusion in Acute Ischemic Stroke,” Journal of the Neurological Sciences, Vol. 227, No. 1, 2004, pp. 49-53. doi:10.1016/j.jns.2004.08.005 [10] K. J. Lamers, P. Vos, M. M. Verbeek, F. Rosmalen, W. J. van Geel and B. G. van Engelen, “Protein S-100B, Neu- ron-Specific Enolase (NSE), Myelin Basic Protein (MBP) and Glial Fibrillary Acidic Protein (GFAP) in Cerebro- spinal Fluid (CSF) and Blood of Neurological Patients,” Brain Research Bulletin, Vol. 61, No. 3, 2003, pp. 261- 264. doi:10.1016/S0361-9230(03)00089-3 [11] Y. Z. Chen, Q. Yi, G. Liu, X. Shen, L. H. Xuan and Y. Tian, “Cerebral White Matter Injury and Damage to Mye- lin Sheath Following Whole-Brain Ischemia,” Brain Re- search, Vol. 1495, 2013, pp. 11-17. doi:10.1016/j.brainres.2012.12.006 [12] Z. Li, Q. Li, W. Shen and Y. L. Guo, “The Interferring Effects of Picroside II on the Expressions of NF-κB and I-κB Following Cerebral Ischemia Reperfusion Injury in Rats,” Chinese Pharmacological Bulletin, Vol. 26, 2010, pp. 52-55. [13] Z. Li, Q. Li, Y. L. Guo, L. H. Qin and L. J. Luan, “Inter- vention Effects of PicrosideⅡ in Cerebral Ischemic In- jury Rats,” Acta Anat Sinica, Vol. 41, 2010, pp. 9-12. [14] Y. L. Guo, X. Y. Xu, Q. Li, Z. Li and F. Du, “Anti-In- flammation Effects of PicrosideⅡ in Cerebral Ischemic Injury Rats,” Behavioral Brain Function, Vol. 6, 2010, pp. 43-53. [15] H. T. Pei, X. Su, L. Zhao, H. Y. Li, Y. L. Guo, M. Z. Zhang and H. Xin, “Primary Study for the Therapeutic Dose and Time Window of PicrosideⅡ in Treating Cere- bral Ischemic Injury in Rats,” International Journal of Molecular Sciences, Vol. 13, 2012, pp. 2551-2562. [16] A. Márquez-Martín, F. Jiménez-Altayó, A. P. Dantas, L. Caracuel, A. M. Planas and E. Vila, “Middle Cerebral Ar- tery Alterations in a Rat Chronic Hypoperfusion Model,” Journal of Applied Physiology, Vol. 112, 2012, pp. 511- 518. doi:10.1152/japplphysiol.00998.2011 Copyright © 2013 SciRes. NM  To Optimize the Therapeutic Dose and Time Window of Picroside II in Cerebral Ischemic Injury in Rats by Orthogonal Test Copyright © 2013 SciRes. NM 171 [17] R. Gerlach, G. Demel, H. G. König, U. Gross, J. H. Prehn, A. Raabe, V. Seifert and D. Kögel, “Active Secretion of S100B from Astrocytes during Metabolic Stress,” Neuro- science, Vol. 141, No. 4, 2006, pp. 1697-1701. doi:10.1016/j.neuroscience.2006.05.008 [18] D. T. Laskowitz, S. E. Kasner, J. Saver, K. S. Remmel and E. C. Jauch, “Clinical Usefulness of a Biomarker- Based Diagnostic Test for Acute Stroke: The Biomarker Rapid Assessment in Ischemic Injury (BRAIN) Study,” Stroke, Vol. 40, 2009, pp. 77-85. doi:10.1161/STROKEAHA.108.516377 [19] R. Brouns, B. De Vil, P. Cras, D. De Surgeloose, P. Ma- riën and P. P. De Deyn, “Neurobiochemical Markers of Brain Damage in Cerebrospinal Fluid of Acute Ischemic Stroke Patients,” Clinical Chemistry, Vol. 56, No. 3, 2010, pp. 451-458. doi:10.1373/clinchem.2009.134122 [20] M. T. Wunderlich, H. Lins, M. Skalej, C. W. Wallesch and M. Goertler, “Neuron-Specific Enolase and Tau Pro- tein as Neurobiochemical Markers of Neuronal Damage Are Related to Early Clinical Course and Long-Term Outcome in Acute Ischemic Stroke,” Clinical Neurology and Neurosurgery, Vol. 108, No. 6, 2006, pp. 558-563. doi:10.1016/j.clineuro.2005.12.006 [21] R. Gregersen, T. Christensen, E. Lehrmann, N. H. Diemer and B. Finsen, “Focal Cerebral Ischemia Induces In- creased Myelin Basic Protein and Growth-Associated Protein-43 Gene Transcription in Peri-Infarct Areas in the Rat Brain,” Experimental Brain Research, Vol. 138, No. 3, 2001, pp. 384-392. doi:10.1007/s002210100715 [22] T. Strand, C. Alling, B. Karlsson, I. Karlsson and B. Win- blad, “Brain and Plasma Proteins in Spinal Fluid as Mark- ers for Brain Damage and Severity of Stroke,” Stroke, Vol. 15, 1984, pp. 138-144. doi:10.1161/01.STR.15.1.138 |