

Paper Menu >>
Journal Menu >>
 Modern Economy, 2013, 4, 627-632 http://dx.doi.org/10.4236/me.2013.49067 Published Online September 2013 (http://www.scirp.org/journal/me) Estimating the New Keynesıan Phillips Curve by Quantile Regression Method for Turkey Çiğdem Boz Department of Economics, Maltepe University, Maltepe, Turkey Email: [email protected] Received July 25, 2013; revised August 25, 2013; accepted September 4, 2013 Copyright © 2013 Çiğdem Boz. This is an open access article distributed under the Creative Commons Attribution License, which permits unrestricted use, distribution, and reproduction in any medium, provided the original work is properly cited. ABSTRACT New Keynesian Phillips Curve based on nominal rigidities and rational expectations is a widely used structural model of inflation dynamics in the analysis of monetary policy. It postulates that current inflation is determined by expected inflation and by the real marginal costs. This study uses the Quantile Regression Method (QRM) to present the New Keynesian Phillips Curve (NKPC) estimation for Turkey instead of Generalized Method of Momentum (GMM). This method identifies differences in response of the inflation to changes in explanatory variables at various points of in- flation. Keywords: Quantile Regression; New Keynesian Phillips Curve; Turkish Economy 1. Introduction The New Keynesian Phillips Curve (NKPC) which is based on nominal rigidities and rational expectations is a widely used structural model of inflation dynamics in the analysis of monetary policy. It postulates that current inflation is determined by expected inflation and by the real marginal costs as the driving variable. Despite it has a commonly accepted theoretical background, there have been controversial results regarding its empirical valid- ity1. In the literature, the Generalized Method of Mo- mentum (GMM) has been extensively used to estimate NKPC in order to avoid endogeneity bias caused by ex- pected inflation, since it is likely to produce imprecise and biased estimates2. One of the GMM assumptions specifies that the coefficients are evaluated when the level of inflation is at the mean of the distribution condi- tional on its explanatory variables. In this paper, we would like to contravene this assumption and examine the response of the inflation rate through different quan- tiles of its distribution. Turkish economy has experienced high inflation peri- ods especially before the adoption of Inflation Targeting (IT) regime in 2002, later on the inflation rate gradually decreased. Although the inflation rate is relatively low and stable in comparison to the past, they range from 29.7% to 6.2% between 2002 and 2012. This trend leads us to think over that the marginal effects of explanatory variables on the inflation rate across its distribution could be different. In order to analyze these effects at various points of the inflation rate, we estimate the hybrid ver- sion of the NKPC employing Quantile Regression (QR) that takes into account endogeneity issues. Findings from our estimations show that the marginal effects of ex- planatory variables on the inflation rate through its dis- tribution are varying. When the inflation rate is low, the backward looking term is significant, notwithstanding forward looking term is insignificant. But when the infla- tion rate is high, the significance of forward looking term dominates the backward looking term. In addition, the significance of output gap and exchange rates increases for high inflation. It reflects that the inflation rate is rela- tively more driven by lagged inflation when the inflation rate is low, but on the contrary, it is relatively more dri- ven by the policy rate and forming of economic agents’ inflation expectations when the inflation rate is high. 1Gali and Gertler (1999) and Gali, Gertler and Lopez Solido (2001) find that the pure NKPC where inflation is a function of expected future inflation and real marginal costs, is good approximation of inflation dynamics in both the US and Europe. However, Roberts (2001) p rovides evidence against the NKPC with only forward looking elements using GMM, although in contrast to Fuhrer (1997) he finds there to be clear role for forward looking behavior. 2As a solution for this problem, Linde suggests FIML but this method has not been used extensively. The following section provides the overview of the literature on the NKPC. Emprical analyses and findings are described in the third section. The final section con- C opyright © 2013 SciRes. ME  Ç. BOZ 628 Copyright © 2013 SciRes. ME cludes the paper. 2. Evolution of the Phillips Curve and Literature on NKPC The relationship between inflation and real variables is very important for understanding the effects of monetary policy. The Phillips curve, one of the most famous rela- tionships in macroeconomics, is concerned with this is- sue. In 1958, A. W. Phillips’s work demonstrated that lower unemployment leads to higher wages. Following the influential contribution from Samuelson and Solow, the Phillips Curve was interpreted by many orthodox Keynesians as implying a stable long-run trade-off which offered the authorities a menu of possible inflation-un- employment combinations for policy choice [1]. The idea of a stable trade-off between inflation and output was challenged independently by Milton Friedman and Ed- mund Phelps who both denied the existence of a perma- nent (long-run) trade-off between inflation and unem- ployment. In other words, expectations augmented PC was vertical at the natural rate of employment. However by the late 1960s and early 1970s, both infla- tion and unemployment had begun to increasing, and this phenomenon named as stagflation, discredited Friedman and Phelp’s view. The economists of New Classical School which is the dominant paradigm in 1970s, went further and claimed that fiscal or monetary policies could have no impact on output or employment in short-run and either long-run as a consequence of rational expecta- tions together with instantaneous market clearing as- sumptions. Yet, this policy ineffectiveness proposition conflicted with the empirical evidence on the efficiacy of monetary policies on real variables. As a reaction to this proposition, in 1990s, New Keynesian models based on prices and wages rigidities and rational expectations have been widely acknowl- edged. In order to explain the effects of nominal vari- ables on real variables, New Keynesian Phillips Curve (NKPC) which is based on Taylor [2], Rotemberg [3] and Calvo [4], was suggested. According to the NKPC, current inflation is expressed as a function of expected future inflation and real marginal costs. The prior theo- ries concerning inflation dynamics, neoclassical Phillips Curve, assume flexible prices and rational expectations in a microfounded framework. But the predictions of this model conflicted with the realities; data about the real effects of money are much stronger than what this model implies. To be able to explain the stronger nominal ef- fects on real variables the NKPC stressed the role of staggered wage and price setting of forward looking in- dividuals and firms by the use of microfoundations with optimizing rational agents [5]. In other words, since the empirical results of VAR analysis implies that the changes in nominal variables have persistent effects on real variables, a new consensus emerged about the use of the NKPC for theoretical analysis of monetary policy in the past decade. While theoretically appealing, empirical evidence on the NKPC is far from decisive. There are a number of studies which provide evidence in favor of the NKPC, while the others provide against it. Gali and Gertler [6] and Gali et al. [7] examine the NKPC for the US econ- omy find that expected inflation is almost always impor- tant in determining current inflation. Gali et al. [8] have similar results for the euro area. Sbordone [9] and Amato and Gerlach [10] also suggest that the baseline for-ward- looking NKPC provides a reasonably good description of US and European inflation dynamics. Nevertheless, there are studies which emphasize that forward-looking specifications are not sufficient to cap- ture inflation persistence (Fuhrer and Moore [11], Rob- erts [12] and Roberts [13], Rudd and Whelan [14,15] and Stock Watson [16]). Ball [17] demonstrates that the model yields the surprising result that announced, credi- ble disinflations lead booms rather than recessions. Fuh- rer and Moore [11] argue that it cannot explain why in- flation is so persistent. Mankiw [18] emphasizes that it cannot explain why shocks to monetary policy have a delayed and gradual effect on inflation. According to him, these problems may arise from the same source; “al- though the price level is sticky in this model, the inflation rate can change quickly”. In other words, in the NKPC, price stickiness is not translated into inflation stickiness, hence the inflation level can be changed instantaneously in sharp contrast with empirical patterns. As a consequence, Gali and Gertler [6] extended Calvo’s theoretical framework to the so-called hybrid NKPC (HNKPC) by allowing for a fraction of firms that set prices according to a backward looking rule-of thumb. The work of Gali and Gertler made an important contri- bution to reconciling the NKPC with the data. The hybrid formulation was able to generate more inflation persis- tence than the usual NKPC. However, empirical estimates of the hybrid model also have yielded conflicting results and interpretations. On one hand, Fuhrer [19] finds the forward-looking compo- nent in inflation to be essentially unimportant. Roberts [13] compares several PC specifications and obtains a large backward-looking component on US data. Estrella and Fuhrer [20] also document the poor fit of a purely forward-looking PC. Jondeau and Le Bihan [21] estimate hybrid model for major euro countries and US using both GMM and ML estimation procedures. They found that forward-lookingness of the inflation dynamics is not al- tered by the choice of the forcing variable. In contrast, it is strongly affected by the lag and lead structure of infla- 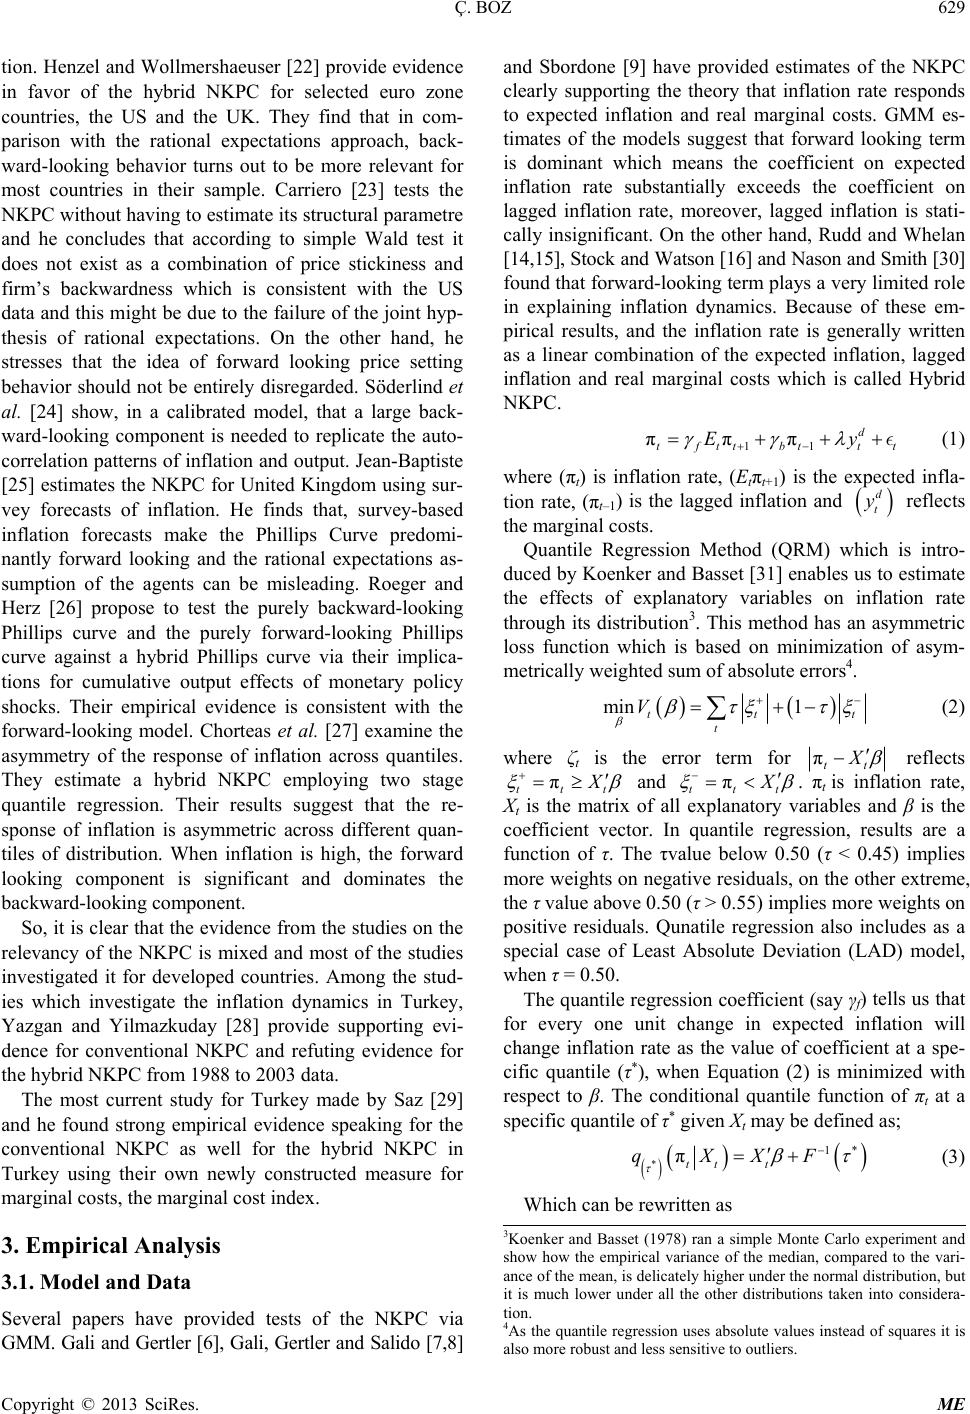 Ç. BOZ 629 Copyright © 2013 SciRes. ME t tion. Henzel and Wollmershaeuser [22] provide evidence in favor of the hybrid NKPC for selected euro zone countries, the US and the UK. They find that in com- parison with the rational expectations approach, back- ward-looking behavior turns out to be more relevant for most countries in their sample. Carriero [23] tests the NKPC without having to estimate its structural parametre and he concludes that according to simple Wald test it does not exist as a combination of price stickiness and firm’s backwardness which is consistent with the US data and this might be due to the failure of the joint hyp- thesis of rational expectations. On the other hand, he stresses that the idea of forward looking price setting behavior should not be entirely disregarded. Söderlind et al. [24] show, in a calibrated model, that a large back- ward-looking component is needed to replicate the auto- correlation patterns of inflation and output. Jean-Baptiste [25] estimates the NKPC for United Kingdom using sur- vey forecasts of inflation. He finds that, survey-based inflation forecasts make the Phillips Curve predomi- nantly forward looking and the rational expectations as- sumption of the agents can be misleading. Roeger and Herz [26] propose to test the purely backward-looking Phillips curve and the purely forward-looking Phillips curve against a hybrid Phillips curve via their implica- tions for cumulative output effects of monetary policy shocks. Their empirical evidence is consistent with the forward-looking model. Chorteas et al. [27] examine the asymmetry of the response of inflation across quantiles. They estimate a hybrid NKPC employing two stage quantile regression. Their results suggest that the re- sponse of inflation is asymmetric across different quan- tiles of distribution. When inflation is high, the forward looking component is significant and dominates the backward-looking component. So, it is clear that the evidence from the studies on the relevancy of the NKPC is mixed and most of the studies investigated it for developed countries. Among the stud- ies which investigate the inflation dynamics in Turkey, Yazgan and Yilmazkuday [28] provide supporting evi- dence for conventional NKPC and refuting evidence for the hybrid NKPC from 1988 to 2003 data. The most current study for Turkey made by Saz [29] and he found strong empirical evidence speaking for the conventional NKPC as well for the hybrid NKPC in Turkey using their own newly constructed measure for marginal costs, the marginal cost index. 3. Empirical Analysis 3.1. Model and Data Several papers have provided tests of the NKPC via GMM. Gali and Gertler [6], Gali, Gertler and Salido [7,8] and Sbordone [9] have provided estimates of the NKPC clearly supporting the theory that inflation rate responds to expected inflation and real marginal costs. GMM es- timates of the models suggest that forward looking term is dominant which means the coefficient on expected inflation rate substantially exceeds the coefficient on lagged inflation rate, moreover, lagged inflation is stati- cally insignificant. On the other hand, Rudd and Whelan [14,15], Stock and Watson [16] and Nason and Smith [30] found that forward-looking term plays a very limited role in explaining inflation dynamics. Because of these em- pirical results, and the inflation rate is generally written as a linear combination of the expected inflation, lagged inflation and real marginal costs which is called Hybrid NKPC. 11 πππ d tftt btt Ey (1) where (πt) is inflation rate, (Etπt+1) is the expected infla- tion rate, (πt‒1) is the lagged inflation and reflects the marginal costs. d t y Quantile Regression Method (QRM) which is intro- duced by Koenker and Basset [31] enables us to estimate the effects of explanatory variables on inflation rate through its distribution3. This method has an asymmetric loss function which is based on minimization of asym- metrically weighted sum of absolute errors4. min 1 tt t V t (2) where ζt is the error term for πtt X reflects π ttt X and π ttt X . πt is inflation rate, Xt is the matrix of all explanatory variables and β is the coefficient vector. In quantile regression, results are a function of τ. The τvalue below 0.50 (τ < 0.45) implies more weights on negative residuals, on the other extreme, the τ value above 0.50 (τ > 0.55) implies more weights on positive residuals. Qunatile regression also includes as a special case of Least Absolute Deviation (LAD) model, when τ = 0.50. The quantile regression coefficient (say γf) tells us that for every one unit change in expected inflation will change inflation rate as the value of coefficient at a spe- cific quantile (τ), when Equation (2) is minimized with respect to β. The conditional quantile function of πt at a specific quantile of τ given Xt may be defined as; * 1* πtt t qXXF (3) Which can be rewritten as 3Koenker and Basset (1978) ran a simple Monte Carlo experiment and show how the empirical variance of the median, compared to the vari- ance of the mean, is delicately higher under the normal distribution, but it is much lower under all the other distributions taken into considera- tion. 4As the quantile regression uses absolute values instead of squares it is also more robust and less sensitive to outliers. 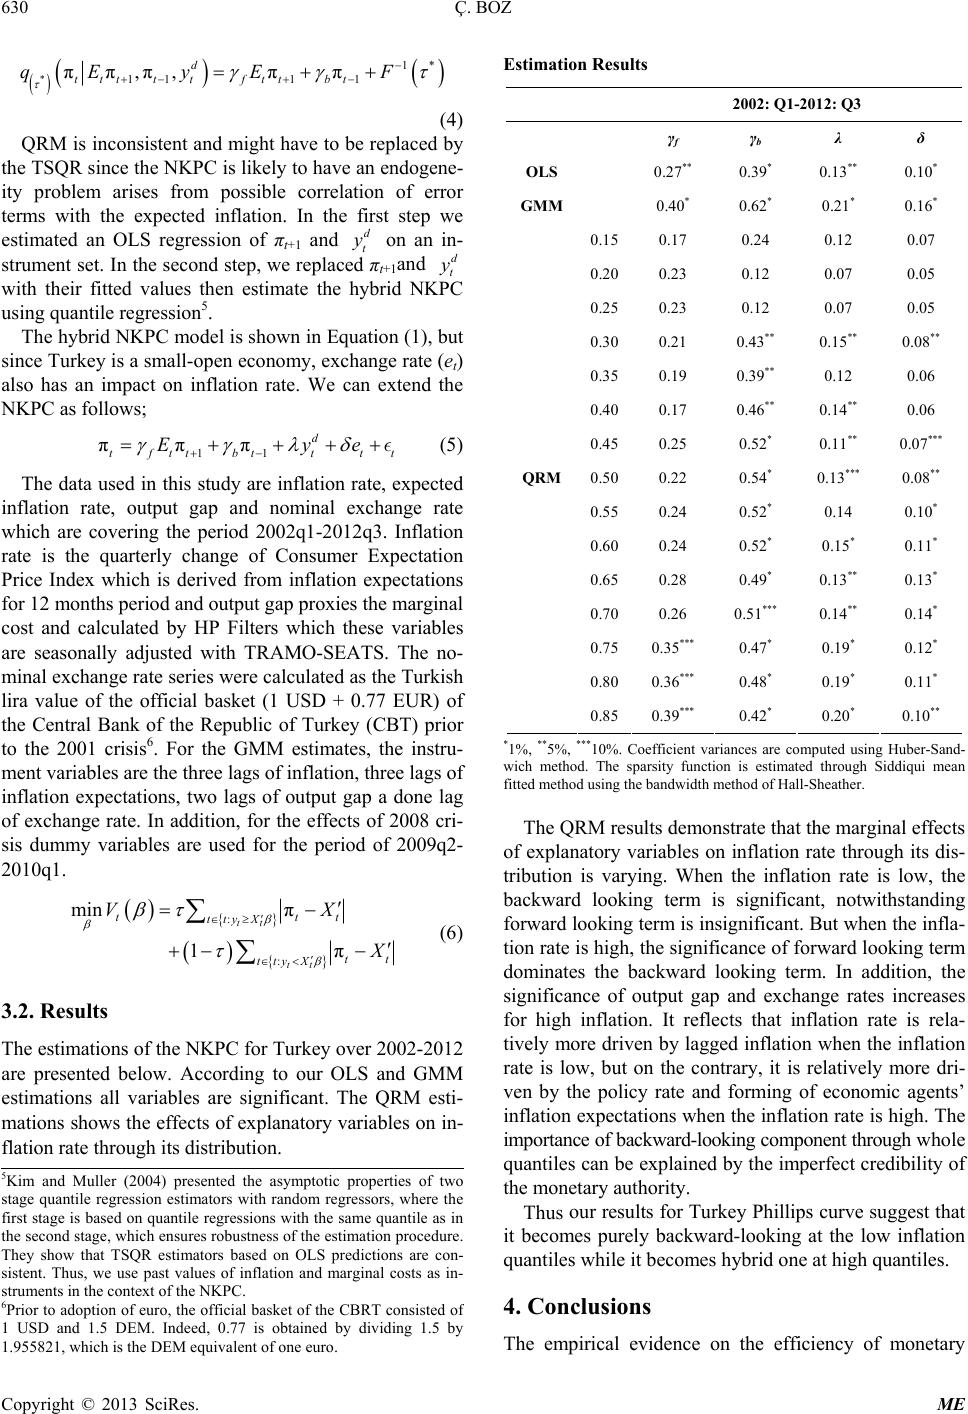 Ç. BOZ 630 * 1* 111 1 ππ,π,ππ d tttt tfttbt qE yEF (4) QRM is inconsistent and might have to be replaced by the TSQR since the NKPC is likely to have an endogene- ity problem arises from possible correlation of error terms with the expected inflation. In the first step we estimated an OLS regression of πt+1 and d t y on an in- strument set. In the second step, we replaced πt+1and d t y with their fitted values then estimate the hybrid NKPC using quantile regression5. The hybrid NKPC model is shown in Equation (1), but since Turkey is a small-open economy, exchange rate (et) also has an impact on inflation rate. We can extend the NKPC as follows; 11 πππ d tfttbttt Ey Copyright © 2013 SciRes. ME t e (5) The data used in this study are inflation rate, expected inflation rate, output gap and nominal exchange rate which are covering the period 2002q1-2012q3. Inflation rate is the quarterly change of Consumer Expectation Price Index which is derived from inflation expectations for 12 months period and output gap proxies the marginal cost and calculated by HP Filters which these variables are seasonally adjusted with TRAMO-SEATS. The no- minal exchange rate series were calculated as the Turkish lira value of the official basket (1 USD + 0.77 EUR) of the Central Bank of the Republic of Turkey (CBT) prior to the 2001 crisis6. For the GMM estimates, the instru- ment variables are the three lags of inflation, three lags of inflation expectations, two lags of output gap a done lag of exchange rate. In addition, for the effects of 2008 cri- sis dummy variables are used for the period of 2009q2- 2010q1. : : min π 1π tt tt tt ttyX t tt ttyX VX X (6) 3.2. Results The estimations of the NKPC for Turkey over 2002-2012 are presented below. According to our OLS and GMM estimations all variables are significant. The QRM esti- mations shows the effects of explanatory variables on in- flation rate through its distribution. Estimation Results 2002: Q1-2012: Q3 γf γb λ δ OLS 0.27** 0.39* 0.13** 0.10* GMM 0.40* 0.62* 0.21* 0.16* 0.150.17 0.24 0.12 0.07 0.200.23 0.12 0.07 0.05 0.250.23 0.12 0.07 0.05 0.300.21 0.43** 0.15** 0.08** 0.350.19 0.39** 0.12 0.06 0.400.17 0.46** 0.14** 0.06 0.450.25 0.52* 0.11** 0.07*** 0.500.22 0.54* 0.13*** 0.08** 0.550.24 0.52* 0.14 0.10* 0.600.24 0.52* 0.15* 0.11* 0.650.28 0.49* 0.13** 0.13* 0.700.26 0.51*** 0.14** 0.14* 0.75 0.35*** 0.47* 0.19* 0.12* 0.80 0.36*** 0.48* 0.19* 0.11* QRM 0.85 0.39*** 0.42* 0.20* 0.10** *1%, **5%, ***10%. Coefficient variances are computed using Huber-Sand- wich method. The sparsity function is estimated through Siddiqui mean fitted method using the bandwidth method of Hall-Sheather. The QRM results demonstrate that the marginal effects of explanatory variables on inflation rate through its dis- tribution is varying. When the inflation rate is low, the backward looking term is significant, notwithstanding forward looking term is insignificant. But when the infla- tion rate is high, the significance of forward looking term dominates the backward looking term. In addition, the significance of output gap and exchange rates increases for high inflation. It reflects that inflation rate is rela- tively more driven by lagged inflation when the inflation rate is low, but on the contrary, it is relatively more dri- ven by the policy rate and forming of economic agents’ inflation expectations when the inflation rate is high. The importance of backward-looking component through whole quantiles can be explained by the imperfect credibility of the monetary authority. 5Kim and Muller (2004) presented the asymptotic properties of two stage quantile regression estimators with random regressors, where the first stage is based on quantile regressions with the same quantile as in the second stage, which ensures robustness of the estimation procedure. They show that TSQR estimators based on OLS predictions are con- sistent. Thus, we use past values of inflation and marginal costs as in- struments in the context of the NKPC. 6Prior to adoption of euro, the official basket of the CBRT consisted o f 1 USD and 1.5 DEM. Indeed, 0.77 is obtained by dividing 1.5 b y 1.955821, which is the DEM equivalent of one euro. Thus our results for Turkey Phillips curve suggest that it becomes purely backward-looking at the low inflation quantiles while it becomes hybrid one at high quantiles. 4. Conclusions The empirical evidence on the efficiency of monetary  Ç. BOZ 631 Copyright © 2013 SciRes. ME policies on real variables discredited the policy ineffec- tiveness proposition of New Classical paradigm and New Keynesian models based on nominal rigidities have been widely acknowledged in 1990s. New Keynesian Phillips Curve which presents a model of inflation dynamics, postulates that current inflation is determined by ex- pected inflation (forward-looking behavior) and the real marginal costs. By the contributions of Gali and Getrler [6] a hybrid NKPC which includes backward component is suggested. Despite it has a commonly accepted theoretical back- ground, the evidence from the studies on the relevancy of the NKPC is mixed. While some studies provide the evi- dence supporting the NKPC, there are also studies which have evidence against it. In this paper, the Quantile Regression Method (QRM) is used to estimate the New Keynesian Phillips Curve (NKPC) for Turkey. By this method, it is aimed that to identify differences in response of the inflation to changes in explanatory variables at various points of in- flation. For the period of 2002q1-2012q3, we find that the backward-looking component appears to be the sig- nificant variable at all inflation quantiles and it is espe- cially influential at low levels. In other words, Phillips curve is purely backward-looking at these quantiles. One explanation for this might be the imperfect credibility of the monetary authority. Impact of the forward-looking inflation terms becomes more significant when the infla- tion increases and it dominates the backward-looking term at high inflation quantiles. In addition, the signifi- cance of output gap (marginal cost) and exchange rates increases for high inflation. These findings support the hybrid New Keynesian Phillips curve for Turkish econ- omy over 2002-2012. REFERENCES [1] B. Snowdon and H. Vane, “Modern Macroeconomics; Its Origins, Development and Current State,” 2005. [2] J. Taylor, “Aggregate Dynamics and Staggered Con- tracts,” The Journal Of Political Economy, Vol. 88, No. 1, 1980, pp. 1-23. doi:10.1086/260845 [3] J. J. Rotemberg, “Monopolisitic Price Adjustment and Aggregate Out-Put,” Review of Economic Studies, Vol. 49, 1982, pp. 517-531. doi:10.2307/2297284 [4] G. Calvo, “Staggered Prices in a Utility Maximizing Fra- mework,” Journal of Monetary Ecoomics, Vol. 12, No. 3, 1983, pp. 383-398. doi:10.1016/0304-3932(83)90060-0 [5] R. Nunes, “Inflation Dynamics: The Role of Expecta- tions,” Journal of Money, Credit and Banking, Vol. 42, No. 6, 2010, pp. 1161-1172. doi:10.1111/j.1538-4616.2010.00324.x [6] J. Gali and M. Gertler, “Inflation Dynamics: A Structural Econometric Analysis,” Journal of Monetary Economics, Vol. 44, No. 2, 1999, pp. 195-222. doi:10.1016/S0304-3932(99)00023-9 [7] J. Gali, M. Gertler, et al., “European Inflation Dynamics,” Journal of Monetary Economics, Vol. 45, No. 7, 2001, pp. 1237-1270. [8] J. Gali, M. Gertler, et al., “Robustness of the Estimates of Hybrid New Keynesian Phillips Curve,” Journal of Monetary Economics, Vol. 52, No. 6, 2005, pp. 1107- 1118. doi:10.1016/j.jmoneco.2005.08.005 [9] A. Sbordone, “Inflation Persistence: Alternative Interpre- tations and Policy Implications,” Journal of Monetary Economics, Vol. 54, No. 5, 2007, pp. 1311-1339. doi:10.1016/j.jmoneco.2007.06.007 [10] J. Amato and S. Gerlach, “Inflation Targeting in Emer- ging Market and Transition Economies, Lessons after a Decade,” Centre for Economic Policy Research, 2001. [11] J. Fuhrer and M. Gerald, “Inflation Persistence,” Quar- terly Journal of Economics, Vol. 110, No. 1, 1995, pp. 127-159. doi:10.2307/2118513 [12] J. Roberts, “Inflation Expectations and the Transmission of Monetary Policy,” Board of Governors of the Federal Reserve System, 1998. [13] J. Roberts, “How Well Does The New Keynesian Sti- cky-Price Model Fit the Data?” Federal Rezerve Board FEDS Working Papers, 2001, pp. 1948-1943. [14] J. Rudd and K. Whelan, “New Tests of The New Key- nesian Phillips Curve,” Journal of Monetary Economics, Vol. 52, No. 6, 2005, pp. 1167-1181. doi:10.1016/j.jmoneco.2005.08.006 [15] J. Rudd and K. Whelan, “Modeling Inflation Dynamics: A Critical Review of Recent Research,” Journal of Money, Credit and Banking, Vol. 39, No. 1, 2007, pp. 155-170. doi:10.1111/j.1538-4616.2007.00019.x [16] J. Stock and M. Watson, “Why Has US Inflation Become Harder To Forecast?” Journal of Money, Credit and Banking, Vol. 39, No. 1, 2007, pp. 3-34. doi:10.1111/j.1538-4616.2007.00014.x [17] L. S. Ball, “Near-Rationality and Inflation in Two Mone- tary Regimes,” NBER Working Paper, 2000. [18] N. G. Mankiw and R. Reis, “Sticky Information Versus Sticky Prices: A Proposal to Replace the New Keynesian Phillips Curve,” Harvard University, Cambridge, 2001. [19] J. C. Fuhrer, “The (un)İmportance of Forward-Looking Behavior in Price Specifications,” Journal of Money, Cre- dit and Banking, Vol. 29, No. 3, 1997, pp. 338-350. doi:10.2307/2953698 [20] A. Estrella and J. Fuhrer, “Dynamic Inconsistincies: Counterfactual Implications of a Class of Rational Expe- ctations Models,” The American Economic Review, Vol. 92, No. 4, 2002, pp. 1013-1028. doi:10.1257/00028280260344579 [21] E. Jondeau and H. Le Bihan, “Testing for The New Key- nesian Phillips Curve; Additional International Eviden- ce,” Economic Modelling, Vol. 22, No. 3, 2005, pp. 521- 550. doi:10.1016/j.econmod.2004.09.002 [22] S. Henzel and T. Wollmershaeuser, “The New Keynesian Phillips Curve and the Role of Expectations: Evidence From the Ifo World Economic Survey,” CESifo Working Paper, 2006. [23] A. Carriero, “A Simple Test of the New Keynesian Phi-  Ç. BOZ Copyright © 2013 SciRes. ME 632 llips Curve,” Economic Letters, Vol. 100, No. 2, 2008, pp. 241-244. doi:10.1016/j.econlet.2008.02.012 [24] P. Söderlind, U. Söderström and A. Vredin, “Can a Ca- librated New-Keynesian Model of Monetary Policy Fit the Facts?” SSE/EFI Working Paper Series in Economics and Finance No. 511, 2002. [25] F. Jean-Baptiste, “Forecasting with the New Keynesian Phillips Curve: Evidence from Survey Data,” Economic Letters, Vol. 117, No. 3, 2012, pp. 811-813. doi:10.1016/j.econlet.2011.02.034 [26] W. Roeger and B. Herz, “Traditional Versus New Key- nesian Phillips Curves; Evidence from Output Effects,” International Journal of Central Banking, 2012, pp. 87- 109. [27] G. Chorteas, G. Magonis and T. Panagiotidis, “The Asy- mmetry of the New Keynesian Phillips Curve in the Euro- Area,” Economic Letters, Vol. 114, No. 2, 2012, pp. 161- 163. doi:10.1016/j.econlet.2011.09.035 [28] M. E. Yazgan and H. Yılmazkuday, “Inflation Dynamics of Turkey: A Structural Estimation,” Studies in Nonlinear Dynamics & Econometrics, Vol. 9, No. 1, 2005, pp. 1-13. doi:10.2202/1558-3708.1228 [29] G. Saz, “The Turkish Phillips Curve Experience and the New Keynesian Phillips Curve: A Conceptualization and Application of a Novel Measure for Marginal Costs,” International Research Journal of Finance and Econo- mics, Vol. 63. 2011, pp. 8-45. [30] J. M. Nason and G. W. Smith, “The New Keynesian Phi- llips Curve: Lessons from Single-Equation Econometric Estimation,” Economics Quarterly, Vol. 94, No. 4, 2008, pp. 667-684. [31] R. Koenker and G. Basset, “Regression Quantiles,” Eco- nometrica, Vol. 46, No. 1, 1978, pp. 33-50. doi:10.2307/1913643 |