

Paper Menu >>
Journal Menu >>
 Open Journal of Nephrology, 2013, 3, 161-167 http://dx.doi.org/10.4236/ojneph.2013.33029 Published Online September 2013 (http://www.scirp.org/journal/ojneph) Study of Dialyzer Membrane (Polyflux 210H) and Effects of Different Parameters on Dialysis Performance Md Shihamul Islam*, Jerzy Szpunar Department of Mechanical Engineering, University of Saskatchewan, Saskatoon, Canada Email: *[email protected] Received May 22, 2013; revised June 20, 2013; accepted July 13, 2013 Copyright © 2013 Md Shihamul Islam, Jerzy Szpunar. This is an open access article distributed under the Creative Commons Attri- bution License, which permits unrestricted use, distribution, and reproduction in any medium, provided the original work is properly cited. ABSTRACT Problems frequently encountered in kidney malfunction include abnormal fluid levels in the body, increased acid levels, abnormal levels of Urea, Glucose, Endothelin, β2-Microglobulin and Complement Factor D. Parameters characterizing the structure of dialyzers are very important because they decide overall clearance of toxin molecules and at the same time should allow retaining useful molecules in the blood. In this paper, a cross sectional image of the dialyzer mem- brane with details of the porosity is presented. A multilayered membrane model with different porosity for each layer, describes the actual structure of Polyflux 210H membrane. This model is developed using Finite Element Software— COMSOL Multiphysics 4.3. A blood flow with substances like—Urea, Glucose, Endothelin, β2-Microglobulin, Com- plement Factor D and Albumin is introduced. For a certain blood flow rate, the toxins diffuse through the membrane and on the other side of the membrane a dialysate flow removes the toxins. Here, different parameters, such as flow rate of blood and dialysate, length and radius of the fiber are changed to simulate how these changes affect toxin clearance and the removal of useful molecules. Keywords: Simulation, Dialysis; Axisymmetric Model; 3-Layered Membrane; Effective Diffusivity; Parameters; COMSOL Multiphysics 4.3 1. Introduction A substantial amount of research has been performed regarding homogeneous dialyzer membranes. These ho- mogeneous dialyzer membranes are mostly made of cel- lulose. These membranes have a uniform pore structure from the inner to the outer side of the membrane. The surface of such membranes was not very biocompatible, because exposed hydroxyl groups would activate com- plement in the blood passing by the membrane. There- fore, these days dialyzer membranes are made from syn- thetic materials, using polymers such as polyarylether- sulfone, polyamide, polyvinylpyrrolidone, polycarbonate and polyacrylonitrile. These synthetic membranes acti- vate complement to a lesser degree than cellulose mem- branes [1]. They have a structure which is known as asymmetric. This actually means that the shape of a pore gradually changes from inner to outer surface of the membrane. Synthetic membranes can be made in either low- or high-flux configuration, but most are high-flux. Polyflux 210H is an example of such high flux asymmet- ric polymer membrane. Sakai et al. [2] studied and cap- tured the images of inner and outer surface images of such an asymmetric membrane. They calculated the sur- face porosity based on those photomicrographs. These give an idea of the surface porosity. But to what extend that porosity continues from one surface to another is not sure. Taking cross sectional image of the membrane and calculating the porosity from that image allow a better description of it. Experimental studies [3,4] have been done to determine whether increasing the dialysate or blood flow rate leads to better clearance or not. But these studies did not consider the structure of the membrane. Also these studies were limited to clearance of Urea only. A reasonable concern for doctors, in these days, is whether the necessary elements like Albumin are dif- fused through the membrane during the dialysis or not. Most of the experimental studies are done with dialyzers which are commercially available. So they actually give a comparison between different dialyzers. But which parameters of dialysis process are really important to have a better overall clearance of toxin molecules and at the same time retain useful molecules is not clear. Also *Corresponding author. C opyright © 2013 SciRes. OJNeph 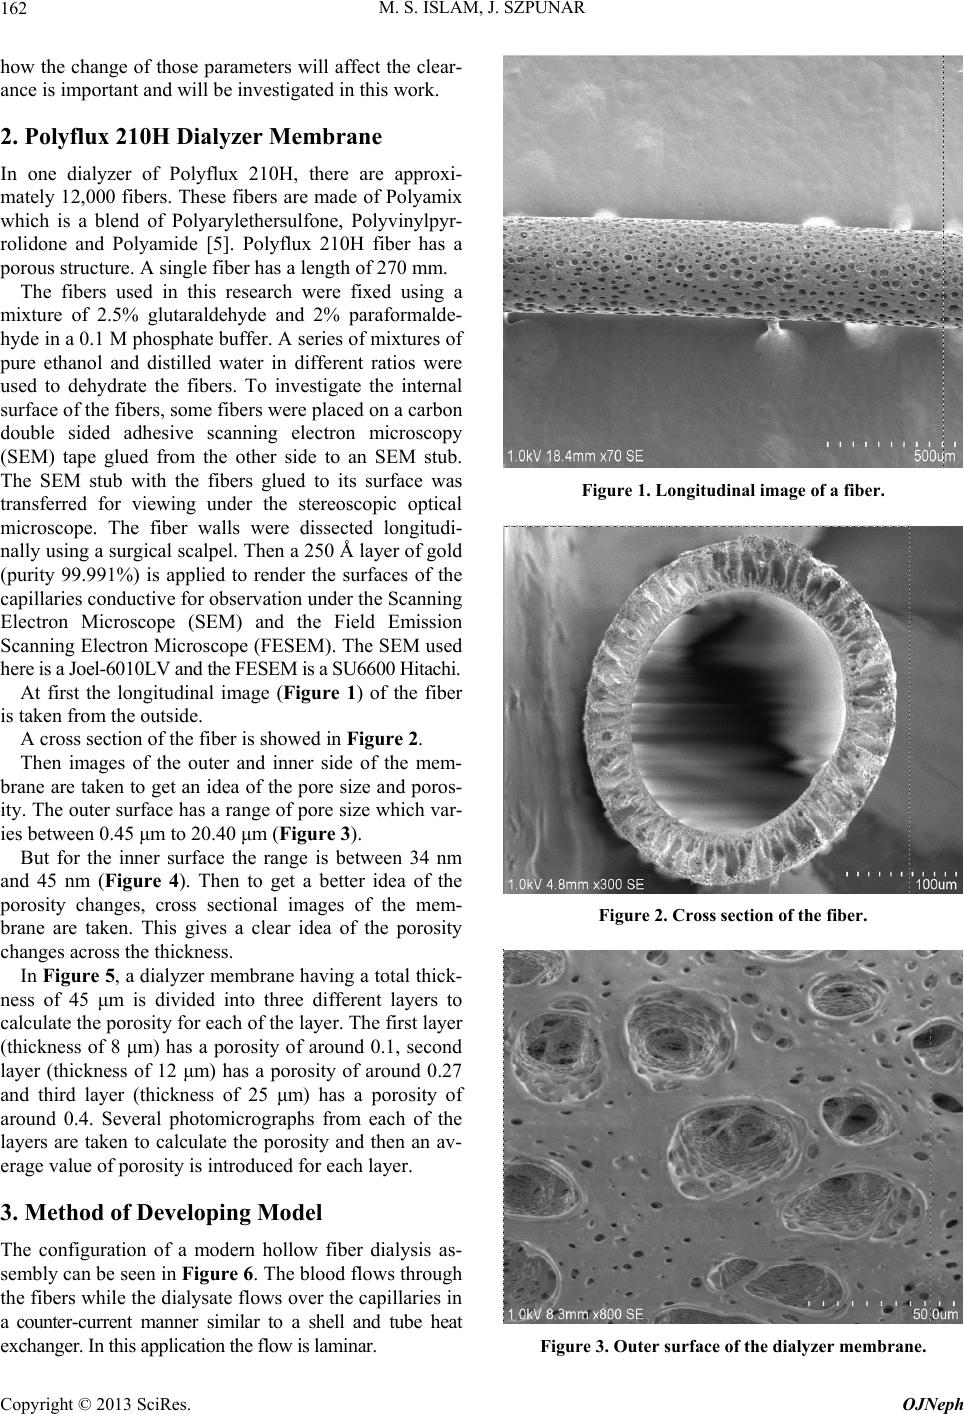 M. S. ISLAM, J. SZPUNAR 162 how the change of those parameters will affect the clear- ance is important and will be investigated in this work. 2. Polyflux 210H Dialyzer Membrane In one dialyzer of Polyflux 210H, there are approxi- mately 12,000 fibers. These fibers are made of Polyamix which is a blend of Polyarylethersulfone, Polyvinylpyr- rolidone and Polyamide [5]. Polyflux 210H fiber has a porous structure. A single fiber has a length of 270 mm. The fibers used in this research were fixed using a mixture of 2.5% glutaraldehyde and 2% paraformalde- hyde in a 0.1 M phosphate buffer. A series of mixtures of pure ethanol and distilled water in different ratios were used to dehydrate the fibers. To investigate the internal surface of the fibers, some fibers were placed on a carbon double sided adhesive scanning electron microscopy (SEM) tape glued from the other side to an SEM stub. The SEM stub with the fibers glued to its surface was transferred for viewing under the stereoscopic optical microscope. The fiber walls were dissected longitudi- nally using a surgical scalpel. Then a 250 Å layer of gold (purity 99.991%) is applied to render the surfaces of the capillaries conductive for observation under the Scanning Electron Microscope (SEM) and the Field Emission Scanning Electron Microscope (FESEM). The SEM used here is a Joel-6010LV and the FESEM is a SU6600 Hitachi. Figure 1. Longitudinal image of a fiber. At first the longitudinal image (Figure 1) of the fiber is taken from the outside. A cross section of the fiber is showed in Figure 2. Then images of the outer and inner side of the mem- brane are taken to get an idea of the pore size and poros- ity. The outer surface has a range of pore size which var- ies between 0.45 μm to 20.40 μm (Figure 3). But for the inner surface the range is between 34 nm and 45 nm (Figure 4). Then to get a better idea of the porosity changes, cross sectional images of the mem- brane are taken. This gives a clear idea of the porosity changes across the thickness. Figure 2. Cross section of the fiber. In Figure 5, a dialyzer membrane having a total thick- ness of 45 μm is divided into three different layers to calculate the porosity for each of the layer. The first layer (thickness of 8 μm) has a porosity of around 0.1, second layer (thickness of 12 μm) has a porosity of around 0.27 and third layer (thickness of 25 μm) has a porosity of around 0.4. Several photomicrographs from each of the layers are taken to calculate the porosity and then an av- erage value of porosity is introduced for each layer. 3. Method of Developing Model The configuration of a modern hollow fiber dialysis as- sembly can be seen in Figure 6 . The blood flows through the fibers while the dialysate flows over the capillaries in a counter-current manner similar to a shell and tube heat exchanger. In this application the flow is laminar. Figure 3. Outer surface of the dialyzer membrane. Copyright © 2013 SciRes. OJNeph 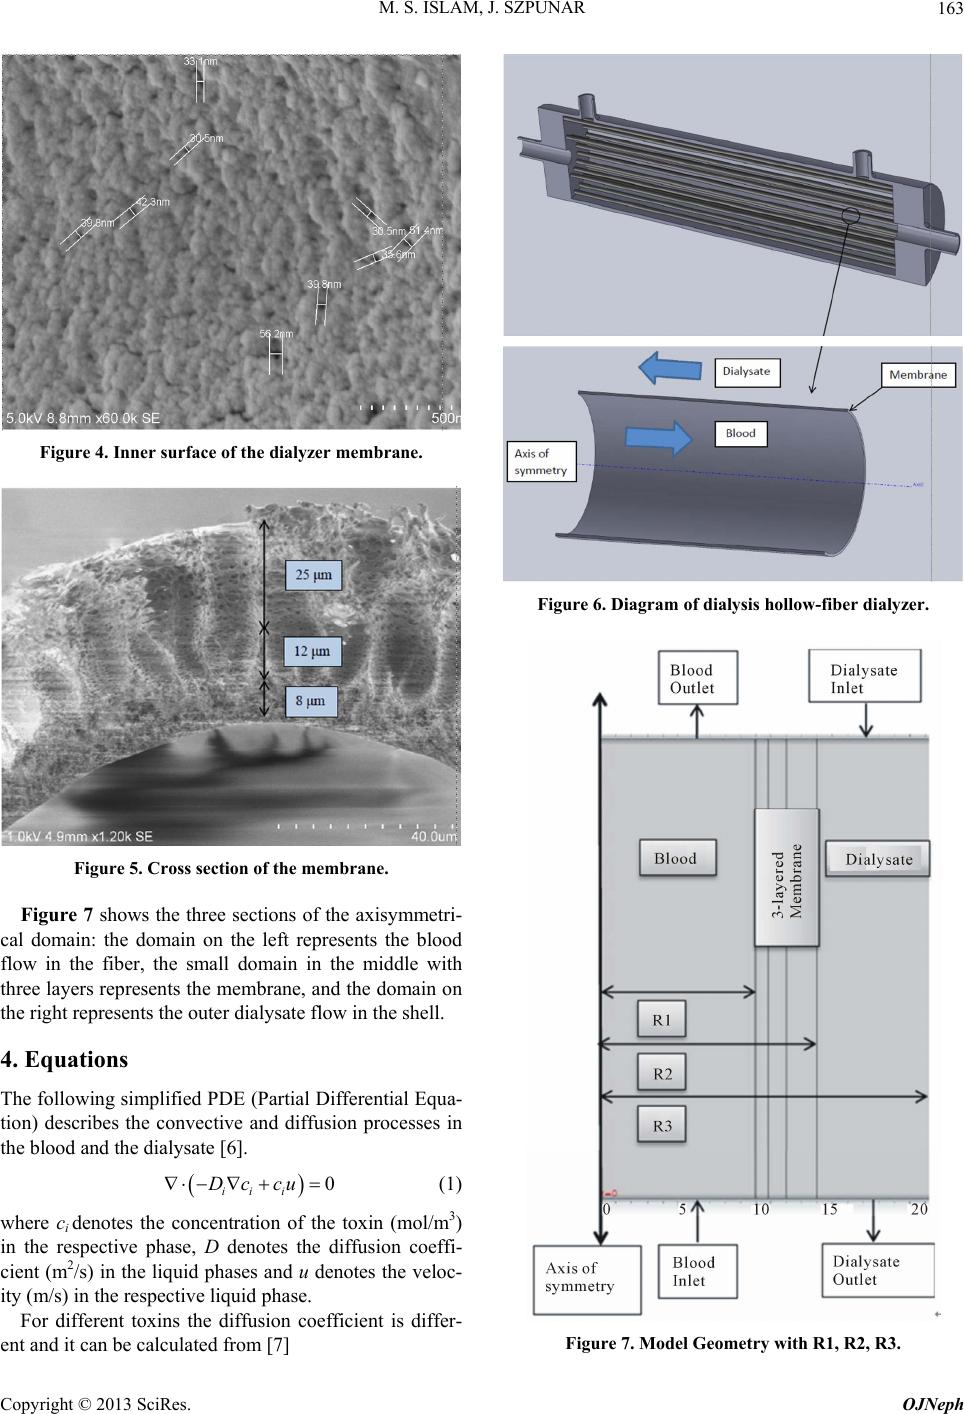 M. S. ISLAM, J. SZPUNAR 163 Figure 4. Inner surface of the dialyzer membrane. Figure 6. Diagram of dialysis hollow-fiber dialyzer. Figure 5. Cross section of the membrane. Figure 7 shows the three sections of the axisymmetri- cal domain: the domain on the left represents the blood flow in the fiber, the small domain in the middle with three layers represents the membrane, and the domain on the right represents the outer dialysate flow in the shell. 4. Equations The following simplified PDE (Partial Differential Equa- tion) describes the convective and diffusion processes in the blood and the dialysate [6]. 0 ii i Dc cu (1) where ci denotes the concentration of the toxin (mol/m3) in the respective phase, D denotes the diffusion coeffi- cient (m2/s) in the liquid phases and u denotes the veloc- ity (m/s) in the respective liquid phase. For different toxins the diffusion coefficient is differ- ent and it can be calculated from [7] Figure 7. Model Geometry with R1, R2, R3. Copyright © 2013 SciRes. OJNeph 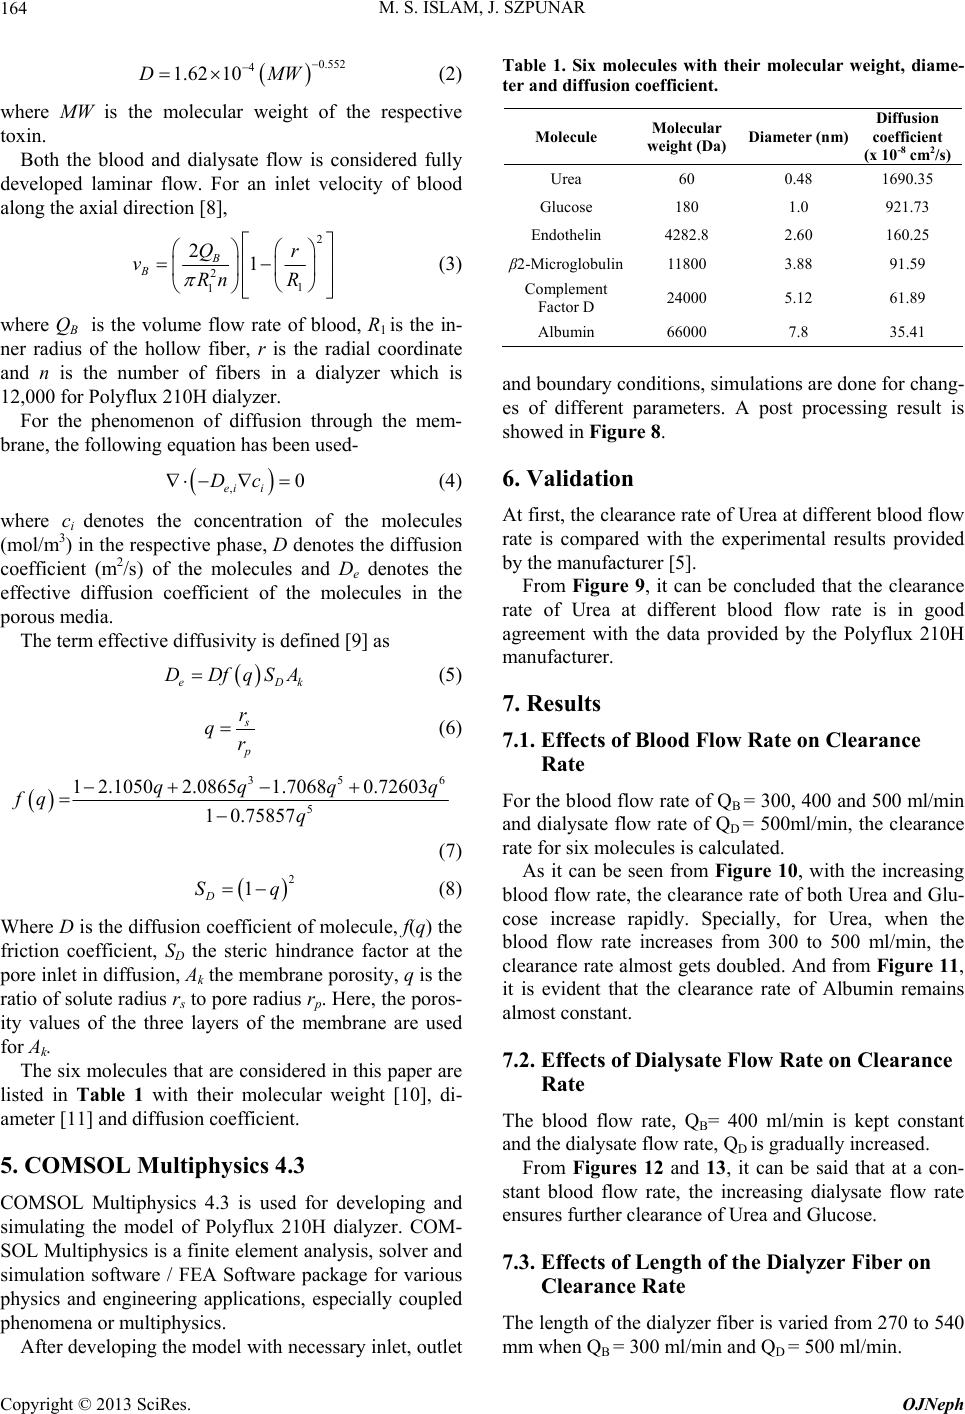 M. S. ISLAM, J. SZPUNAR 164 Table 1. Six molecules with their molecular weight, diame- 0.552 4 1.62 10DMW (2) ter and diffusion coefficient. where MW is the molecular weight of the respective toxin. Molecule Molecular Diameter (nm) Diffusion ( Both the blood and dialysate flow is considered fully developed laminar flow. For an inlet velocity of blood along the axial direction [8], 2 2 1 1 21 B B Qr vR Rn ,0 ei i Dc Dk (3) where QB is the volume flow rate of blood, R1 is the in- ner radius of the hollow fiber, r is the radial coordinate and n is the number of fibers in a dialyzer which is 12,000 for Polyflux 210H dialyzer. For the phenomenon of diffusion through the mem- brane, the following equation has been used- (4) where ci denotes the concentration of the molecules (mol/m3) in the respective phase, D denotes the diffusion coefficient (m2/s) of the molecules and De denotes the effective diffusion coefficient of the molecules in the porous media. The term effective diffusivity is defined [9] as e DDfqSA (5) s p r qr (6) 35 5 1 2.10502.08651.70680.72603 1 0.758 57 qq q fq q 6 q q (7) 2 1 D S (8) Where D is the diffusion coefficient of molecule, f(q) the friction coefficient, SD the steric hindrance factor at the pore inlet in diffusion, Ak the membrane porosity, q is the ratio of solute radius rs to pore radius rp. Here, the poros- ity values of the three layers of the membrane are used for Ak. The six molecules that are considered in this paper are listed in Table 1 with their molecular weight [10], di- ameter [11] and diffusion coefficient. 5. COMSOL Multiphysics 4.3 weight (Da) coefficient x 10-8 cm2/s) Urea 60 0.48 1690.35 Glucose 180 1.0 921.73 E 4 β2- in ndothelin282.8 2.60 160.25 Microglobul11800 3.88 91.59 Complement Factor D Albumin 24000 5.12 61.89 66000 7.8 35.41 and boundary conditions, simulations are done for chang- e rate of Urea at different blood flow be concluded that the clearance ra 7. Results of Blood Flow Rate on Clearance For d flow rate of QB = 300, 400 and 500 ml/min , with the increasing bl 7.2. Effects of Dialysate Flow Rate on Clearance The flow rate, QB= 400 ml/min is kept constant n- st 7.3. Effects of Length of the Dialyzer Fiber on The er fiber is varied from 270 to 540 es of different parameters. A post processing result is showed in Figure 8. 6. Validation ncAt first, the cleara rate is compared with the experimental results provided by the manufacturer [5]. From Figure 9, it can te of Urea at different blood flow rate is in good agreement with the data provided by the Polyflux 210H manufacturer. 7.1. Effects Rate the bloo and dialysate flow rate of QD = 500ml/min, the clearance rate for six molecules is calculated. As it can be seen from Figure 10 ood flow rate, the clearance rate of both Urea and Glu- cose increase rapidly. Specially, for Urea, when the blood flow rate increases from 300 to 500 ml/min, the clearance rate almost gets doubled. And from Figure 11, it is evident that the clearance rate of Albumin remains almost constant. Rate blood and the dialysate flow rate, QD is gradually increased. From Figures 12 and 13, it can be said that at a co ant blood flow rate, the increasing dialysate flow rate ensures further clearance of Urea and Glucose. COMSOL Multiphysics 4.3 is used for developing and simulating the model of Polyflux 210H dialyzer. COM- SOL Multiphysics is a finite element analysis, solver and simulation software / FEA Software package for various physics and engineering applications, especially coupled phenomena or multiphysics. Clearance Rate length of the dialyz mm when QB = 300 ml/min and QD = 500 ml/min. After developing the model with necessary inlet, outlet Copyright © 2013 SciRes. OJNeph 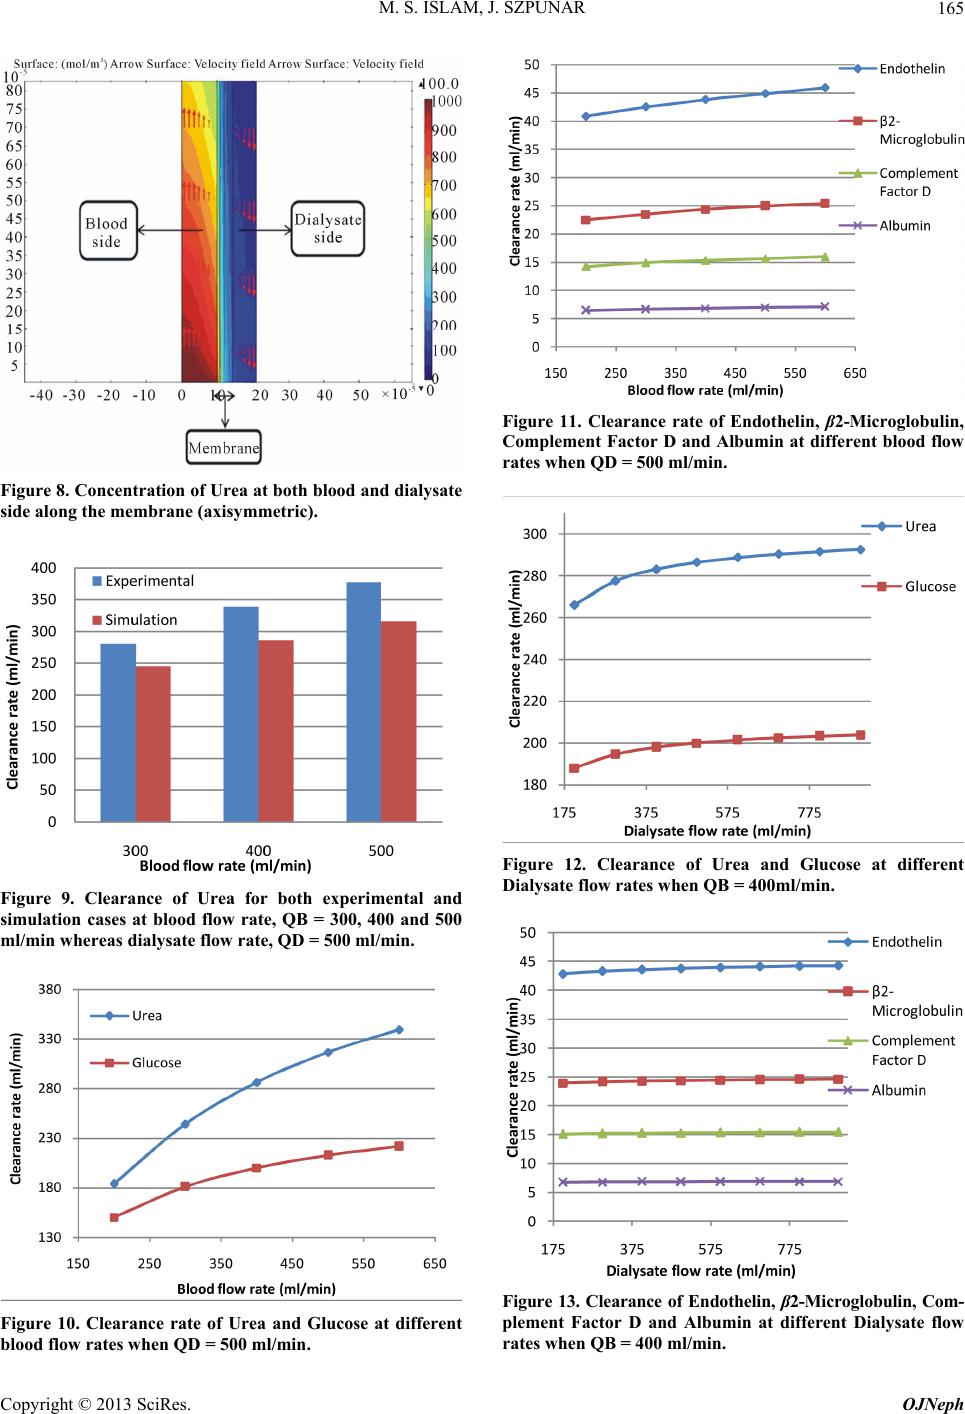 M. S. ISLAM, J. SZPUNAR 165 Figure 8. Concentration of Urea at both blood and dialysate side along the membrane (axisymmetric). Figure 9. Clearance of Urea for both experimental and simulation cases at blood flow rate, QB = 300, 400 and 500 ml/min whereas dialysate flow rate, QD = 500 ml/min. Figure 11. Clearance rate of Endothelin, β2-Microglobulin, Complement Factor D and Albumin at different blood flow rates when QD = 500 ml/min. Figure 12. Clearance of Urea and Glucose at different Dialysate flow rates when QB = 400ml/min. Figure 13. Clearance of Endothelin, β2-Microglobulin, Com- plement Factor D and Albumin at different Dialysate flow rates when QB = 400 ml/min. Figure 10. Clearance rate of Urea and Glucose at different blood flow rates when QD = 500 ml/min. Copyright © 2013 SciRes. OJNeph 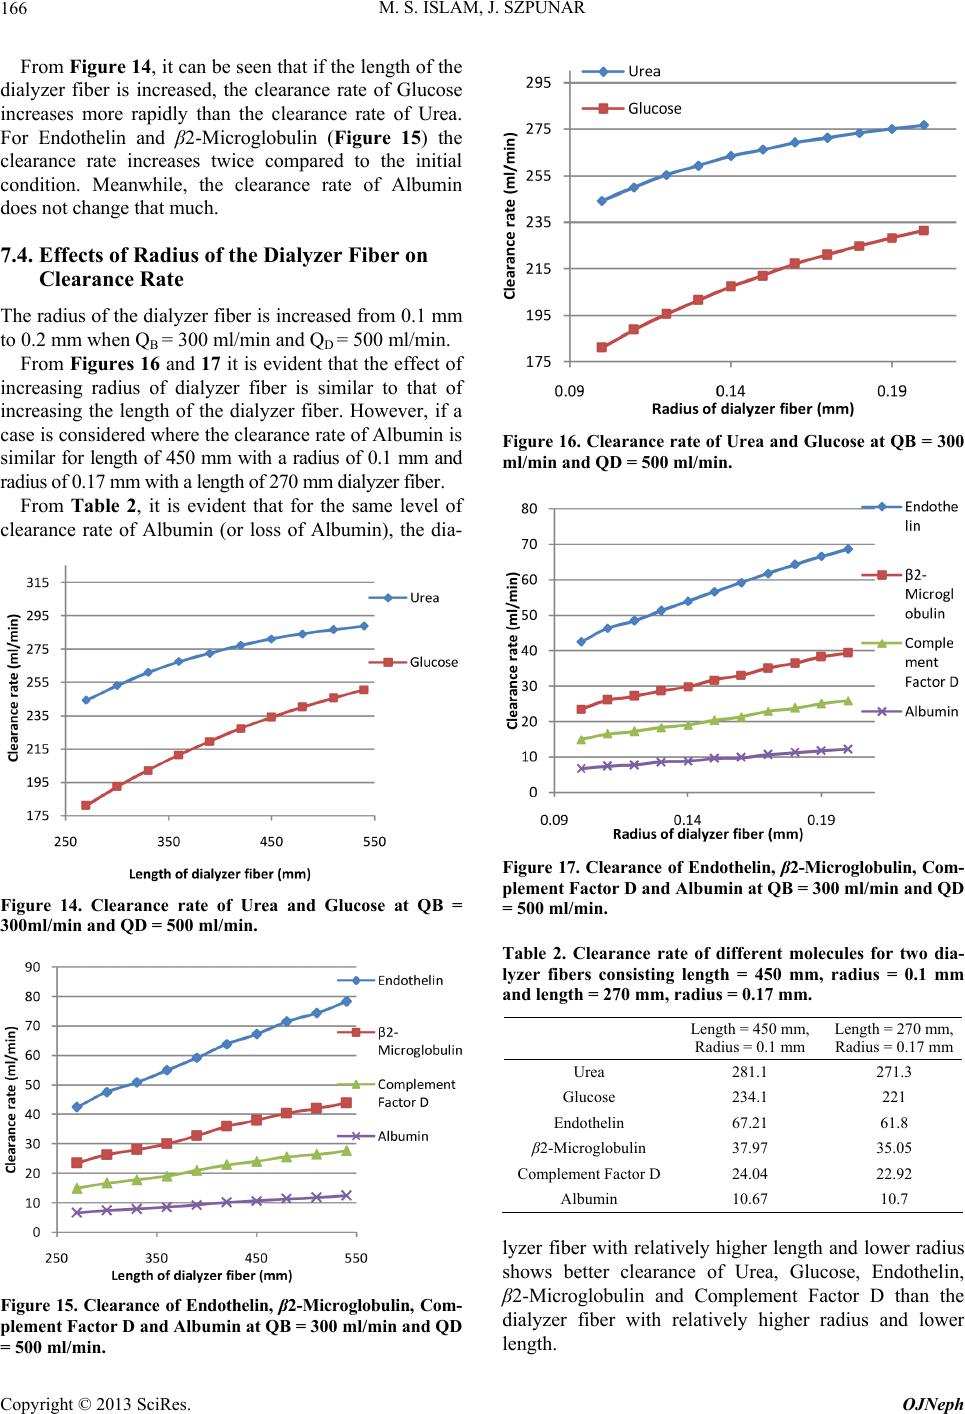 M. S. ISLAM, J. SZPUNAR 166 From Figure 14, it can be seen that if the length of the di 7.4. Effects of Radius of the Dialyzer Fiber on The r fiber is increased from 0.1 mm in cl alyzer fiber is increased, the clearance rate of Glucose increases more rapidly than the clearance rate of Urea. For Endothelin and β2-Microglobulin (Figure 15) the clearance rate increases twice compared to the initial condition. Meanwhile, the clearance rate of Albumin does not change that much. Clearance Rate radius of the dialyze to 0.2 mm when QB = 300 ml/min and QD = 500 ml/min. From Figures 16 and 17 it is evident that the effect of creasing radius of dialyzer fiber is similar to that of increasing the length of the dialyzer fiber. However, if a case is considered where the clearance rate of Albumin is similar for length of 450 mm with a radius of 0.1 mm and radius of 0.17 mm with a length of 270 mm dialyzer fiber. From Table 2, it is evident that for the same level of earance rate of Albumin (or loss of Albumin), the dia- Figure 14. Clearance rate of Urea and Glucose at QB = 300ml/min and QD = 500 ml/min. Figure 16. Clearance rate of Urea and Glucose at QB = 300 ml/min and QD = 500 ml/min. Figure 17. Clearance of Endothelin, β2-Microglobulin, Com able 2. Clearance rate of different molecules for two dia- Length = 270 mm, - plement Factor D and Albumin at QB = 300 ml/min and QD = 500 ml/min. T lyzer fibers consisting length = 450 mm, radius = 0.1 mm and length = 270 mm, radius = 0.17 mm. Length = 450 mm, Radius = 0.1 mm Radius = 0.17 mm Ura e281.1 271.3 G E β2-in C lucose 234.1 221 ndothelin 67.21 61.8 Microglobul37.97 35.05 omplement Factor D24.04 22.92 Albumin 10.67 10.7 zer fiber with relatively higher length and lower radius ly shows better clearance of Urea, Glucose, Endothelin, β2-Microglobulin and Complement Factor D than the dialyzer fiber with relatively higher radius and lower length. Figure 15. Clearance of Endothelin, β2-Microglobulin, Com- plement Factor D and Albumin at QB = 300 ml/min and QD = 500 ml/min. Copyright © 2013 SciRes. OJNeph 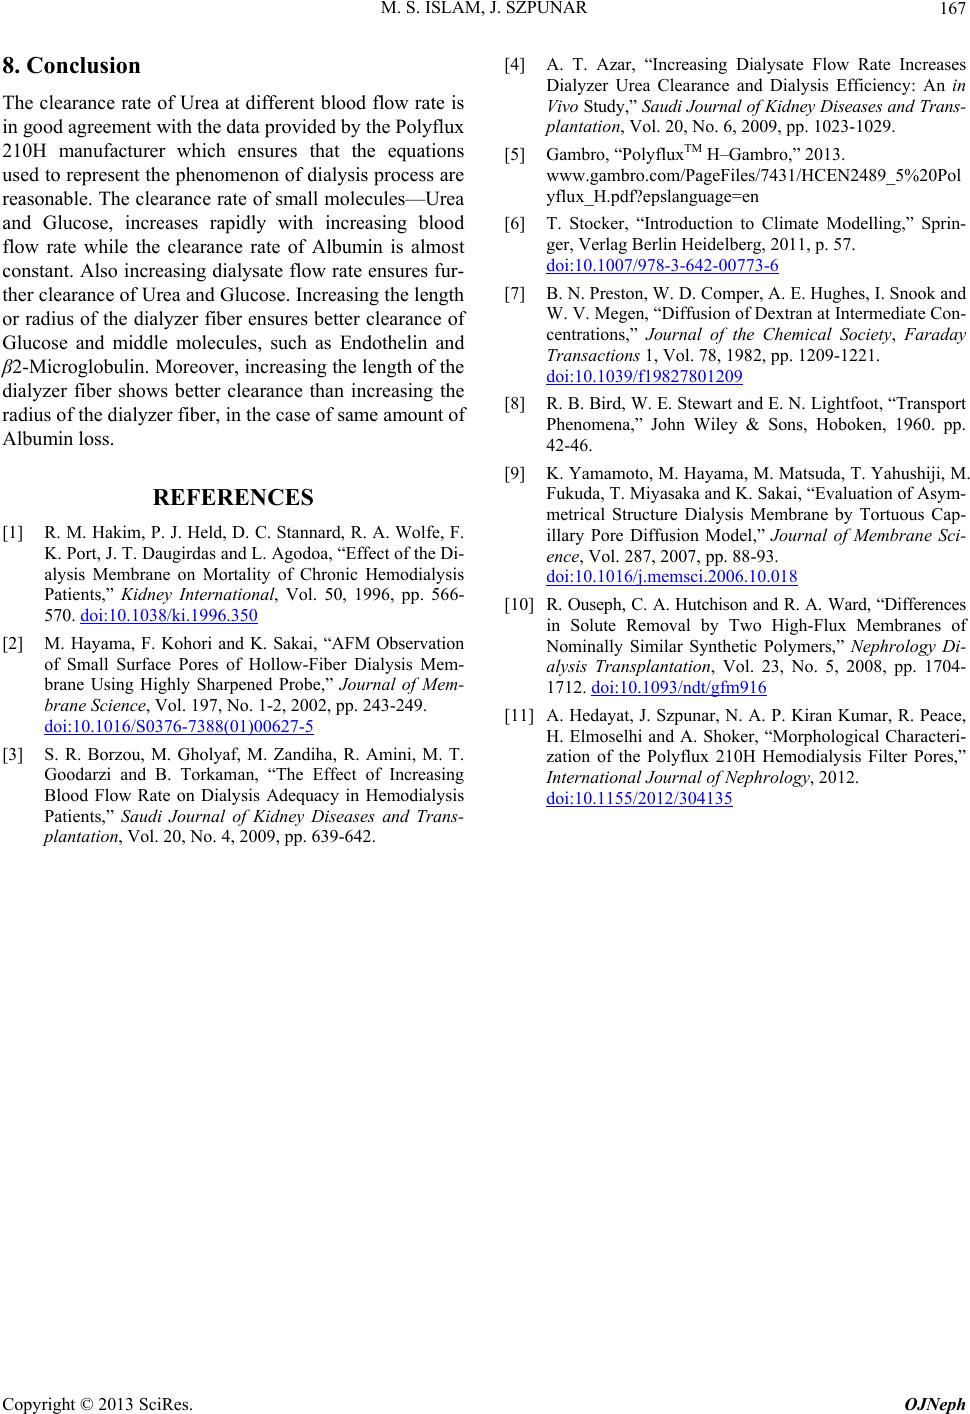 M. S. ISLAM, J. SZPUNAR Copyright © 2013 SciRes. OJNeph 167 clusion of Urea at different blood flow rate is REFERENCES [1] R. M. Hakim,rd, R. A. Wolfe, F 8. Con The clearance rate in good agreement with the data provided by the Polyflux 210H manufacturer which ensures that the equations used to represent the phenomenon of dialysis process are reasonable. The clearance rate of small molecules—Urea and Glucose, increases rapidly with increasing blood flow rate while the clearance rate of Albumin is almost constant. Also increasing dialysate flow rate ensures fur- ther clearance of Urea and Glucose. Increasing the length or radius of the dialyzer fiber ensures better clearance of Glucose and middle molecules, such as Endothelin and β2-Microglobulin. Moreover, increasing the length of the dialyzer fiber shows better clearance than increasing the radius of the dialyzer fiber, in the case of same amount of Albumin loss. P. J. Held, D. C. Stanna. K. Port, J. T. Daugirdas and L. Agodoa, “Effect of the Di- alysis Membrane on Mortality of Chronic Hemodialysis Patients,” Kidney International, Vol. 50, 1996, pp. 566- 570. doi:10.1038/ki.1996.350 [2] M. Hayama, F. Kohori and K. Sakai, “AFM Observation of Small Surface Pores of Hollow-Fiber Dialysis Mem- brane Using Highly Sharpened Probe,” Journal of Mem- brane Science, Vol. 197, No. 1-2, 2002, pp. 243-249. doi:10.1016/S0376-7388(01)00627-5 [3] S. R. Borzou, M. Gholyaf, M. Zandiha, R. Amini, M Increases 489_5%20Pol mate Modelling,” Sprin- . T. Goodarzi and B. Torkaman, “The Effect of Increasing Blood Flow Rate on Dialysis Adequacy in Hemodialysis Patients,” Saudi Journal of Kidney Diseases and Trans- plantation, Vol. 20, No. 4, 2009, pp. 639-642. [4] A. T. Azar, “Increasing Dialysate Flow Rate Dialyzer Urea Clearance and Dialysis Efficiency: An in Vivo Study,” Saudi Journal of Kidney Diseases and Trans- plantation, Vol. 20, No. 6, 2009, pp. 1023-1029. [5] Gambro, “PolyfluxTM H–Gambro,” 2013. www.gambro.com/PageFiles/7431/HCEN2 yflux_H.pdf?epslanguage=en [6] T. Stocker, “Introduction to Cli ger, Verlag Berlin Heidelberg, 2011, p. 57. doi:10.1007/978-3-642-00773-6 [7] B. N. Preston, W. D. Comper, A. E. Hughes, I. Snook and W. V. Megen, “Diffusion of Dextran at Intermediate Con- centrations,” Journal of the Chemical Society, Faraday Transactions 1, Vol. 78, 1982, pp. 1209-1221. doi:10.1039/f19827801209 [8] R. B. Bird, W. E. Stewart and E. N. Lightfoot, “Transport amoto, M. Hayama, M. Matsuda, T. Yahushiji, M. Phenomena,” John Wiley & Sons, Hoboken, 1960. pp. 42-46. [9] K. Yam Fukuda, T. Miyasaka and K. Sakai, “Evaluation of Asym- metrical Structure Dialysis Membrane by Tortuous Cap- illary Pore Diffusion Model,” Journal of Membrane Sci- ence, Vol. 287, 2007, pp. 88-93. doi:10.1016/j.memsci.2006.10.018 [10] R. Ouseph, C. A. Hutchison and R. A. Ward, “Differences in Solute Removal by Two High-Flux Membranes of Nominally Similar Synthetic Polymers,” Nephrology Di- alysis Transplantation, Vol. 23, No. 5, 2008, pp. 1704- 1712. doi:10.1093/ndt/gfm916 [11] A. Hedayat, J. Szpunar, N. A. P. Kiran Kumar, R. Peace, H. Elmoselhi and A. Shoker, “Morphological Characteri- zation of the Polyflux 210H Hemodialysis Filter Pores,” International Journal of Nephrology, 2012. doi:10.1155/2012/304135 |