

Paper Menu >>
Journal Menu >>
 Modern Economy, 2013, 4, 596-599 http://dx.doi.org/10.4236/me.2013.49064 Published Online September 2013 (http://www.scirp.org/journal/me) Emerging Asia’s Version of the Mundell-Fleming Model Suresh Ramanathan*, Kian Teng Economics Department, Faculty of Economics and Administration, University Malaya, Kuala Lumpur, Malaysia Email: *[email protected], [email protected] Received July 17, 2013; revised August 7, 2013; accepted August 13, 2013 Copyright © 2013 Suresh Ramanathan, Kian Teng. This is an open access article distributed under the Creative Commons Attribu- tion License, which permits unrestricted use, distribution, and reproduction in any medium, provided the original work is properly cited. ABSTRACT This paper explains the Mundell-Fleming model in the context of Emerging Asia economies management of capital mobility. Central Banks and Financial Regulators in Emerging Asia adopt a modified version of the model that incor- porates two vital levers, a policy driven and a market driven method that is adaptable to the magnitude of capital flow. A policy combination mix of both policy and market driven provides smooth monetary policy signal transmission to exchange rates. Keywords: Mundell-Fleming Model; Capital Mobility; Foreign Exchange Markets; Monetary Policy; Emerging Asia 1. Introduction Stable exchange rates, independent monetary policy and free capital flow, the trilemma or impossible trinity, sug- gest that only two of the above three objectives can be accomplished simultaneously according to Fleming and Mundell (1962 and 1963) [1,2]. In assessing the trilemma, findings by Mankiw (2010) [3] indicate China managed to achieve stable exchange rates and independent mone- tary policy that was accompanied by capital controls. But can the trilemma be considered as a guide for macroeco- nomic policy framework? Obstfeld et al. (2005) [4] sug- gest economies that are without a pegged exchange rate and have barriers to capital mobility can retain sufficient amount of monetary policy independence whereas economies with pegged exchange rates and do not have barriers to capital mobility would lose significant mone- tary policy independence. In a case study by Yu Hsing (2012) [5] on selected EA economies, findings in support of trilemma were evident in Malaysia, Philippines and Singapore, while there was no evidence of a trilemma situation in Indonesia and Thailand. Different macro- economic policy combinations prevailed in Malaysia, Philippines and Singapore, rendering the ability to switch to different policy combination over time in order to deal with major economic events. In conceptualizing the Mundell-Fleming model within the trilemma objective, it is pertinent to take into account the risk premium element in the form of barriers to capital mobility. In EA foreign exchange markets, barriers to capital mobility play a sig- nificant role in managing the overall macroeconomic policy framework. There are two key aspects of the EA version of the Mundell-Fleming model, the market and policy-driven space. 2. The Model The Mundell-Fleming model for EA incorporates mar- ket-driven, D point and policy-driven. E point (see Fig- ure 1). In the context of the standard model, points A, B and C remain, indicating the choice for central banks and finan- cial regulators being limited to adhering only two points of preference, where the distance between A to C being exchange rate fixing, A to B as monetary policy inde- pendence and B to C as free capital mobility. In EA a strict proposition of the Mundell Fleming model is a constrain for central banks and financial regulators fol- lowing the lessons learnt during the 1997/98 Asian Fi- nancial Crisis. Consistent with this objective, Aizenman et al. (2011a) [6] finds that for developing economies, maintaining exchange rate stability was a key priority up to the period of 1990, and since 2000, developing economies pursued managed exchange rate flexibility and retained partial monetary policy independence. The task of managing capital mobility is to keep it in line within the macroeconomic policy framework of the do- mestic economy, therefore, the introduction of points D and E. The midpoint of D to E is a policy combination mix where the degree of capital mobility between A to D *Corresponding author. O pen Access ME 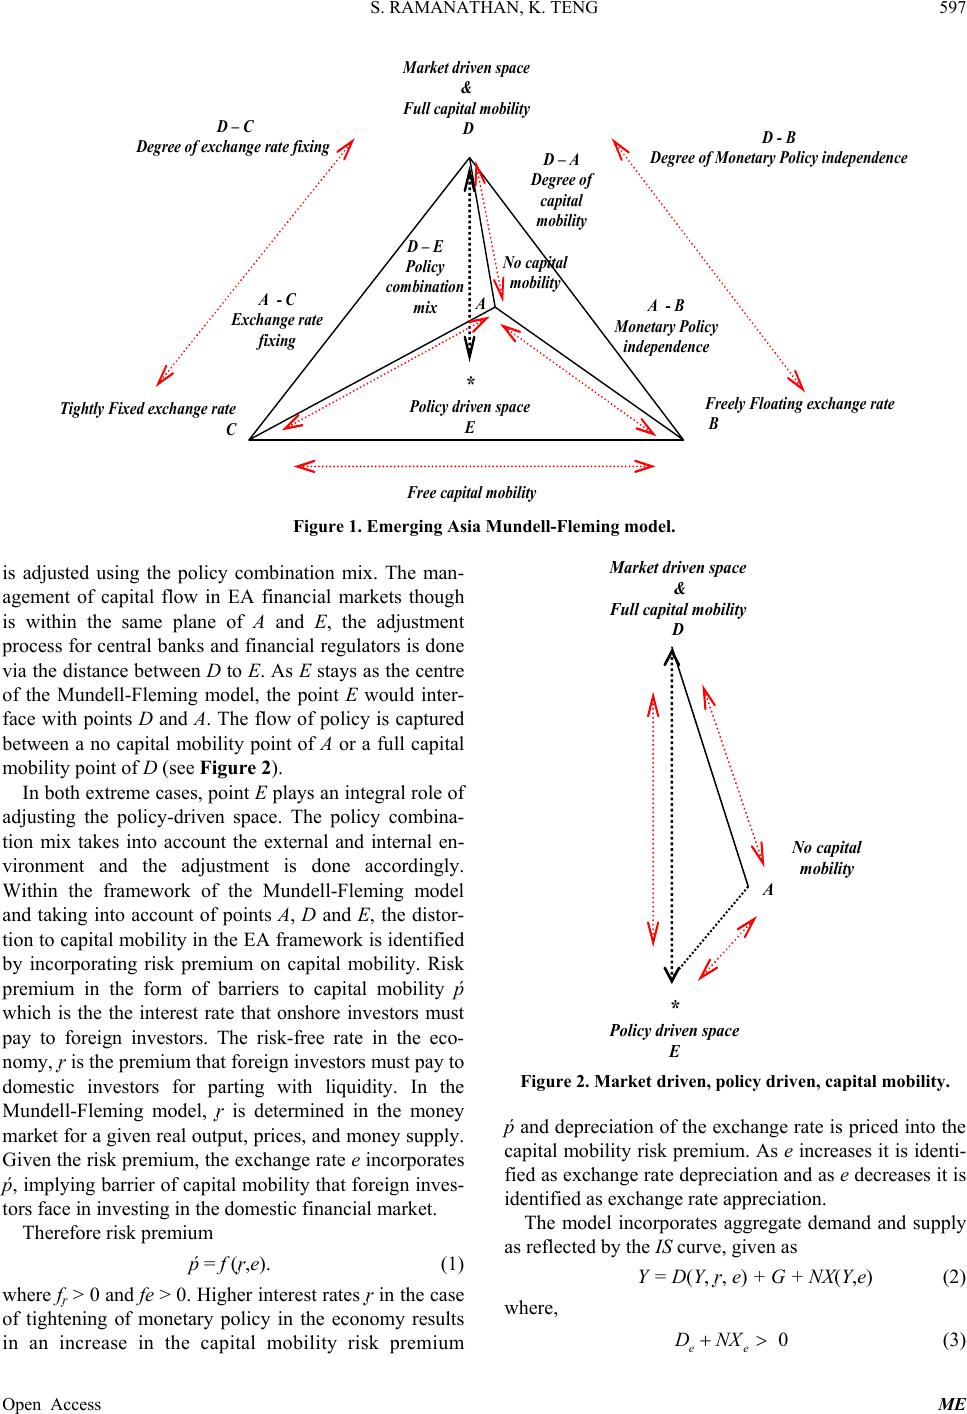 S. RAMANATHAN, K. TENG 597 Market driven space & Ful l capita l mobi li ty D Tight l y Fixe d exch ang e rate C D - B Degre e of Monet ary P olicy in de penden c e D – C Degree of exchange rate fixin g Free capital mobility Freely Floating exchange rate B * Policy driven space E A - B Monetary Po lic y indep en d en ce A - C Exchange rate fixing No capital mobility A D – A Degree of capital mobility D – E Policy combination mix Figure 1. Emerging Asia Mundell-Fleming model. is adjusted using the policy combination mix. The man- agement of capital flow in EA financial markets though is within the same plane of A and E, the adjustment process for central banks and financial regulators is done via the distance between D to E. As E stays as the centre of the Mundell-Fleming model, the point E would inter- face with points D and A. The flow of policy is captured between a no capital mobility point of A or a full capital mobility point of D (see Figure 2). In both extreme cases, point E plays an integral role of adjusting the policy-driven space. The policy combina- tion mix takes into account the external and internal en- vironment and the adjustment is done accordingly. Within the framework of the Mundell-Fleming model and taking into account of points A, D and E, the distor- tion to capital mobility in the EA framework is identified by incorporating risk premium on capital mobility. Risk premium in the form of barriers to capital mobility ṕ which is the the interest rate that onshore investors must pay to foreign investors. The risk-free rate in the eco- nomy, ᶉ is the premium that foreign investors must pay to domestic investors for parting with liquidity. In the Mundell-Fleming model, ᶉ is determined in the money market for a given real output, prices, and money supply. Given the risk premium, the exchange rate e incorporates ṕ, implying barrier of capital mobility that foreign inves- tors face in investing in the domestic financial market. Therefore risk premium ṕ = f (ᶉ,e). (1) where fᶉ > 0 and fe > 0. Higher interest rates ᶉ in the case of tightening of monetary policy in the economy results in an increase in the capital mobility risk premium Mark et driven spac e & Full capital mobility D No capital mobility A * Policy driven space E Figure 2. Market driven, policy driven, capital mobility. ṕ and depreciation of the exchange rate is priced into the capital mobility risk premium. As e increases it is identi- fied as exchange rate depreciation and as e decreases it is identified as exchange rate appreciation. The model incorporates aggregate demand and supply as reflected by the IS curve, given as Y = D(Y, ᶉ, e) + G + NX(Y,e) (2) where, 0 ee DNX (3) Open Access ME 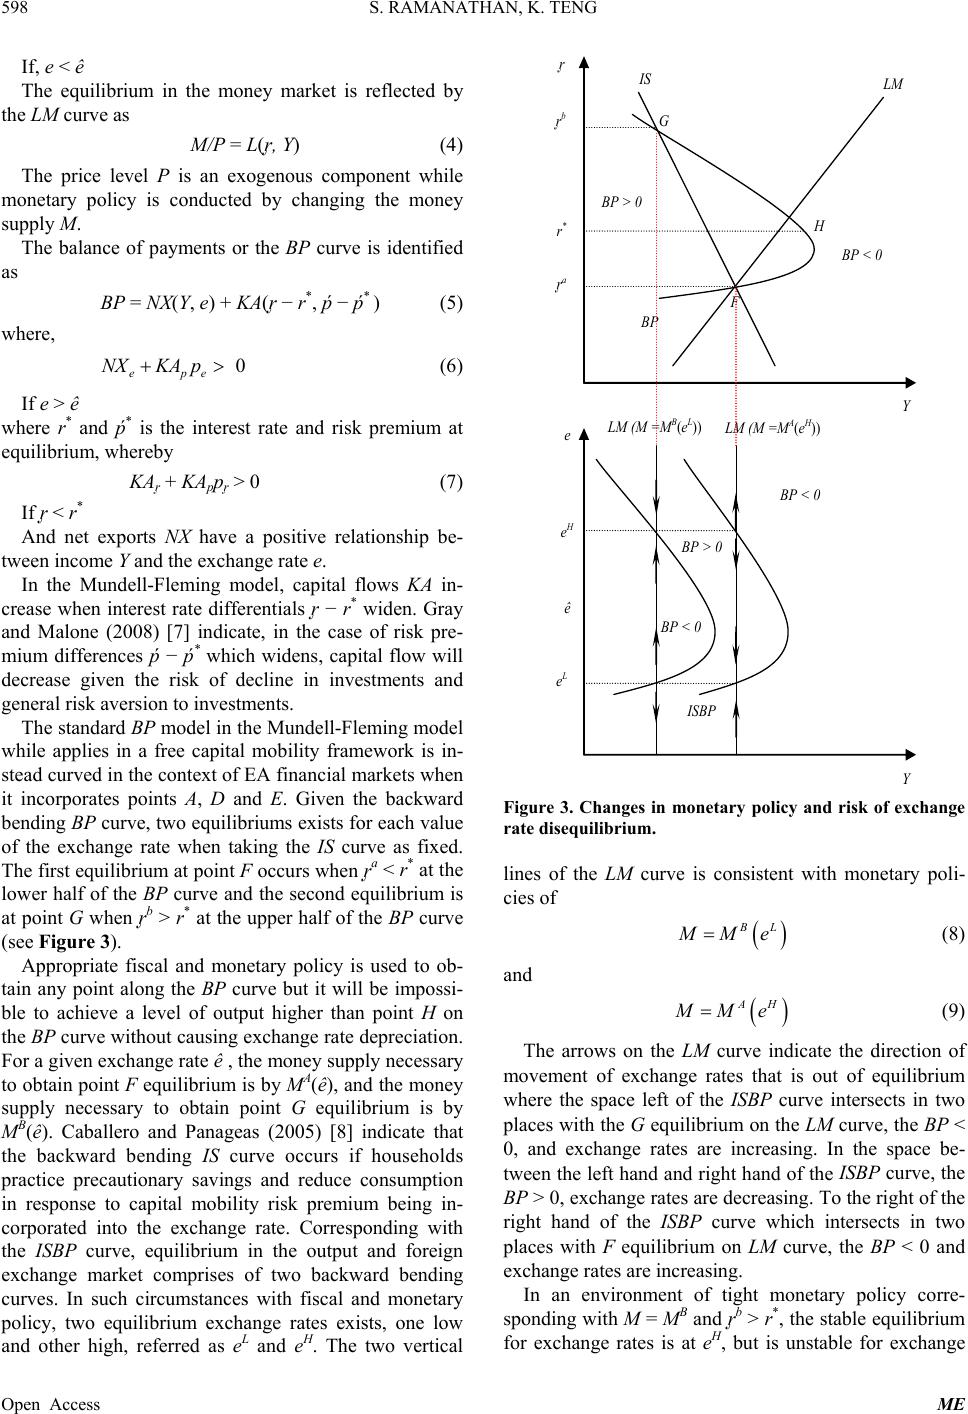 S. RAMANATHAN, K. TENG 598 If, e < ê The equilibrium in the money market is reflected by the LM curve as Open Access ME and other high, referred as e and e. The two vertical M/P = L(ᶉ, Y) (4) The price level P is an exogenous component while monetary policy is conducted by changing the money supply M. The balance of payments or the BP curve is identified as BP = NX(Y, e) + KA(ᶉ − r*, ṕ − ṕ* ) (5) where, 0 epe NXKA p (6) If e > ê where r* and ṕ* is the interest rate and risk premium at equilibrium, whereby KAᶉ + KAppᶉ > 0 (7) If ᶉ < r* And net exports NX have a positive relationship be- tween income Y and the exchange rate e. In the Mundell-Fleming model, capital flows KA in- crease when interest rate differentials ᶉ − r* widen. Gray and Malone (2008) [7] indicate, in the case of risk pre- mium differences ṕ − ṕ* which widens, capital flow will decrease given the risk of decline in investments and general risk aversion to investments. The standard BP model in the Mundell-Fleming model while applies in a free capital mobility framework is in- stead curved in the context of EA financial markets when it incorporates points A, D and E. Given the backward bending BP curve, two equilibriums exists for each value of the exchange rate when taking the IS curve as fixed. The first equilibrium at point F occurs when ᶉa < r* at the lower half of the BP curve and the second equilibrium is at point G when ᶉb > r* at the upper half of the BP curve (see Figure 3). Appropriate fiscal and monetary policy is used to ob- tain any point along the BP curve but it will be impossi- ble to achieve a level of output higher than point H on the BP curve without causing exchange rate depreciation. For a given exchange rate ê , the money supply necessary to obtain point F equilibrium is by MA(ê), and the money supply necessary to obtain point G equilibrium is by MB(ê). Caballero and Panageas (2005) [8] indicate that the backward bending IS curve occurs if households practice precautionary savings and reduce consumption in response to capital mobility risk premium being in- corporated into the exchange rate. Corresponding with the ISBP curve, equilibrium in the output and foreign exchange market comprises of two backward bending curves. In such circumstances with fiscal and monetary policy, two equilibrium exchange rates exists, one low L H F G Y ᶉ LM IS ᶉ b r * BP < 0 BP > 0 B P BP < 0 BP > 0 BP < 0 Y e e H e L ê LM (M =M B (e L )) LM (M =M A (e H )) ISB P H ᶉ a Figure 3. Changes in monetary policy and risk of exchange nes of the LM curve is consistent with monetary poli- rate disequilibrium. li cies of B L M Me (8) and AH M Me (9) The arrows on the LM curve indicate the m onetary policy corre- sp direction of ovement of exchange rates that is out of equilibrium where the space left of the ISBP curve intersects in two places with the G equilibrium on the LM curve, the BP < 0, and exchange rates are increasing. In the space be- tween the left hand and right hand of the ISBP curve, the BP > 0, exchange rates are decreasing. To the right of the right hand of the ISBP curve which intersects in two places with F equilibrium on LM curve, the BP < 0 and exchange rates are increasing. In an environment of tight m onding with M = MB and ᶉb > r*, the stable equilibrium for exchange rates is at eH, but is unstable for exchange  S. RAMANATHAN, K. TENG Open Access ME 599 3. Conclusion l mobility being a factor that sh REFERENCES [1] J. M. Flemingolicies under Fixed rate eL which indicates as monetary policy is tightened and given the risk premium to capital mobility, main- taining an exchange rate appreciation will be difficult. In the case of easing of monetary policy with M = MA and ra < r*, the stable equilibrium for exchange rates is at eL but is unstable for exchange rate eH as excessively loose monetary policy could induce a currency crisis. In EA with capitaapes macroeconomic prudential policies, the risk of tightening and loosening of monetary policy bears a significant im- pact on the direction of exchange rates. The importance of the Mundell Fleming Model in the context of EA is twofold. First, the imposition of barriers to capital mobil- ity could amplify the impact on exchange rates when monetary policy is tightened or loosened. Second, the risk premium on capital mobility can be reduced gradu- ally by carefully implementing a policy combination mix in order to transmit smooth monetary policy signal to exchange rates. , “Domestic Financial P and Floating Exchange Rates,” IMF Staff Papers, Vol. 9, 1962, pp. 369-379. doi:10.2307/3866091 [2] R. A. Mundell, “Capital Mobility and Stabilization Policy under Fixed and Flexible Exchange Rates,” Canadian Journal of Economic and Political Science, Vol. 29, No. 4, 1963, pp. 475-485. [3] N. G. Mankiw, “The Trilemma of International Finance,” New York Times, 1 July 2010. [4] M. Obstfeld, J. C. Shambaugh and A. M. Taylor, “The Trilemma in History: Tradeoffs among Exchange Rates, Monetary Policies, and Capital Mobility,” Review of Eco- nomics and Statistics, Vol. 87, No. 3, 2005, pp. 423-438. doi:10.1162/0034653054638300 [5] Y. Hsing, “Test of the Trilemma for Five Selected Asian Countries and Policy Implications,” Applied Economics Letters, Vol. 19, No. 17, 2012, pp. 1735-1739. doi:10.1080/13504851.2012.667542 [6] J. Aizenman, M. D. Chinn and H. Ito, “Surfing the Waves of Globalization: Asia and Financial Globalization in the Context of the Trilemma,” Journal of the Japanese and International Economies, Vol. 25, No. 3, 2011, pp. 290- 320. doi:10.1016/j.jjie.2011.06.003 [7] D. Gray and S. Malone, “Macrofinancial Risk Analysis,” 2008. doi:10.1002/9781118467428 [8] J. Ricardo, G. Caballero and S. Panageas, “Contingent Reserves Management: An Applied Framework,” Journal Economía Chilena (The Chilean Economy), Vol. 8, No. 2, 2005, pp. 45-56. |