

Paper Menu >>
Journal Menu >>
 Journal of Cancer Therapy, 2013, 4, 1256-1261 http://dx.doi.org/10.4236/jct.2013.47148 Published Online September 2013 (http://www.scirp.org/journal/jct) Quality of Life in Egyptian Children with Cancer Mohamed Fawzy1*, Mai Saleh2, Mohamed El-Wakil3, Zeinab Monir4, Eman Eltahlawy2 1Department of Pediatric Oncology, National Cancer Institute, Cairo University, Cairo, Egypt; 2Department of Environmental and Occupational Medicine, National Research Center, Cairo, Egypt; 3Department of Clinical Oncology, Faculty of Medicine, Beni-Suef University, Beni-Suef, Egypt, 4Department of Child Health, National Research Center, Cairo, Egypt. Email: *[email protected] Received August 9th, 2013; revised August 25th, 2013; accepted August 31st, 2013 Copyright © 2013 Mohamed Fawzy et al. This is an open access article distributed under the Creative Commons Attribution License, which permits unrestricted use, distribution, and reproduction in any medium, provided the original work is properly cited. ABSTRACT Background and Objectives: Cancer treatments leading to increased survival rates are reported to participate in the creation of debilitating physical and psychosocial deficits for cancer survivors. Measures of health-related quality of life (HRQOL) are designed to tap such consequences of cancer treatment together with the impact of the disease itself. Methods: Parents of 67 included patients aged 8 - 12 years, were asked to complete the parent proxy report of PedsQL™ 3.0 Cancer Module (Arabic version), as well as a separate sheet for socio-demographic data. Results: The ratio of Males to females was 1.8:1 among study patients with a median age of 8 years at diagnosis. Hematological ma- lignancies represented 70.1% of the sample, with the highest proportion for ALL (52.2%). Total QOL showed to be relatively low with mean value of 62.29 for the whole group. Subscales with least scores were for; worry (44.11), per- ceived physical appearance (50.6), and procedural anxiety (55.34). On the other hand, the best score was 75.98 for communication, followed by 72.63 for cognitive problems. The impacts of some medical and socio-demographic vari- ables on QOL and its subscales were elicited in our results. Conclusion: Increased treatment intensity, long duration of hospital admission, higher frequency of hospital visits, female sex, younger age at diagnosis, and large family size were all associated with a poorer total QOL and/or its subscales among Egyptian pediatric cancer patients. Keywords: Quality of Life; Children Cancer Patients; PedsQL™ 3.0 Cancer Module 1. Introduction Childhood cancer patients are now long term survivors with current survival rates approaching 90% [1]. Con- temporary therapies for pediatric malignancies represent the main contributor for such advancement [2]. However, same treatments leading to increased survival rates are reported to participate in the creation of debilitating phy- sical and psychosocial deficits for cancer survivors [3]. Health-related morbidity among childhood cancer survi- vors is mainly attributed to late effects including chro- nic health conditions and life-threatening complications during adulthood [4-6]. Measures of health-related qual- ity of life (HRQOL) are designed to tap such conse- quences of cancer treatment together with the impact of the disease itself [3]. HRQOL targets a variety of dimen- sions including physical, mental and social domains [7]. For childhood cancer patients, assessment of HRQOL at relevant points throughout the treatment process can help in the identification of acute dysfunction associated with both illness and treatment, as well as figuring out ex- pected residual dysfunction in long-term survivors [8- 11]. The present study was designed to identify the HR- QOL profile in Egyptian pediatric cancer patients. The impact of underlying disease, treatment and sociodemo- graphic variables on the total QOL and its domains was also evaluated. 2. Patients and Methods Patients: a convenient sample of 67 pediatric cancer pa- tients aged from 8 to 12 years with established diagnosis at the pediatric inpatient as well as outpatient clinic of the National Cancer Institute of Egypt were included onto study. Parents of every included patient were asked to complete the PedsQL™ 3.0 Cancer Module [3] (Ara- bic version), as well as a separate sheet for sociodemo- graphic data. Instrument: the PedsQL™ 3.0 Cancer Module—de- signed to measure HRQOL dimensions specifically tai- lored for pediatric cancer—was the instrument in use. It *Corresponding author. Copyright © 2013 SciRes. JCT  Quality of Life in Egyptian Children with Cancer 1257 investigated 8 domains with the total of 27 items for the whole module; 2 items for pain and hurt, 3 for each of procedural anxiety, treatment anxiety, worry, perceived physical appearance, and communication, whereas 5 items for each of nausea and cognitive problems. Linguistic translation: the parent proxy-report for chil- dren aged 8 - 12 years of the “PedsQL™ 3.0 Cancer Mo- dule” was translated into Arabic (native language of the study sample) using the PedsQL™ Measurement Model Translation Methodology. Linguistic validation process included forward translation from the source language (English) to the target language (Arabic), backward trans- lation to the source language, and finally cognitive de- briefing step according to PedsQL Cognitive Inter- viewing MethodologySM [12,13]. Detailed reports for every step throughout the whole process were sent to Mapi research Institute in Lyon, France, on behalf of Dr. James W. Varni, the copyright owner of the PedsQL™ for approval. A 5 point likert scale ranging from 0 for “never a problem” till 4 for “almost always a problem” was used for each item. The scale is converted to a cor- responding score from 0 to 100, where 0 represented the worst quality of life and 100 represented the best one. The total QOL is the average of the scores for all do- mains, while QOL for each domain is the average of scores of its items. Treatment related measures: a) intensity of cancer therapy: scored from 1 to 3: low intensity such that sur- gery only and/or six months chemotherapy with a favor- able prognosis had a score 1, medium intensity took the score of 2 for cases with chemotherapy longer than 6 months according to the treatment protocol in addition to an intermediate prognosis, 3 was the score for high in- tensity of therapy that represented treatment according to high risk protocols, bone marrow transplantation, and/or diseases with less favorable prognosis [14,15]. b) Phase of treatment: the on-treatment group was defined as any patient actively receiving anticancer therapy at any phase of the treatment protocol, whereas the follow-up group indicated patients ended their treatment and scheduled for timed interval follow up. c) Frequency of hospital visits: classified into either ≤3 or >3 visits per month. d) Length of hospital admission: had 3 levels: low for ad- mission periods within one third of the total duration of therapy, medium if admission period was about 1 - 2 thirds the total duration, and high if it exceeded 2 thirds the total treatment duration. e) Therapy duration: ≤6 month was considered to be low, between 6 month and 1 year was medium, and ≥1 year represented high duration of therapy. Indirect method for measuring treatment compliance (compliant or non-compliant) [16] was used through a single screening question “Is your child used to strictly follow instructions and take medications as the doctor prescribed?” with a parent report of “yes” or “no”. Other sociodemographic data included; residence (urban or rural), family size, and gender. Statistical analysis: scores for total QOL and the 8 subscales for each participant were calculated after the guidelines of the PedsQL™ 3.0 Cancer Module deve- loper. Descriptive statistics were expressed as mean and standard deviation. Data analysis was performed using the student t-test with SPSS version 18. p value < 0.05 was considered to be significant. 3. Results Descriptive demographic and medical data for the study sample are shown in Table 1. Study patients were 43 males and 24 females (1.8:1) with a median age of 8 years at diagnosis and 5.25 as mean value for family size. Patients with hematological malignancies represented 70.1% versus 29.9% with solid tumors, with the highest proportion for ALL (52.2%). The on-treatment and fol- low-up cancer groups had very close percentages of 53.7% and 46.3% respectively, together with 50.7% had treatment duration of 1 year or above at time of evalua- tion. The urban and rural distribution for residence was also 50.7% and 49.3%, respectively. Medium and high intensity of therapy (59.7% & 31.3% respectively) were much more represented than low intensity (9.0%). While hospital visits for 70.1% of the sample exceeded 3 times/ month, 43.3% had hospital admissions for more than two thirds of their treatment duration with a compliance rate of 89.6% of the whole sample. Total QOL showed to be relatively low with mean value of 62.29. Subscales with least scores were for; worry (44.11), perceived physical appearance (50.6), and procedural anxiety (55.34). On the other hand, the best score was 75.98 for communication, followed by 72.63 for cognitive problems, (Table 2). Table 3 shows the impact of different variables on QOL and its subscales. High and medium treatment in- tensities as well as long duration of hospital admission were associated with a poorer total QOL (p < 0.05). Per- ceived physical appearance was also affected by treat- ment intensity (p < 0.01) with more negative impact on female patients who also suffered more than males from treatment anxiety and worry (p < 0.05). Pain & hurt was increased among patients with; lower age (≤5 years) at time of diagnosis (p < 0.05), longer hospital admission (p < 0.01), and non-compliance to treatment (p < 0.01). The latter also affected the procedural anxiety domain sig- nificantly (p < 0.05), while long periods of hospital ad- mission deteriorated treatment anxiety subscale (p < 0.05). Larger family size (>5 members) was associated with a negative effect on communication subscale (p < 0.01). None of diagnosis subtypes (hematological/solid ma- lignancies), phase of treatment (on-treatment/follow-up), Copyright © 2013 SciRes. JCT 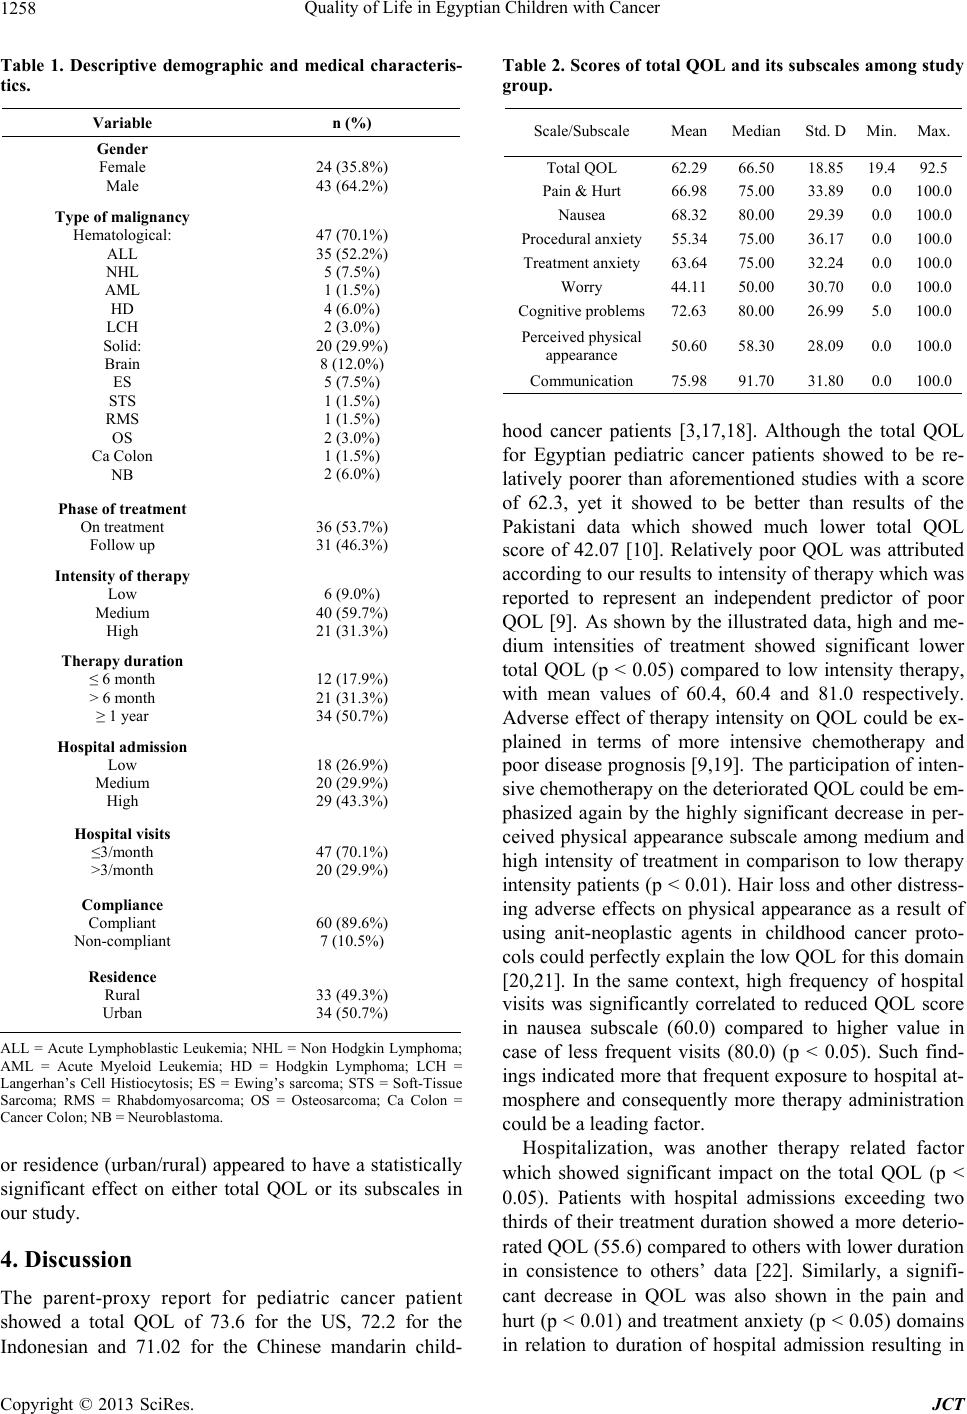 Quality of Life in Egyptian Children with Cancer 1258 Table 1. Descriptive demographic and medical characteris- tics. Variable n (%) Gender Female Male 24 (35.8%) 43 (64.2%) Type of malignancy Hematological: ALL NHL AML HD LCH Solid: Brain ES STS RMS OS Ca Colon NB 47 (70.1%) 35 (52.2%) 5 (7.5%) 1 (1.5%) 4 (6.0%) 2 (3.0%) 20 (29.9%) 8 (12.0%) 5 (7.5%) 1 (1.5%) 1 (1.5%) 2 (3.0%) 1 (1.5%) 2 (6.0%) Phase of treatment On treatment Follow up 36 (53.7%) 31 (46.3%) Intensity of therapy Low Medium High 6 (9.0%) 40 (59.7%) 21 (31.3%) Therapy duration ≤ 6 month > 6 month ≥ 1 year 12 (17.9%) 21 (31.3%) 34 (50.7%) Hospital admission Low Medium High 18 (26.9%) 20 (29.9%) 29 (43.3%) Hospital visits ≤3/month >3/month 47 (70.1%) 20 (29.9%) Compliance Compliant Non-compliant 60 (89.6%) 7 (10.5%) Residence Rural Urban 33 (49.3%) 34 (50.7%) ALL = Acute Lymphoblastic Leukemia; NHL = Non Hodgkin Lymphoma; AML = Acute Myeloid Leukemia; HD = Hodgkin Lymphoma; LCH = Langerhan’s Cell Histiocytosis; ES = Ewing’s sarcoma; STS = Soft-Tissue Sarcoma; RMS = Rhabdomyosarcoma; OS = Osteosarcoma; Ca Colon = Cancer Colon; NB = Neuroblastoma. or residence (urban/rural) appeared to have a statistically significant effect on either total QOL or its subscales in our study. 4. Discussion The parent-proxy report for pediatric cancer patient showed a total QOL of 73.6 for the US, 72.2 for the Indonesian and 71.02 for the Chinese mandarin child- Table 2. Scores of total QOL and its subscales among study group. Scale/Subscale MeanMedian Std. D Min.Max. Total QOL 62.2966.50 18.85 19.492.5 Pain & Hurt 66.9875.00 33.89 0.0100.0 Nausea 68.3280.00 29.39 0.0100.0 Procedural anxiety 55.3475.00 36.17 0.0100.0 Treatment anxiety 63.6475.00 32.24 0.0100.0 Worry 44.1150.00 30.70 0.0100.0 Cognitive problems72.6380.00 26.99 5.0100.0 Perceived physical appearance 50.6058.30 28.09 0.0100.0 Communication 75.9891.70 31.80 0.0100.0 hood cancer patients [3,17,18]. Although the total QOL for Egyptian pediatric cancer patients showed to be re- latively poorer than aforementioned studies with a score of 62.3, yet it showed to be better than results of the Pakistani data which showed much lower total QOL score of 42.07 [10]. Relatively poor QOL was attributed according to our results to intensity of therapy which was reported to represent an independent predictor of poor QOL [9]. As shown by the illustrated data, high and me- dium intensities of treatment showed significant lower total QOL (p < 0.05) compared to low intensity therapy, with mean values of 60.4, 60.4 and 81.0 respectively. Adverse effect of therapy intensity on QOL could be ex- plained in terms of more intensive chemotherapy and poor disease prognosis [9,19]. The participation of inten- sive chemotherapy on the deteriorated QOL could be em- phasized again by the highly significant decrease in per- ceived physical appearance subscale among medium and high intensity of treatment in comparison to low therapy intensity patients (p < 0.01). Hair loss and other distress- ing adverse effects on physical appearance as a result of using anit-neoplastic agents in childhood cancer proto- cols could perfectly explain the low QOL for this domain [20,21]. In the same context, high frequency of hospital visits was significantly correlated to reduced QOL score in nausea subscale (60.0) compared to higher value in case of less frequent visits (80.0) (p < 0.05). Such find- ings indicated more that frequent exposure to hospital at- mosphere and consequently more therapy administration could be a leading factor. Hospitalization, was another therapy related factor which showed significant impact on the total QOL (p < 0.05). Patients with hospital admissions exceeding two thirds of their treatment duration showed a more deterio- rated QOL (55.6) compared to others with lower duration in consistence to others’ data [22]. Similarly, a signifi- cant decrease in QOL was also shown in the pain and hurt (p < 0.01) and treatment anxiety (p < 0.05) domains in relation to duration of hospital admission resulting in Copyright © 2013 SciRes. JCT 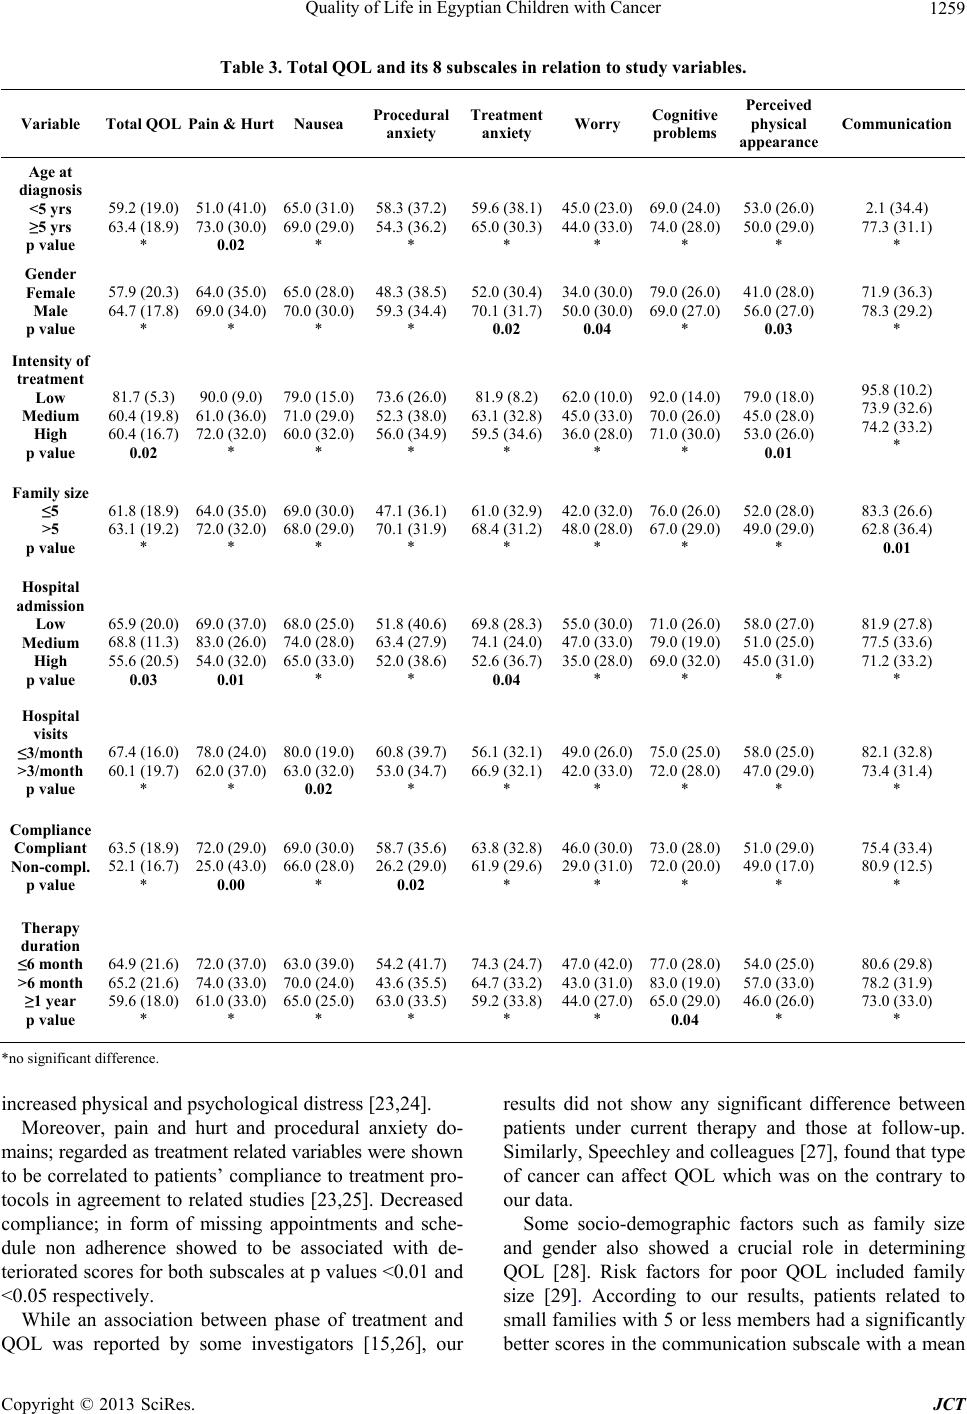 Quality of Life in Egyptian Children with Cancer Copyright © 2013 SciRes. JCT 1259 Table 3. Total QOL and its 8 subscales in relation to study variables. Variable Total QOL Pain & Hurt Nausea Procedural anxiety Treatment anxiety Worry Cognitive problems Perceived physical appearance Communication Age at diagnosis <5 yrs ≥5 yrs p value 59.2 (19.0) 63.4 (18.9) * 51.0 (41.0) 73.0 (30.0) 0.02 65.0 (31.0) 69.0 (29.0) * 58.3 (37.2) 54.3 (36.2) * 59.6 (38.1) 65.0 (30.3) * 45.0 (23.0) 44.0 (33.0) * 69.0 (24.0) 74.0 (28.0) * 53.0 (26.0) 50.0 (29.0) * 2.1 (34.4) 77.3 (31.1) * Gender Female Male p value 57.9 (20.3) 64.7 (17.8) * 64.0 (35.0) 69.0 (34.0) * 65.0 (28.0) 70.0 (30.0) * 48.3 (38.5) 59.3 (34.4) * 52.0 (30.4) 70.1 (31.7) 0.02 34.0 (30.0) 50.0 (30.0) 0.04 79.0 (26.0) 69.0 (27.0) * 41.0 (28.0) 56.0 (27.0) 0.03 71.9 (36.3) 78.3 (29.2) * Intensity of treatment Low Medium High p value 81.7 (5.3) 60.4 (19.8) 60.4 (16.7) 0.02 90.0 (9.0) 61.0 (36.0) 72.0 (32.0) * 79.0 (15.0) 71.0 (29.0) 60.0 (32.0) * 73.6 (26.0) 52.3 (38.0) 56.0 (34.9) * 81.9 (8.2) 63.1 (32.8) 59.5 (34.6) * 62.0 (10.0) 45.0 (33.0) 36.0 (28.0) * 92.0 (14.0) 70.0 (26.0) 71.0 (30.0) * 79.0 (18.0) 45.0 (28.0) 53.0 (26.0) 0.01 95.8 (10.2) 73.9 (32.6) 74.2 (33.2) * Family size ≤5 >5 p value 61.8 (18.9) 63.1 (19.2) * 64.0 (35.0) 72.0 (32.0) * 69.0 (30.0) 68.0 (29.0) * 47.1 (36.1) 70.1 (31.9) * 61.0 (32.9) 68.4 (31.2) * 42.0 (32.0) 48.0 (28.0) * 76.0 (26.0) 67.0 (29.0) * 52.0 (28.0) 49.0 (29.0) * 83.3 (26.6) 62.8 (36.4) 0.01 Hospital admission Low Medium High p value 65.9 (20.0) 68.8 (11.3) 55.6 (20.5) 0.03 69.0 (37.0) 83.0 (26.0) 54.0 (32.0) 0.01 68.0 (25.0) 74.0 (28.0) 65.0 (33.0) * 51.8 (40.6) 63.4 (27.9) 52.0 (38.6) * 69.8 (28.3) 74.1 (24.0) 52.6 (36.7) 0.04 55.0 (30.0) 47.0 (33.0) 35.0 (28.0) * 71.0 (26.0) 79.0 (19.0) 69.0 (32.0) * 58.0 (27.0) 51.0 (25.0) 45.0 (31.0) * 81.9 (27.8) 77.5 (33.6) 71.2 (33.2) * Hospital visits ≤3/month >3/month p value 67.4 (16.0) 60.1 (19.7) * 78.0 (24.0) 62.0 (37.0) * 80.0 (19.0) 63.0 (32.0) 0.02 60.8 (39.7) 53.0 (34.7) * 56.1 (32.1) 66.9 (32.1) * 49.0 (26.0) 42.0 (33.0) * 75.0 (25.0) 72.0 (28.0) * 58.0 (25.0) 47.0 (29.0) * 82.1 (32.8) 73.4 (31.4) * Compliance Compliant Non-compl. p value 63.5 (18.9) 52.1 (16.7) * 72.0 (29.0) 25.0 (43.0) 0.00 69.0 (30.0) 66.0 (28.0) * 58.7 (35.6) 26.2 (29.0) 0.02 63.8 (32.8) 61.9 (29.6) * 46.0 (30.0) 29.0 (31.0) * 73.0 (28.0) 72.0 (20.0) * 51.0 (29.0) 49.0 (17.0) * 75.4 (33.4) 80.9 (12.5) * Therapy duration ≤6 month >6 month ≥1 year p value 64.9 (21.6) 65.2 (21.6) 59.6 (18.0) * 72.0 (37.0) 74.0 (33.0) 61.0 (33.0) * 63.0 (39.0) 70.0 (24.0) 65.0 (25.0) * 54.2 (41.7) 43.6 (35.5) 63.0 (33.5) * 74.3 (24.7) 64.7 (33.2) 59.2 (33.8) * 47.0 (42.0) 43.0 (31.0) 44.0 (27.0) * 77.0 (28.0) 83.0 (19.0) 65.0 (29.0) 0.04 54.0 (25.0) 57.0 (33.0) 46.0 (26.0) * 80.6 (29.8) 78.2 (31.9) 73.0 (33.0) * *no significant difference. increased physical and psychological distress [23,24]. Moreover, pain and hurt and procedural anxiety do- mains; regarded as treatment related variables were shown to be correlated to patients’ compliance to treatment pro- tocols in agreement to related studies [23,25]. Decreased compliance; in form of missing appointments and sche- dule non adherence showed to be associated with de- teriorated scores for both subscales at p values <0.01 and <0.05 respectively. While an association between phase of treatment and QOL was reported by some investigators [15,26], our results did not show any significant difference between patients under current therapy and those at follow-up. Similarly, Speechley and colleagues [27], found that type of cancer can affect QOL which was on the contrary to our data. Some socio-demographic factors such as family size and gender also showed a crucial role in determining QOL [28]. Risk factors for poor QOL included family size [29]. According to our results, patients related to small families with 5 or less members had a significantly better scores in the communication subscale with a mean  Quality of Life in Egyptian Children with Cancer 1260 value of 83.3 compared to 68.2 in larger sized families (p < 0.05). This could be explained by difficult interper- sonal relationships and less parental care offered to their children with the increased number. The poorer QOL among female versus male patients (p < 0.05) in more than one domain was also matched with similar studies [30,31]. Such domains included treatment anxiety, worry and perceived physical appearance. For residence, on the other hand, on showing no significant differences in QOL and its subscales between the urban and rural resi- dences, our results agreed with literature reporting the weak influence of such a parameter on QOL [32]. In summary: increased treatment intensity, long dura- tion of hospital admission, high frequency of hospital visits, female sex and younger age were all associated with a poorer total QOL and/or its subscales among Egyptian pediatric cancer patients. REFERENCES [1] G. W. Chang, A. Shad, S. N. Myers and K. Hennessy, “Late Effects in Cancer Survivors: The Shared Care Model,” Curre nt Oncology Reports, Vol. 14, No. 2, 2012, pp. 182-190. doi:10.1007/s11912-012-0224-1 [2] C. Eiser and R. Morse, “A Review of Measures of Qual- ity of Life for Children with Chronic Illness,” Archives of Disease in Childhood, Vol. 84, 2001, pp. 205-211. doi:10.1136/adc.84.3.205 [3] J. W. Varni, T. M. Burwinkle, E. R. Katz, K. Meeske and P. Dickinson, “The PedsQL in Pediatric Cancer: Reliabil- ity and Validity of the Pediatric Quality of Life Inventory Generic Core Scales, Multidimensional Fatigue Scale, and Cancer Module,” Cancer, Vol. 94, No. 7, 2002, pp. 2090-2106. doi:10.1002/cncr.10428 [4] M. F. Lorenzi, L. Xie, P. C. Rogers, S. Pritchard, K. God- dard and M. L. McBride, “Hospital-Related Morbidity among Childhood Cancer Survivors in British Columbia, Canada: Report of the Childhood, Adolescent, Young Adult Cancer Survivors (CAYACS) Program,” Interna- tional Journal of Cancer, Vol. 128, No. 7, 2011, pp. 1624-1631. doi:10.1002/ijc.25751 [5] M. M. Geenen, M. C. Cardous-Ubbink, C. van den Bos, H. J. van der Pal, R. C. Heinen, M. W. Jaspers, C. C. Koning, F. Oldenburger, N. E. Langeveld, A. A. Hart, P. J. Bakker, H. N. Caron and F. E. van Leeuwen, “Medical Assessment of Adverse Health Outcomes in Long-Term Survivors of Childhood Cancer,” Journal of the American Medical Association, Vol. 297, No. 24, 2007, pp. 2705- 2715. doi:10.1001/jama.297.24.2705 [6] B. A. Kurt, V. G. Nolan, K. K. Ness, J. P. Neglia, J. M. Tersak, M. M. Hudson, G. T. Armstrong, R. J. Hutchin- son, W. M. Leisenring, K. C. Oeffinger, L. L. Robison and M. Arora, “Hospitalization Rates among Survivors of Childhood Cancer in the Childhood Cancer Survivor Study Cohort,” Pediatric Blood & Cancer, Vol. 59, No. 1, 2012, pp. 126-132. doi:10.1002/pbc.24017 [7] J. W. Varni, M. Seid and C. A. Rode, “PedQLTM 4.0: Measurement Model for the Pediatric Quality of Life In- ventoryTM,” Medical Ca re, Vol. 37, 1999, pp. 126-139. doi:10.1097/00005650-199902000-00003 [8] N. Yaris, M. Yavuz, A. Yavuz and A. Okten, “Assess- ment of Quality of Life in Pediatric Cancer Patients at Diagnosis and During Therapy,” Turkish Journal of Can- cer, Vol. 31, No. 4, 2001, pp. 139-149. [9] L. Sung, R. J. Klaassen, D. Dix, S. Pritchard, R. Yanof- sky, B. Dzolganovski, R. Almeida and A. Klassen, “Iden- tification of Paediatric Cancer Patients with Poor Quality of Life,” British Journal of Cancer, Vol. 100, No. 1, 2009, pp. 82-88. doi:10.1038/sj.bjc.6604826 [10] Z. Chaudhry and S. Siddiqui, “Health Related Quality of Life Assessment in Pakistani Paediatric Cancer Patients Using PedsQLTM 4.0 Generic Core Scale and PedsQL™ Cancer Module,” Health and Quality of Life Outcomes, Vol. 10, 2012, p. 52. doi:10.1186/1477-7525-10-52 [11] L. Fallowfield, “Quality of Life: A New Perspective for Cancer Patients,” Nature Reviews Cancer, Vol. 2, 2002, pp. 873-879. doi:10.1038/nrc930 [12] J. W. Varni, T. M. Burwinkle, M. Seid and D. Skarr, “The PedsQL 4.0 as a Pediatric Population Health Mea- sure: Feasibility, Reliability, and Validity,” Ambulatory Pediatrics, Vol. 3, No. 6, 2003, pp. 329-341. doi:10.1367/1539-4409(2003)003<0329:TPAAPP>2.0.C O;2 [13] M. Sprangers, A. Cull, M. Groenvold, K. Bjordal, J. Blazeby and N. K. Aaronson, “The European Organiza- tion for Research and Treatment of Cancer approach to Developing Questionnaire Modules: An Update and Over- view,” Quality of Life Research, Vol. 7, 1998, pp. 291- 300. doi:10.1023/A:1008890401133 [14] O. Magal-Vardi, N. Laor, A. Toren, L. Strauss, L. Wol- mer, B. Bielorai, G. Rechavi and P. Toren, “Psychiatric Morbidity and Quality of Life in Children with Malig- nancies and Their Parents,” The Journal of Nervous and Mental Disease, Vol. 92, 2004, pp. 872-875. doi:10.1097/01.nmd.0000146881.00129.ec [15] M. A. Landolt, M. Vollrath, F. K. Niggli, H. E. Gnehm and F. H. Sennhauser, “Health-Related Quality of Life in Children with Newly Diagnosed Cancer: A One Year Follow-Up Study,” Health and Quality of Life Outcomes, Vol. 4, 2006, p. 63. doi:10.1186/1477-7525-4-63 [16] P. M. Ho, C. L. Bryson and J. S. Rumsfeld, “Medication Adherence: Its Importance in Cardiovascular Outcomes,” Circulation, Vol. 119, No. 23, 2009, pp. 3028-3035. doi:10.1161/CIRCULATIONAHA.108.768986 [17] M. N. Sitaresmi, S. Mostert, C. M. Gundy, Sutaryo and A. J. P. Veerman, “Health-Related Quality of Life Assess- ment in Indonesian Childhood Acute Lymphoblastic Leu- kemia,” Health and Quality of Life Outcomes, Vol. 6, No. 1, 2008, p. 96. doi:10.1186/1477-7525-6-96 [18] Y. Ji, S. Chen and K. Li, “Measuring Health-Related Quality of Life in Children with Cancer Living in Main- land China: Feasibility, Reliability and Validity of the Chinese Mandarin Version of PedsQL 4.0 Generic Core Scales and 3.0 Cancer Module,” Health and Quality of Life Outcomes, Vol. 9, 2011, p. 103 doi:10.1186/1477-7525-9-103 [19] C. R. Baggott, M. Dodd, C. Kennedy, N. Marina, K. K. Copyright © 2013 SciRes. JCT  Quality of Life in Egyptian Children with Cancer Copyright © 2013 SciRes. JCT 1261 Matthay, B. Cooper and C. Miaskowski, “An Evaluation of the Factors that Affect the Health-Related Quality of Life of Children Following Myelosuppressive Chemo- therapy,” Supportive Care in Cancer, Vol. 19, No. 3, 2011, pp. 353-361. doi:10.1007/s00520-010-0824-y [20] E. Grevelman and W. P. Breed, “Prevention of Che- motherapy-Induced Hair Loss by Scalp Cooling,” Annals of Oncology, Vol. 16, No. 3, 2005, pp. 352-358. doi:10.1093/annonc/mdi088 [21] K. Lotfi-Jam, M. Carey, M. Jefford, P. Schofield, C. Charleson and S. Aranda, “Nonpharmacologic Strategies for Managing Common Chemotherapy Adverse Effects: A Systematic Review,” Journal of Clinical Oncology, Vol. 26, No. 34, 2008, pp. 5618-5629. doi:10.1200/JCO.2007.15.9053 [22] M. W. Bishop, “Therapy-Related Events and Health- Related Quality of Life for Children with Leukemia and Lymphoma,” 2012. http://etd.ohiolink.edu/view.cgi?acc_num=ucin13425441 50 [23] S. A. Payne, “A Study of Quality of Life in Cancer Pa- tients Receiving Palliative Chemotherapy,” Social Sci- ence & Medicine, Vol. 35, No. 12, 1992, pp. 1505-1509. doi:10.1016/0277-9536(92)90053-S [24] J. M. Borras, A. Sanchez-Hernandez, M. Navarro, M. Martinez, E. Mendez, J. L. L. Ponton, J. A. Espinas and J. R. Germa, “Compliance, Satisfaction, and Quality of Life of Patients with Colorectal Cancer Receiving Home Che- motherapy or Outpatient Treatment: A Randomised Con- trolled Trial,” British Medical Journal, Vol. 322, 2001, pp. 1-5. doi:10.1136/bmj.322.7290.826 [25] J. L. Richardson, G. Marks and A. Levine, “The Influence of Symptoms of Disease and Side Effects of Treatment on Compliance with Cancer Therapy,” Journal of Clinical Oncology, Vol. 6, No. 11, 1988, pp. 1746-1752. [26] C. Eiser and R. Eiser, “Mothers’ Ratings of Quality of Life in Childhood Cancer: Initial Optimism Predicts Im- provement over Time,” Psychology & Health, Vol. 22, No. 5, 2007, pp. 535-543. doi:10.1080/14768320701202074 [27] K. N. Speechley, M. Barrera, A. K. Shaw, H. I. Morrison and E. Maunsell, “Health Related Quality of Life among Child and Adolescent Survivors of Childhood Cancer,” Journal of Clinical Oncology, Vol. 24, No. 16, 2006, pp. 2536-2543. doi:10.1200/JCO.2005.03.9628 [28] K. A. Moore, S. Vandivere and Z. Redd, “A Sociodemo- graphic Risk Index,” Social Indicators Research, Vol. 75, No. 1, 2006, pp. 45-81. doi:10.1007/s11205-004-6398-7 [29] L. P. Barakat, P. L. Marmer and L. A. Schwartz, “Quality of Life of Adolescents with Cancer: Family Risks and Resources,” Health and Quality of Life Outcomes, Vol. 8, 2010, p. 63. doi:10.1186/1477-7525-8-63 [30] K. A. Meeske, S. K. Patel and S. N. Palmer, “Factors Associated with Health-Related Quality of Life in Pediat- ric Cancer Survivors. Factors Associated with Health- Related Quality of Life in Pediatric Cancer Survivors,” Pediatric Blood and Cancer, Vol. 49, 2007. pp. 298-305. doi:10.1002/pbc.20923 [31] M. A. Cantrell, “Health-Related Quality of Life in Child- hood Cancer: State of the Science,” Oncology Nursing Forum, Vol. 34, No. 1, 2007, pp. 103-111. doi:10.1188/07.ONF.103-111 [32] I. Sabbah, H. Sabbah, S. Sabbah, H. Akoum, N. Droubi and M. Mercier, “Measurement Properties of the Arabic Lebanon Version of the Pediatric Quality of Life Inven- tory 4.0 Generic Core Scales for Young Child (5 - 7 Years), and Child Aged 8 - 12 Years: Quality of Life in Urban and Rural Children in Lebanon,” Creative Educa- tion, Vol. 3, 2012, pp. 959-970. |